


Q4 2024 Report: Crypto Market to Be Range-bound by End of 2024
The Crypto market remains largely range-bound as we approach the final quarter of 2024. This relative lack of direction can be partly explained by the uncertainties ahead, especially in the run-up to the US presidential election.
11/19/20247 min read


Based on this theory, growth rates tend to be highest during the transition between “early adopters” and “early majority” which occurs at adoption rates above 20%.
After all, nothing changes investor sentiment like price. One of the most anticipated catalysts right now is the US presidential election in November, will Trump be elected to lead the flow of US money into crypto?
If Donald Trump is re-elected as US president, crypto market analysts have offered a number of different opinions and predictions on the impact this will have on the market, especially the impact on central bank digital currencies (CBDCs).
Many analysts believe that: “Trump's re-election can bring both opportunities and challenges to the crypto market, and investors need to closely monitor the political situation as well as the government's policies to assess the impact on digital assets in the future.”
Despite much talk about Trump's re-election, we still believe that a combination of macro and on-chain factors in 2024-2025 will lead to a more pronounced bull market than 2020.
For example, most on-chain metrics imply that Bitcoin's supply is significantly scarcer and that accumulation this cycle is more pronounced than the previous cycle in 2020. Take a look at some of HCCVenture's data on Bitcoin analytics:
Same-exchange source % at 5-year low.
% of active supply over 1 year old at all-time high
March capitalization HODL wave is higher than the previous cycle's peak.
And some other on-chain data that HCCVenture has mentioned in other weekly analysis posts, all of these metrics imply that both the supply and liquidity of Bitcoin on exchanges are relatively scarce in terms of supply distribution in the next bull cycle.
Generally in bull cycles, there is a tendency to distribute previously accumulated funds from long-term holders to new entrants at higher prices.
The strong accumulation during the recent bear cycle shows there is still plenty of room to distribute these coins to new investors.
Additionally, the lack of liquidity in Bitcoin and its supply is amplified by the fact that many Bitcoin lending venues that shut down during the bearish market eventually provided additional liquidity through reinvested BTC such as BlockFi, Celcius, Genesis, and Voyager.
Polymarket Perspective
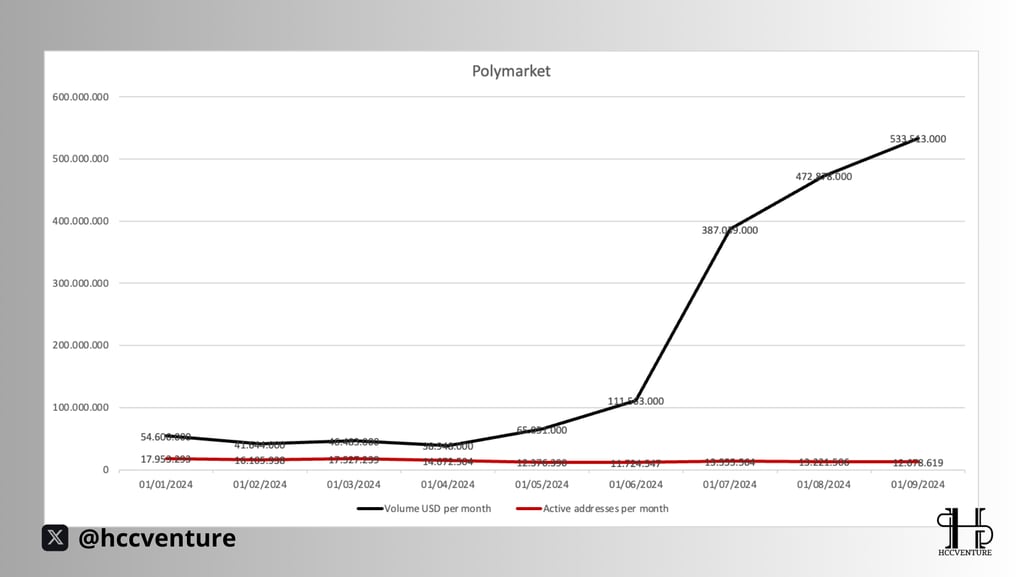
Polymarket is a prediction market that allows users to bet on the outcome of future events, from political events to sports results and other social issues. The groundbreaking election-year use of cryptocurrency is a prime example of how blockchain technology can help increase transparency, access and trust in markets and information.
With the development trend of blockchain and crypto technology, Polymarket has the ability to expand and improve the features of the platform, to attract more users and enhance the experience. The platform can provide more types of prediction contracts and analytical tools to help users make better decisions.
In terms of daily trading volume, it reflects the actual user activity on the platform. A high trading volume indicates great interest from users and better liquidity for prediction contracts.
If Polymarket records a consistently high daily trading volume, for example over $1 million, this implies that users are actively betting and have confidence in the viability of the outcomes they predict. Conversely, if the volume is low (under $500,000), this may indicate a cooling of the user base or a lack of interest in the events taking place.
Meanwhile, the number of monthly traders shows the level of community engagement with the platform over a period of time. Growth in the number of traders shows that the platform is expanding and attracting new users.
Actual Analysis: Polymarket has seen an increase in monthly traders, say from 5,000 to 10,000 in a few months, which could reflect increased interest in the events offered on the platform. Conversely, if the number of traders has declined, it could be because users no longer see the value in participating or competition from other platforms.
To boost both trading volume and number of traders, Polymarket may need to consider marketing strategies, offer more diverse products, and improve user experience. These measures could help attract new users while retaining existing ones.
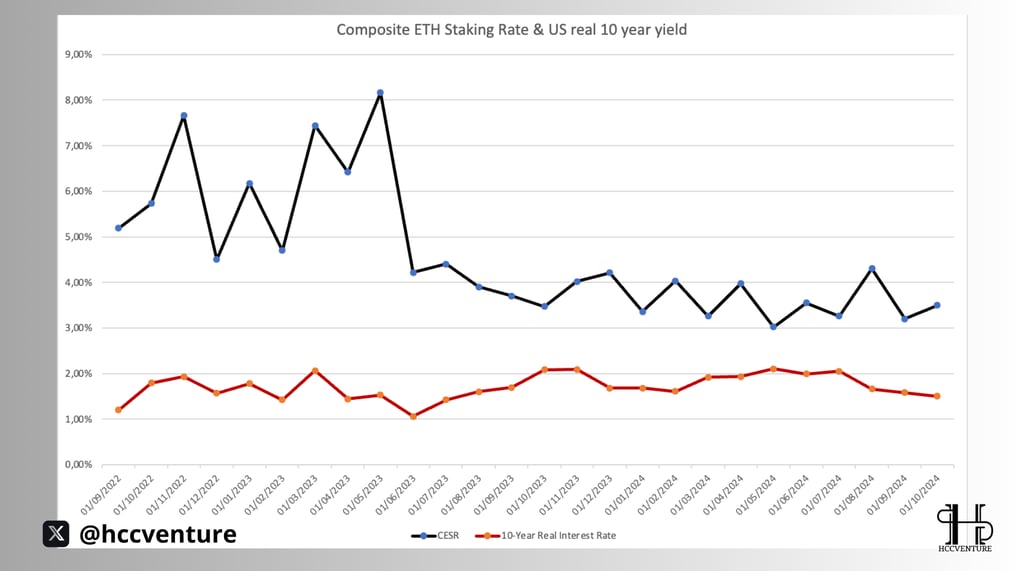
Recently, Ethereum staking yields have been in the spotlight as they have surpassed the real (inflation-adjusted) yield of the 10-year US Treasury bond by more than 2x. This has several important implications for investors and financial markets:
First, with the current average staking yield of around 5-7% (compared to around 2-3% real yield on 10-year bonds), many investors are seeing staking as a more attractive investment option. This affects the psychology of investors who earn higher returns from Ethereum.
Second, the gap between staking and government bond yields is relatively large. When the real interest rates of safe assets such as bonds decrease, investors tend to seek riskier investment options to optimize profits.
In addition, the increase in the number of staking participants can also increase the demand for Ethereum, thereby creating an incentive to attract investors to the network. This contributes to reducing the circulating supply of ETH on the market.
While high yields are attractive, investors should also consider the risks associated with staking, including high price volatility, technical risks, and security concerns. As inflation continues to remain high and bond yields fail to keep pace, the likelihood of Ethereum staking becoming a more popular investment method may increase, creating changes in the investment style of many.
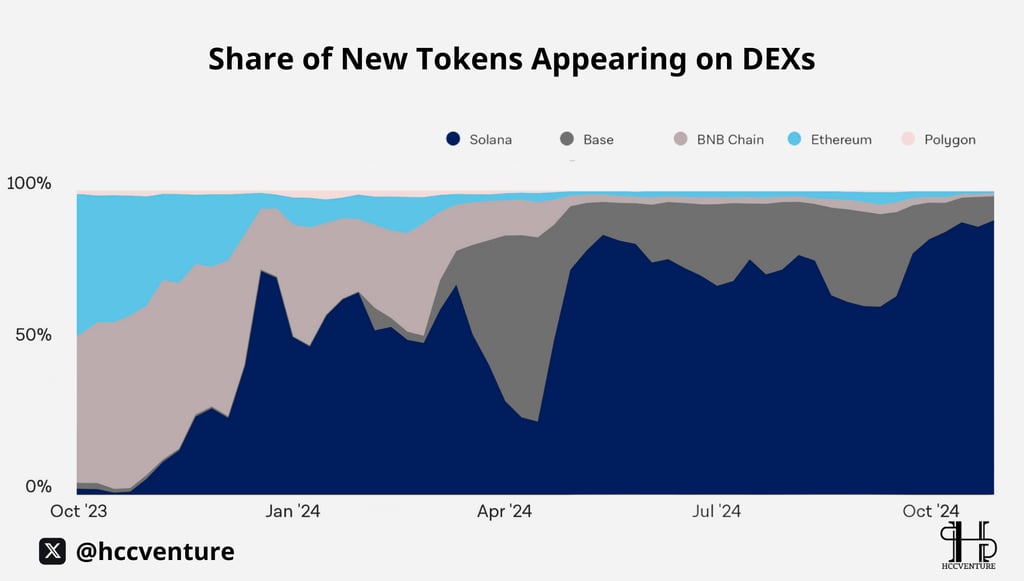
Over the past year, the number of new tokens issued has skyrocketed 13 times, showing a strong trend and recovery in the cryptocurrency sector. Solana, in particular, has dominated this market and received the majority of attention from the community.
The 13x increase in the number of tokens launched shows the high demand for new products and services in the crypto space. This also reflects the growth of DeFi, NFT, and Web3 applications, where many new projects are looking to attract capital from investors.
Solana has emerged as the largest token issuer, thanks to its fast transaction speeds and low fees. This has attracted many developers to the platform, creating a host of new projects. Solana is not only a trading platform but also a development environment for many innovative ideas.
The proliferation of tokens on Solana gives users more choices in investment and usage. These new tokens can be from a variety of fields, from DeFi, entertainment, to art, bringing diversity to the crypto space.
Solana’s leadership in issuing new tokens could create a positive trend for the value of SOL. As more new projects are built on Solana, the demand for SOL could increase, leading to an increase in the value of the coin.
While the rise of new tokens creates many opportunities, it is not without risks. Many new projects are unclear in terms of viability and can lead to “rug pull” (scams). Therefore, investors need to be cautious and do thorough research before investing in new tokens.
Market Overview
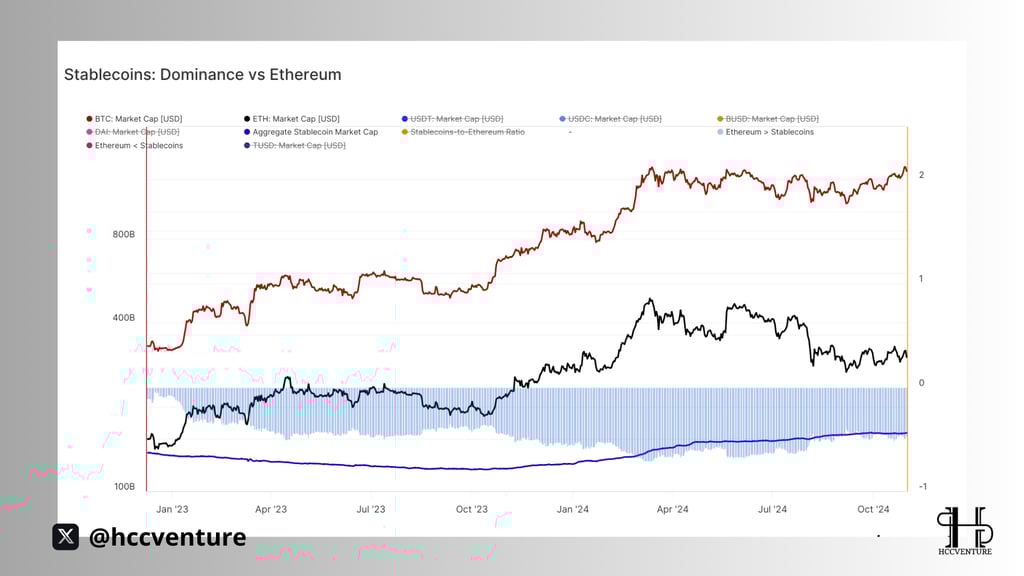
BTC and Stablecoin Dominance Grows in Q3
In Q3, the dominance of Bitcoin (BTC) and stablecoins saw a significant increase as investors in the market moved towards the highest quality assets.
Bitcoin has seen its dominance increase. When there is a lot of uncertainty in the global economy, Bitcoin is often seen as a “digital gold”, attracting capital flows from investors looking for safe-haven assets.
Besides Bitcoin, stablecoins such as USDT and USDC also recorded an increase in dominance. Stablecoins provide a convenient solution to store value and make transactions without facing unpredictable market fluctuations.
The rise in BTC and stablecoin dominance may also reflect general market sentiment amid rising inflation and uncertain monetary policies. Many investors have chosen to hold BTC and stablecoins to protect their assets from inflation.
The increase in dominance of these assets not only has a positive impact on the value of BTC but also on the development of stablecoin and DeFi (Decentralized Finance) related projects. As more people use stablecoins, DeFi protocols will also have the opportunity to expand and grow.
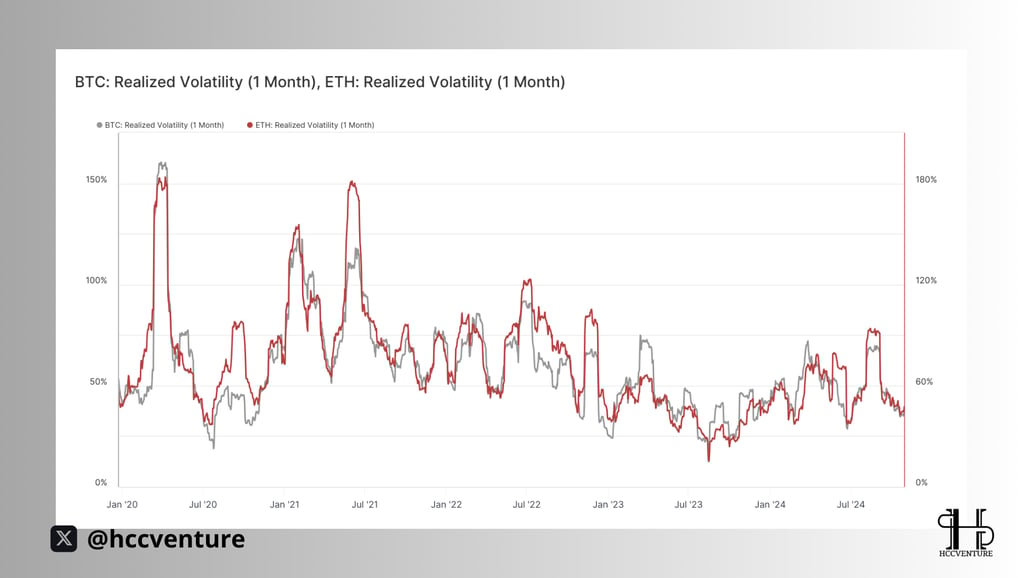
Bitcoin's movement against Ethereum in real terms shows that the trend is showing a significant decline compared to mid-2020 and 2021.
During the peak period in late 2021, BTC's monthly volatility recorded above 100. As of October 2023, this volatility has decreased to only around 60%, showing Bitcoin's stability in the current context.
On the other hand, in May 2022 ETH volatility reached 150% and by October 2023 the figure had dropped by more than 70%, hovering around 80% on a monthly average.
The trend of decreasing volatility may continue as the market matures, as regulations and legal frameworks become increasingly refined, along with the rise of crypto-related financial products such as ETFs.
Daily trading volumes of ETH and BTC have increased significantly, with BTC reaching around $30 billion and ETH reaching around $12 billion in recent months. Participation from institutional investors has also increased, with their percentage of total trading at 40%.
The decrease in volatility of BTC and ETH shows that the cryptocurrency market has matured, with more investors and institutions participating, which contributes to reducing volatility and increasing confidence in prices. The increased stability also shows that investors are holding positions for the longer term, instead of just making short-term speculative trades.
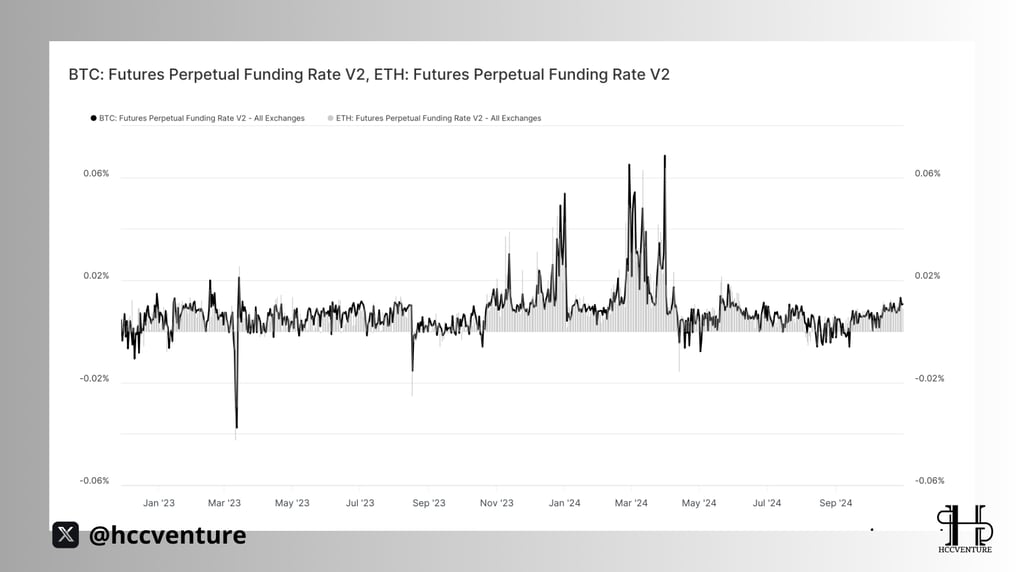

Perpetual futures allow investors to hold positions for the long term without having to worry about expiration dates. Funding rates are an important indicator in this market, helping to determine the cost of maintaining an open position.
BTC funding rate fluctuates from 0.01% to 0.05% every 8 hours during Bitcoin sideways periods. It can be seen that when the price suddenly increases, the funding rate increases by 0.1% or more, which indicates that investors tend to open higher buy (long) positions.
Around October 2023, the average funding rate of BTC was around 0.015% every 8 hours, indicating a relative stability in investor sentiment.
Additionally, ETH's funding rate typically fluctuates between 0.01% and 0.05% every 8 hours, similar to BTC. This rate can change much faster during times of high market volatility, and has peaked at 0.12% during strong ETH price increases.
Both BTC and ETH show relatively similar funding rates, with certain peaks reflecting strong investor participation. ETH typically sees greater volatility in funding rates than BTC, reflecting the more volatile nature of the Ethereum market during certain periods.
........................
See more and download the full pdf file of the cryptocurrency market report Q3 2024:
Explore HCCVenture group
HCCVenture © 2023. All rights reserved.


Connect with us
Popular content
Contact to us
E-mail : sp_contact@hccventure.com
Register : https://linktr.ee/holdcoincventure
Disclaimer: The information on this website is for informational purposes only and should not be considered investment advice. We are not responsible for any risks or losses arising from investment decisions based on the content here.
TERMS AND CONDITIONS • CUSTOMER PROTECTION POLICY
ANALYTICAL AND NEWS CONTENT IS COMPILED AND PROVIDED BY EXPERTS IN THE FIELD OF DIGITAL FINANCE AND BLOCKCHAIN BELONGING TO HCCVENTURE ORGANIZATION, INCLUDING OWNERSHIP OF THE CONTENT.
RESPONSIBLE FOR MANAGING ALL CONTENT AND ANALYSIS: HCCVENTURE FOUNDER - TRUONG MINH HUY
Read warnings about scams and phishing emails — REPORT A PROBLEM WITH OUR SITE.