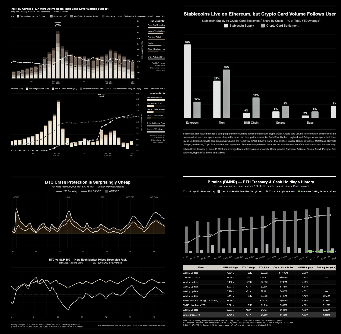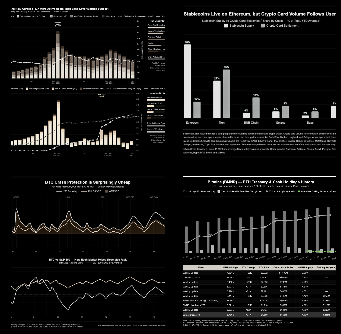


The analysis of credit leverage in the crypto market shows a gradual and controlled decrease.
The crypto market is entering a phase of systemic delevuring, but it doesn't yet have the characteristics of a credit crisis .
INSIGHTS
8/30/202623 min read


The analysis of credit leverage in the crypto market shows a gradual and controlled decrease
The crypto market is entering a phase of systemic delevuring, but it doesn't yet have the characteristics of a credit crisis .
Analysis • 30 July, 2026


Market Overview
The total size of lending in the crypto-backed cryptocurrency market decreased by $11.33 billion, or 16.78%, to $56.16 billion . This marks the third consecutive year of declining lending activity and the first time that all three groups—CeFi, DeFi, and crypto-backed stablecoin CDPs—have simultaneously contracted. However, more important than the absolute scale of the decline lies in the speed and structure of the deleveraging process ; current data reflects a relatively sequential balance sheet adjustment, rather than a sudden credit contraction due to forced liquidation, insolvency, or the collapse of credit counterparties.
Total crypto-collateralized lending fell to $56.16 billion, and considering only DeFi lending, the value of outstanding loans decreased by $7.79 billion, equivalent to a 27.61% QoQ decline, to $20.43 billion . This marks the third consecutive decline in DeFi lending and is also the largest contributor to the overall market downturn. On the other hand, the 27.61% decline in DeFi lending should be evaluated in relation to the entire market rather than as an isolated signal. This result suggests that the current delevering process is not focused on a single protocol or financial model but is occurring simultaneously across multiple layers of the crypto credit system.
For corporate treasury holdings, the trend of delevering is also evident. Debt directly used to purchase or supplement digital asset holding strategies decreased to approximately $16.1 billion , primarily after Strategy completed its $1.5 billion convertible bond repurchase program in May 2026. Additionally, Bitcoin reserve firm Strategy actually used approximately $1.38 billion in cash to repurchase $1.5 billion worth of bonds, reducing its outstanding convertible bonds from $8.2 billion to $6.7 billion. Therefore, it shows that the delevering process is not only present in the lending market but is also spreading to the capital structure of businesses owning digital assets .
In the futures market, corrections also occurred, but with significantly less intensity than in lending. The sharper decline in ETH OI suggests that the reduction in leveraged positions was not uniform across the entire market. While Bitcoin maintained relatively stable OI, Ethereum experienced a larger contraction in open position size. If the market were experiencing a leverage crisis similar to 2022, the decline in OI would typically be accompanied by the continuous destruction of positions and limited ability to re-leverage. The recovery in OI after the late Q2 decline suggests that some positions were closed and re-established rather than being completely eliminated from the system. Therefore, current futures data does not yet indicate a serious decline in market risk tolerance.
The decline in lending for three consecutive quarters, coupled with a decrease in corporate treasury debt, suggests that market participants are proactively scaling back their use of borrowed capital and improving balance sheet quality. More importantly, the structure of the current delevering process remains fundamentally different from that of 2022. Back then, the decline in lending occurred at an extremely rapid and continuous pace, linked to the insolvency of credit institutions and forced deleveraging.
CeFi Crypto-Collateralized Lending - Leverage decreases, but credit structure remains stable.
From 2025 to the present, the crypto-collateralized lending market has continued to contract; however, CeFi data shows that this process does not have the characteristics of a credit crisis . As of June 30, 2026, the total outstanding CeFi debt tracked by HCCVenture reached $22.98 billion , a decrease of $2.45 billion, or 9.62% QoQ .


Much of the market decline stemmed from Tether shrinking its secured lending, while Galaxy, Coinbase, Ledn, Arch, Sygnum, and Milo all recorded growth in loan books.
Looking at the longer-term cycle, the current $22.98 billion is still far above the Q4/2023 credit bottom but has not yet returned to the maximum leverage level of Q1/2022 . The 37.16% gap from the historical peak indicates that the CeFi system has removed a significant portion of the leverage accumulated during the previous expansion phase; however, the market has not yet entered a state of credit exhaustion. Therefore, the market is currently neither in a state of maximum credit nor in a state of credit freeze; it is in the intermediate zone of a leverage restructuring cycle.
A particularly significant development is that CeFi has now surpassed DeFi in crypto-collateralized lending for the first time since Q3/2023 . CeFi reached $22.98 billion, while DeFi lending fell to $20.43 billion after losing $7.79 billion, or 27.61%, in Q2.
In fact, CeFi also fell 9.62% during the quarter.
The problem is that DeFi is shrinking significantly faster than CeFi . This is causing the focus of the crypto credit market to shift relatively from permissionless protocols to centralized credit institutions capable of tighter management of collateral, counterparties, and credit limits. If this trend continues, the market's lending structure will become increasingly dependent on institutions capable of managing credit risk off-chain.
Tether is a key variable determining structural change in 2026, holding over 58% of the CeFi lending market share. This volatility of Tether has the potential to significantly impact overall CeFi metrics with a concentrated adjustment at the largest lender , rather than evidence of a synchronized decline across the entire system. The data is more consistent with the view that the market is reallocating credit among lenders , while overall leverage demand is decreasing at a moderate rate.
Therefore, the current state should be defined by a single trend: CeFi lending is in the process of delevering but has not yet entered the credit stress phase . If outstanding loans continue to decline in the coming quarters at a similar rate to the current one, this will primarily be a process of normalizing leverage. Only when the decline begins to accelerate sharply across the board, especially if there is a simultaneous contraction of many large lenders instead of just Tether, will the risk shift from orderly deleveraging to systemic credit contraction .


Concentration remains high but is gradually dispersing in the CeFi lending market, considering that the total loan portfolio in the market is down $5.1 billion, but the credit recovery from the cyclical bottom has not been fully reversed. However, the most important point lies in the shift in market share structure among lenders , with the three largest lenders currently controlling 74.96% of the total market. Therefore, the market remains highly concentrated, but the trend in 2026 is a slight decrease in the dominance of the largest lenders and an increase in the share of their competitors .
Specifically, HCCVenture notes that Coinbase, Ledn, Arch, Sygnum, and Milo all increased their loan books in 2026 , despite a decline in overall CeFi lending, further reinforcing the confirmation that the overall market downturn was primarily driven by Tether's tightening of secured loans, rather than a uniform contraction trend across all lenders. Some lenders focused on BTC-collateralized lending, while others offered altcoin-backed loans or fiat-backed credit products instead of stablecoins. Simultaneously, the customer base differed significantly between institutional and retail lending, as well as between the regulatory markets in which each institution was permitted to operate.
In the event of market credit stress, we would expect a widespread loan book decline across multiple lenders simultaneously, and this is a key differentiator when considering the response to a forced deleveraging scenario. This is more consistent with credit reallocation and balance sheet adjustments , rather than a systemic decline in credit availability.


The CeFi loan market share chart by lender reveals a significant structural shift in the crypto credit market between 2018 and 2026. Institutions that previously held the majority of the loan balance have disappeared from the system, while a new group of lenders has emerged, with Tether now playing a central role and controlling 58.54% of the total CeFi loan book, including Genesis, Celsius, BlockFi, and Voyager.
The shift from the " too-big-to-fail " model to a new credit structure, although peaking in 2022 when CeFi lending reached $36.58 billion , was largely driven by lenders who subsequently went bankrupt or closed down. Therefore, the current recovery of CeFi lending is not a re-establishment of the old credit system .
The market has recovered approximately $16.18 billion from its Q4/2023 low, but this credit has been provided by a new lender structure.
At the same time, the disappearance of the failed lender group also reduced a type of risk that had played a central role in the 2022 crisis: counterparty risk and maturity mismatch in opaque lending models. However, the risk did not disappear but shifted to a different structure , where the degree of concentration on Tether became a more important factor to monitor.
Most importantly, the data does not show a re-establishment of the pre-2022 crisis credit model. While the scale has recovered, the lender structure has changed; leverage has returned, but not with the same institutions that provided leverage in the previous cycle. This is a key characteristic for assessing the sustainability of the current CeFi market.
Note on statistical methodology : A significant methodological limitation is that CeFi lending lacks the same level of data transparency as DeFi. In DeFi, the majority of loans can be traced directly on the blockchain, allowing for relatively clear identification of the size of outstanding debt across protocols and time periods.
The shift in credit leverage between CeFi and DeFi
At current values, despite the declining performance correlation between DeFi and CeFi lending activities, this is the first time the crypto credit market has seen CeFi loan balances surpass DeFi loan balances. The value of outstanding loans on DeFi platforms decreased by $7.79 billion, or 27.61% QoQ, to $20.43 billion . Combined with the $22.98 billion in CeFi loan balances, total crypto-collateralized borrows reached $43.41 billion , a decrease of $10.24 billion, or 19.08% QoQ .


The scale of this decline is noteworthy because the majority of the contraction comes from on-chain borrowing , rather than a uniform contraction across both CeFi and DeFi. DeFi fell 27.61% , while CeFi only declined 9.62% . The current deleveraging is more pronounced in the on-chain sector, shifting the balance between the market's two main sources of credit supply.
Thus, DeFi contributed approximately 76% of the total $10.24 billion decline in crypto-collateralized borrowing in Q2 . This is quantitative evidence showing that the main driver of deleveraging in the quarter lay in the on-chain market. The main reason is that DeFi contracted faster than CeFi , thereby shifting the market share balance between the two sectors. Therefore, the main trend remains market-wide delevering, but this process is uneven and currently more concentrated in the on-chain system.
A more significant methodological issue lies in the potential for overlap between CeFi lending and DeFi borrowing , a factor that could cause the total of $43.41 billion to exceed the actual scale of economic credit if the same source of funds is recorded in both classes.
For example, a CeFi lender could use idle BTC as collateral to borrow USDC on a DeFi protocol, then use that USDC to grant loans to clients off-chain. The on-chain loan would then appear in the DeFi data, while the credit granted to clients would appear in the CeFi loan book. Statistically, the same funding chain could be recorded twice at two different layers of the credit system.
Due to a lack of publicly available information on funding sources and the ability to determine the on-chain attribution of each CeFi transaction, completely eliminating this duplication is currently not feasible. Therefore, $43.41 billion should be considered the total observable size of CeFi and DeFi borrowing, and should not be directly interpreted as $43.41 billion in independent credit within the crypto economy.
The crypto market is continuing its delevering process in an orderly manner; DeFi is experiencing the strongest contraction, while CeFi is becoming a larger and relatively more resilient credit class. This shift reflects a restructuring of credit supply after the 2022–2023 cycle, and shows no signs of a 2022-style credit crisis.


Total outstanding CeFi and DeFi debt, excluding stablecoin CDPs, fell to $43.41 billion , down $10.24 billion, or 19.08% QoQ . This represents a significant contraction and a continuation of the delevering trend that has been underway for several quarters. However, the most significant change lies not in the overall size but in the reversal of the correlation between DeFi and CeFi.
A major problem with the methodology that "DeFi is under greater deleveraging pressure than CeFi" is that the difference between the two sectors is most evident in the rate of debt contraction; in other words, DeFi experiences nearly three times the percentage contraction of CeFi . This ambiguity suggests that CeFi doesn't need to grow; simply a faster decline in DeFi is enough to change the market structure.
This structure suggests that crypto credit flows are trending towards a relative shift from permissionless onchain lending to more selective and centrally managed CeFi credit models . However, this is a shift in proportion due to different deleveraging rates, not a one-to-one transfer of $7.79 billion from DeFi to CeFi.


On the other hand, if CDP stablecoins are included alongside CeFi and DeFi lending, the overall size of the crypto-collateralized borrowing market at the end of Q2/2026 reached approximately $56.16 billion , a decrease of $11.33 billion, equivalent to 16.78% QoQ . Three consecutive declines bring the total market size down by about 28.5% from the most recent cycle peak , and this development confirms that delevering is not only occurring in traditional lending platforms but has also spread to the credit layer created through CDP stablecoins.
Notably, the contraction process did not occur in a single sharp decline, but rather the outstanding debt decreased in stages, from approximately $78.69 billion with a decline of ~10% per period. Currently, the decrease in Q2/2026 is the largest in the last three quarters, but still significantly lower than the collapse of the 2022 cycle.
This structure is consistent with a phased deleveraging process , where the need to use collateral to create credit is gradually diminished rather than the system being broken by a single liquidity shock.
DeFi is currently the area under the strongest leverage reduction pressure . However, as CDP also decreases simultaneously, the scope of the contraction process widens, and the market is not only reducing direct lending on lending protocols but also decreasing the amount of stablecoins created through crypto collateral mechanisms.
The addition of CDP stablecoins significantly alters how the market's overall credit is assessed, with stablecoins created through CDPs, in essence, representing a debt secured by crypto collateral . When users lock up BTC, ETH, or other crypto assets to issue stablecoins, the system has created a form of leverage even if those stablecoins are subsequently used outside of traditional lending protocols.


Research and Analysis
Market Overview
CeFi Crypto-Collateralized Lending - Leverage decreases, but credit structure remains stable.
CeFi Lender Profiles
CeFi Lending market size by quarter-end
Share of outstanding CeFi loan book by individual lender
The shift in credit leverage between CeFi and DeFi
Crypto lending market size
CeFi/DeFi lending market size by quarter
CeFI/DeFi lending market size by quarter
Historical assets borrowed on lending applications
Historical outstanding DeFi borrows drawdown from all time highs
The crypto asset lending model is becoming more diversified.
Stablecoin borrow APR on lending applications
Weighted WBTC borrow rate
Weighted ETH and SETH borow rates
Net borow rate of ETH usings SETH as collateral
Corporate debt strategies
Known and accessible outstanding debt issued by treasury companies
Quarterly effective interest service costs by treasury company
Total outstanding debt by source
Assessment and conclusions from HCC Venture
On-chain credit volume has decreased by over 53% from its peak, with total open debt across lending protocols reaching $21.94 billion, down from $25.19 billion in 2025. This is a very large contraction in absolute terms, but still significantly lower than the over 80% decline seen during the 2022 bear market cycle. This is a key factor indicating that the demand for crypto as collateral for liquidity is in a contraction phase , rather than simply a shift between blockchains.
The blockchain-based loan structure shows that Ethereum continues to be central to the DeFi lending market. At its peak, Ethereum alone reached approximately $37.52 billion in open loans; compared to the current level, the amount of loans on Ethereum has decreased by about $19.58 billion from the network's historical peak. This decline in total loan balance doesn't stem primarily from a complete shift of activity to new blockchains, but largely reflects a genuine contraction of lending capital within the Ethereum ecosystem . Scaling layers and chains like Solana still maintain a significant portion of lending activity, but their scale is not yet sufficient to offset the credit withdrawn from Ethereum.
However, the current decline does not yet have the characteristics of a 2022-style credit crisis . Outstanding debt remains significantly higher than the lows of the previous cycle, while the decline is occurring in stages rather than collapsing to near zero. The slight increase in outstanding debt from $20.43 billion at the end of Q2 to $21.94 billion at the end of July also suggests the market is beginning to find a new equilibrium, although there is not yet enough evidence to establish a new credit expansion cycle.


DeFi lending drawdowns have more than halved from their peak but haven't reached the extreme levels of 2022; however, recent data suggests the rate of decline has begun to slow . Drawdowns approached -58% between May and June 2026 before stabilizing around -56% by the end of July. This improvement of about 2 percentage points isn't enough to confirm a reversal of the credit cycle, but it indicates that the rate of leverage withdrawal is showing signs of reaching a temporary equilibrium after a period of strong contraction.
If we consider the current data within the entire history since 2021, the drawdown of approximately -56% is one of the most severe declines in DeFi lending. During 2021, outstanding loans decreased by about 39% from their peak before recovering. Compared to the historical low of around -82.5% , the current drawdown is still about 26-27 percentage points lower . In other words, DeFi lending has now lost more than half its size from its peak, but has not yet entered the extreme credit destruction zone seen in previous bear markets.
The improvement from the drawdown of around -58% to nearly -56% in July is the first sign of stability after a prolonged decline. However, cyclically, it is necessary to distinguish between the deceleration of deleveraging and the reversal of credit .
A sustained reversal would need to be confirmed by continued borrowing growth over several months, coupled with a sustained narrowing of drawdown away from the -50% range. Current data only shows a slight abatement of drawdown , while borrowing remains more than half of its all-time high (ATH). Therefore, the most appropriate description of the current market is that deleveraging is slowing down , rather than credit expansion having begun. If drawdown continues to narrow in the coming months along with an increase in outstanding borrows, that would be stronger evidence that the deleveraging cycle has largely completed its correction.
The crypto asset lending model is becoming more diversified.
The cost of borrowing stablecoins continued its upward trend in Q2/2026, with the weighted average borrowing rate increasing by 27 basis points from March 31st to June 30th, based on the 7-day moving average. Notably, the upward trend did not stop after the quarter ended, with interest rates further inching up to 3.88% at the end of July. This development indicates that the demand for leverage using stablecoins remains relatively strong, while the cost of capital in lending and CDP markets is gradually becoming more expensive.


However, current interest rates remain significantly lower than previous periods of stress, implying that the financial pressure on borrowers is not yet high enough to trigger a strong wave of deleveraging. The increase in lending rates amidst a continued contraction of overall DeFi debt also suggests that the current adjustment is not simply due to declining capital demand, but also reflects a revaluation of liquidity and credit costs within the ecosystem.


Unlike stablecoins, the cost of borrowing WBTC on lending protocols remains low and relatively stable , reflecting the fact that WBTC is primarily used as collateral rather than a source of high-demand borrowed capital. In Q2/2026, the weighted-average borrow APR of WBTC only fluctuated between 0.44% and 0.50% , indicating that the demand for on-chain BTC borrowing remains relatively balanced and less volatile compared to stablecoins.
A notable point is that the stability of the BTC borrowing rate reflects the distinctly different demand structures between the two asset classes . Stablecoins are typically borrowed for trading, leverage, liquidity provision, and arbitrage activities, so interest rates can surge when demand for capital spikes. Conversely, WBTC is largely used in lending markets as collateral to borrow stablecoins or other assets , resulting in lower demand for WBTC and a slower loan turnover.
From a credit perspective, a borrow APR of only around 0.5% indicates that the cost of raising BTC on-chain is currently not a barrier to maintaining leverage with BTC . However, this also means that the volatility of the WBTC borrowing rate has more limited informational value than the stablecoin borrowing rate in assessing liquidity stress. For the current cycle, stablecoin borrowing cost remains a more important indicator for evaluating demand for leverage and the credit conditions of the crypto market .


The Ethereum lending market continues to show a clear divergence between the demand for borrowing ETH and stETH . ETH's Borrow APR remained significantly higher than stETH for most of the observation period, reflecting a greater demand for using ETH directly as a borrowed asset. This is primarily driven by leveraged staking/looping strategies , where users use stETH as collateral to borrow ETH, then reinvest it to amplify the exposure to Ethereum's staking yield.
The key point is that the ETH borrowing rate doesn't simply reflect the demand for borrowing ETH , but also directly reflects the economics of leveraged staking. When staking yield is the underlying source of income, borrowers only have an incentive to maintain the loop if the staking APY is higher than the cost of borrowing ETH , after accounting for liquidation risk, slippage, and transaction costs. Therefore, under normal market conditions, the ETH borrow APR tends to fluctuate within a range of around 50 bps around Ethereum's staking yield . If the borrow APR exceeds the staking yield for an extended period, the profitability of the looping strategy is eliminated, and the demand for borrowing will automatically decrease.
Therefore, the ETH borrowing rate should be monitored alongside the Ethereum staking yield rather than considered independently. The spread between these two key variables is a more important metric for assessing the profitability of leveraged staking and the level of leverage used within the Ethereum ecosystem. Given the current strong contraction in DeFi lending, the fact that ETH borrow APR remains relatively low compared to previous periods of stress suggests that the cost of ETH funding hasn't created a credit shock , but the need for increased leverage still needs to be confirmed through a recovery in outstanding borrows.


The use of liquidity staking tokens (LST) and liquidity re-staking tokens (LRT) as collateral continues to support one of the most structurally important leverage strategies in DeFi: the ETH exposure loop. Because these assets generate returns from staking or re-staking while still being usable as collateral, borrowers can obtain ETH at a relatively low, and sometimes negative, net financing cost. The spread between the ETH borrowing interest rate and the underlying staking return creates an economic incentive to continuously borrow ETH, stake the proceeds, and redeploy the acquired LST or LRT as collateral.
Historically, this strategy has remained viable for most of the observed period. The net borrowing interest rate of ETH against the staked collateral has generally remained below zero , indicating that staking returns have more than offset the financing costs. This allows borrowers to effectively amplify their exposure to Ethereum staking returns through recursive leverage, while lending protocols benefit from sustained ETH borrowing demand.
However, this strategy is inherently dependent on maintaining a positive yield spread. When the cost of borrowing ETH rises above the staking yield, the interest rate spread becomes negative, and the economic efficiency of using leverage quickly deteriorates. Historical data shows that such fluctuations have occurred periodically, with spikes, but often short-lived, in net borrowing ratios. These events highlight the strategy's primary risk: low-cost leverage is clearly not a structural factor, but rather depends on stable funding conditions and sufficient demand for ETH relative to existing liquidity.
Corporate debt strategies
The debt-financed ecosystem supporting digital asset treasury management firms continues to expand structurally, although the most recent quarter marked a notable reversal. Total debt used directly to finance or supplement digital asset treasury management strategies reached $16.1 billion at the end of Q2 2026, down approximately $1.5 billion from the previous quarter. This decline was primarily due to Strategy completing a $1.5 billion debt buyback in May, rather than a broad-based contraction in leverage across the industry.


From a market structure perspective, the decline in Q2 should therefore be understood primarily as balance sheet optimization rather than a fundamental withdrawal from the corporate leverage model. Strategy's debt buyback reduces outstanding debt and potentially lowers financing costs, but this does not necessarily imply a reduction in the company's exposure to its underlying digital assets. Conversely, the existence of debt-financed treasury management strategies among multiple issuers suggests that corporate leverage remains a significant source of demand for digital assets.
A key methodological caveat is Strategy's handling of preferred securities, particularly STRCs, where Bloomberg's securities-level tracking creates a timing bias in the quarterly data series. Consequently, the precise timing of each capital raise may not perfectly reflect when the capital was actually raised. However, the total outstanding debt remains a reasonable representation of the liabilities supporting these fund management strategies.


The quarterly interest expense burden associated with debt issued by digital asset management (DAT) firms is highly concentrated among a handful of issuers. As of June 30, 2026, Strategy incurred the largest estimated quarterly financing costs, approximately $174.46 million, far exceeding Core Scientific's $90.68 million and VFH Parent LLC's $82.07 million. Mercadolibre ranked second with $26.14 million, while the remaining issuers, Semler Scientific, Goodfood Market, and DeFi Development Corp., had relatively negligible quarterly interest expenses of $1.06 million, $431,000, and $262,000, respectively.
This focus is crucial when assessing the sustainability of a company's digital asset management strategies. Strategy alone accounts for a significant portion of the total financial burden, meaning that changes in the company's debt structure, refinancing costs, or capital allocation decisions could significantly impact the overall economic performance of the DAT sector. The quarterly expense of $174.46 million also highlights the scale of the recurring financial hurdles that need to be overcome through Bitcoin price appreciation, operating cash flow, or other treasury-related returns.
Another point to consider is Strategy's handling of its STRC preferred securities. Unlike conventional fixed-interest debt, STRC dividends are only paid when declared by the board of directors from legal capital sources. While unpaid dividends accumulate and are preferred over distribution to subordinate securities, the actual timing of payments may be irregular rather than following a fixed quarterly schedule. Therefore, the estimated quarterly service fee should be understood as a financial obligation rather than an accurate measure of cash interest paid during the quarter.


Total outstanding cryptocurrency-related debt, including CeFi loans, DeFi lending app loans, stablecoin CDP debt, and debt issued by digital asset treasury (DAT) companies, continued to decline in Q2 2026. Total outstanding debt decreased by 15.08% quarter-on-quarter to $73.2 billion, marking the third consecutive quarter of decline since the market peaked in Q3 2025.
This decline represents a significant reversal from the rapid expansion observed throughout 2024 and the first three quarters of 2025. At its peak in Q3 2025, total cryptocurrency-related debt reached approximately $95.8 billion, meaning the market has declined by about $22.6 billion, or 23.6%, from its all-time high. Importantly, this debt reduction has occurred across both on-chain and off-chain credit channels, not just limited to a single segment.
The components of this decline are particularly noteworthy. DeFi lending activity experienced the sharpest decline, with on-chain loan balances significantly down from their September 2025 peak, while CeFi lending also declined but at a slower pace. Meanwhile, the inclusion of DAT-issued debt indicates that corporate financial leverage has become a significant component of the broader cryptocurrency credit market. While DAT debt remains at historically high levels, the $1.5 billion reduction in Q2 suggests that borrowing businesses are also beginning to optimize or reduce their leverage.
Assessment and conclusions from HCC Venture
In our assessment, 2026 provides further evidence that the cryptocurrency market is still in a phase of delevering and balance sheet normalization across the board, following the sharp adjustment in derivative leverage in October 2025. This contraction has now spread across multiple layers of the credit ecosystem: outstanding DeFi loans, CeFi lending, stablecoin-backed loans, and debt issued by digital asset treasury companies have all declined from their respective cyclical peaks. Total cryptocurrency-related debt fell to $73.2 billion in Q2, down 15.08% from the previous quarter and marking the third consecutive quarter of decline, while DeFi lending has fallen more than 50% from its September 2025 peak. This extent of contraction suggests that the delevering is structural rather than the result of a single delevering event.
However, it is important to note that the current cycle differs significantly from the chaotic de-escalation observed in 2022. The current credit slowdown is gradual and relatively orderly, with borrowers reducing their risk levels over several quarters rather than through a single wave of forced liquidations. CeFi lending has now surpassed DeFi in terms of cryptocurrency-backed collateralized loan balances, while DeFi's market share has fallen below 50%. Simultaneously, corporate treasury debt has also begun to decline, although it remains significantly high compared to historical levels. Overall, these developments suggest a market where leverage is being reduced through balance sheet adjustments and a decrease in speculative financing demand, rather than through widespread insolvency or forced asset sales.
The evolution of borrowing costs provides further guidance. Stablecoin borrowing rates have begun to rise slightly, suggesting that liquidity conditions haven't become uniformly loose despite overall leverage reductions. Conversely, WBTC borrowing costs remain extremely low, while ETH borrowing with stETH/LST collateral remains close to staking yields. This indicates that leverage hasn't disappeared from the system; instead, it's becoming more selective and increasingly dependent on the underlying economics of each strategy. As long as borrowing costs remain lower than the yields generated from collateral, strategies like ETH staking loops can continue to work. However, a sustained reversal of this relationship would create stronger momentum for further debt reduction.
Nevertheless, it's too early to assume a bottom has been reached. Total debt remains significantly lower than its Q3 2025 peak, and borrowing activity has yet to show a clear acceleration. Key indicators to watch in the coming quarters are the stability of DeFi and CeFi lending portfolios, the direction of stablecoin borrowing demand, open interest in futures contracts, the spread between ETH staking and borrowing, and the development of DAT corporate leverage. Simultaneous stability across these indicators would provide stronger evidence that the market has completed its balance sheet reset.
The cryptocurrency credit market is currently shifting from aggressive leverage expansion to balance sheet normalization. While the contraction remains a hindrance to short-term liquidity and speculative demand, its orderly nature is ultimately constructive for market stability. Unlike the abrupt debt reduction of 2022, the current cycle has so far avoided a wave of widespread liquidations and counterparty bankruptcies. If the credit market continues to stabilize from its current level, the reduction in financial leverage could make the system significantly more resilient to future volatility.
In our view, the market is therefore closer to a consolidation phase than a systemic credit event. The downturn is not over yet, but is becoming increasingly better controlled. If borrowing activity in DeFi, open interest in futures contracts, and corporate financial leverage establish sustainable floors, the next phase of the cycle could begin with a significantly healthier balance sheet with lower leverage, lower systemic vulnerability, and a greater capacity to absorb a return to larger cryptocurrency credit expansions.
Disclaimer
This report was prepared by HCCVenture Research with the aim of providing information, research, and market analysis. The entire content of the report is based on publicly available data, on-chain data, market data, venture capital (Venture Capital) data, macroeconomic data, and HCCVenture's internal research methodologies at the time of publication. Data sources are compiled from numerous reputable research platforms and organizations, including but not limited to Glassnode, CoinGecko, TradingView, Dune Analytics, CoinGlass, CryptoRank, RootData, PitchBook, DefiLlama, CryptoQuant, Messari, Token Terminal, Artemis, CoinMarketCap , public blockchain data, reports from financial institutions, investment funds, blockchain companies, and other publicly available information sources. HCCVenture strives to select reliable data sources and applies a verification and cross-checking process throughout its research. However, HCCVenture does not guarantee the completeness, accuracy, timeliness, or error-free nature of all data due to differences in statistical methods, data collection scope, update times, or adjustments from data providers.
All opinions, assessments, valuation models, cyclical analysis, on-chain data, capital flow analysis, Venture Capital activity, ETFs, Digital Asset Treasury Companies (DATs), technical indicators, macroeconomic indicators, and scenarios presented in this report reflect only the research views of HCCVenture Research at the time of publication, based on available assumptions and data. These contents are not investment advice, financial advice, legal advice, accounting advice, tax advice, brokerage advice, portfolio management advice, or recommendations to buy, sell, or hold any digital asset, security, financial product, investment fund, blockchain protocol, or business. The digital asset and blockchain markets are highly volatile and are influenced by global liquidity, monetary policy, regulatory regulations, macroeconomic conditions, and many other unpredictable factors. Therefore, the trends, patterns, correlations, or historical cycles mentioned in this report are not guaranteed to repeat in the future and should not be considered reliable predictions of market developments. Readers should conduct their own independent research ( DYOR – Do Your Own Research ) and consult with qualified financial, legal, tax, or investment professionals before making any decisions. Any investment decisions or actions arising from the use of information in this report are the sole responsibility of the reader.
HCCVenture, its affiliates, research team, personnel, or related parties may own or will own digital assets, invest in blockchain projects, investment funds, technology companies, or maintain commercial, research, media, consulting, or collaborative relationships with the organizations, protocols, businesses, or platforms mentioned in this report. These relationships may create actual or potential conflicts of interest, although HCCVenture always applies internal research standards to maintain objectivity and independence in its analysis. Nothing in this report is construed as an offering, brokerage, promotion, fundraising, or provision of investment services as regulated by any country or territory. The entire content of this report is protected under intellectual property and copyright law. It is strictly prohibited to copy, modify, reproduce, distribute, or use all or part of this report for commercial purposes in any form without the written consent of HCCVenture. Accessing, using, or quoting this report signifies that the reader has understood, accepted, and agreed to the entire content of this disclaimer.
Explore HCCVenture group
HCCVENTURE QUANT JSCO
© 2026 HCCVENTURE. ALL COPYRIGHTS RESERVED.


Connect with us
Popular content
Contact to us
Address: 8th Floor, Bach Dang Complex Building, 50 Bach Dang Street, Hai Chau Ward, Da Nang City, Vietnam.
Phone: 1900 1509
Gmail : sp_contact@hccventure.com
Disclaimer: The information on this website is for informational purposes only and should not be considered investment advice. We are not responsible for any risks or losses arising from investment decisions based on the content here.
TERMS AND CONDITIONS • CUSTOMER PROTECTION POLICY
ANALYTICAL AND NEWS CONTENT IS COMPILED AND PROVIDED BY EXPERTS IN THE FIELD OF DIGITAL FINANCE AND BLOCKCHAIN BELONGING TO HCCVENTURE ORGANIZATION, INCLUDING OWNERSHIP OF THE CONTENT.
RESPONSIBLE FOR MANAGING ALL CONTENT AND ANALYSIS: HCCVENTURE FOUNDER - TRUONG MINH HUY
Read warnings about scams and phishing emails — REPORT A PROBLEM WITH OUR SITE.