

On-chain Status: From Stablecoins to the Entire DEFI and RWA Ecosystem
On-chain yield is not a new source of profit separate from the traditional financial system; it is the process of tokenizing, programming, and restructuring existing economic income sources on the blockchain.
INSIGHTS
10/7/202618 min read


On-chain Status: From Stablecoins to the Entire DEFI and RWA Ecosystem
On-chain yield is not a new source of profit separate from the traditional financial system; it is the process of tokenizing, programming, and restructuring existing economic income sources on the blockchain.
Research • October 7, 2026


A platform for on-chain yield systems
On-chain yield has shifted from a profit-generating mechanism primarily based on incentives and liquidity mining to a more complex financial system, where yields are increasingly derived from credit interest rates, protocol fees, staking, tokenized government bond assets, and real financial cash flows. A high yield only makes economic sense when the source of the cash flow, the stability of the revenue stream, and the level of risk required to sustain that yield are clearly defined.
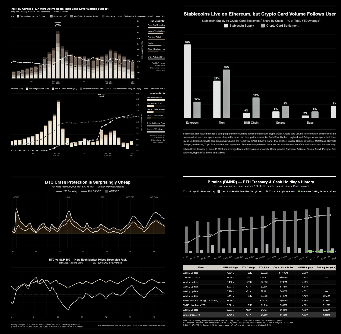
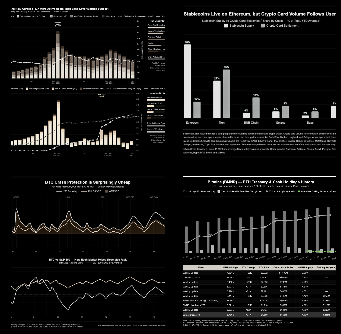
Current data shows that the market's underlying size has grown significantly since the 2022-2023 downturn, with the total locked-in DeFi capital now around $96.7 billion, while stablecoin market capitalization has reached approximately $307 billion. Compared to the DeFi bottom of around $37.7 billion in September 2023, the current TVL has increased by about 156%. More importantly, the stablecoin supply has far surpassed the previous peak of the 2021 cycle and remains above $300 billion, indicating that on-chain liquidity is no longer solely driven by token speculation but is being supported by a growing class of payment and yield-generating assets.
This shift creates a new yield structure, with non-yielding assets at the lowest tier, followed by stablecoins staked in yield-transfer products, then staking and lending, higher up to liquid staking, restaking, structured yields, and finally market-dependent strategies such as AMMs, liquidity provision, and incentive farming. The key takeaway from the current cycle is that yields derived from real-world sources are playing a larger role, while APY levels solely dependent on token incentives are becoming increasingly difficult to sustain at scale.
Stablecoins are currently the most important asset class for assessing the health of on-chain yield. When stablecoins are simply held in wallets, they do not generate native yield. However, when introduced into lending markets, stablecoin vaults, tokenized treasuries, or structured products, they become a source of capital that can generate cash flow. An increase in stablecoin supply does not necessarily mean that all of this capital is generating yield; this is a key distinction in on-chain analysis. Stablecoins can be held in personal wallets, on CEXs, in payment rails, or awaiting deployment. Therefore, only the portion of stablecoins introduced into protocols that generate cash flow truly constitutes productive on-chain capital. The difference between the total stablecoin supply and the stablecoins deployed in DeFi is thus becoming an increasingly important indicator for evaluating the growth quality of the ecosystem.
Lending is the next crucial stage because the yield here is directly derived from the borrower's cost of capital. Unlike liquidity mining, the supply APY in the lending market primarily depends on the utilization rate, borrowing demand, and the liquidity structure of each market. When the supply of capital increases faster than borrowing demand, utilization decreases and the supply APY is compressed. Conversely, when borrowing demand increases sharply, interest rates can rise rapidly; therefore, a high APY in the lending market only reflects the price of liquidity at a specific point in time, not a guaranteed long-term return.
Liquid staking has addressed a key limitation of traditional staking: capital is no longer completely locked in validators. Users can receive liquid staking tokens and continue to use them in lending, liquidity pools, or structured products; however, when liquid staking tokens are repeatedly used to generate additional yields, the risk structure becomes more complex. An ETH staking yield of around 2–3% can be transformed into a higher APY strategy through lending, leverage, or restaking, but the additional yield is not “free yield” - it compensates for smart-contract risk, liquidation risk, validator risk, liquidity risk, or additional protocol dependency.
A significant advancement in DeFi is the emergence of products capable of separating a cash flow into different components. Pendle is a prime example: users can separate the principal and yield, thereby trading or fixing yields over a specific period, transforming yield from a volatile number into a structured financial instrument with a fixed term. In current Pendle V2 markets, some stablecoin principal tokens have implied yields of around 5-9%, while the median yield of tracked pools is significantly lower. Systems like Pendle, Boros, and other new money-market primitives are moving closer to how traditional financial markets handle the yield curve: yield is not only viewed in absolute terms but also priced in terms of time, term, volatility, and interest rate expectations.
Stablecoins as a liquidity layer for the entire DeFi platform.
Stablecoins are a core liquidity layer connecting exchanges, wallets, lending markets, and DeFi protocols. However, it's important to distinguish between the ability to maintain a value of $1 and the ability to generate returns for holders. USDT, FDUSD, and USD1 belong to the group of stablecoins that do not pay native interest to holders; therefore, an exchange or intermediary platform advertising APR on these assets does not change the economic nature of the token. That profit comes from the platform's own program, lending, or incentive, rather than from the stablecoin's income distribution mechanism.


Particularly important in 2026, the total stablecoin market capitalization has increased to approximately $306.4 billion, with USDT accounting for about 60.1% of the market. This size is significantly higher than the market downturn after 2022 and shows that stablecoins have become a systemic liquidity layer for the digital asset market. Compared to the bottom of the DeFi cycle in 2022-2023, the recovery of stablecoin supply reflects the renewed expansion of on-chain capital, but much of this capital still does not automatically generate yield for holders.
USDT continues to hold a central position in the system due to its scale, liquidity, and integration across CEXs and blockchains. With a current market capitalization of approximately $184 billion, USDT is significantly larger than most other stablecoins. This model prioritizes liquidity and usability over the distribution of yields and profits generated from the issuer's reserve assets, which are not directly converted into APY for USDT holders.
This difference becomes clearer when comparing non-yielding stablecoins to yield-bearing stablecoins. CoinGecko estimates the yield-bearing stablecoin market at approximately $2.8 billion, while the total stablecoin supply exceeds $300 billion. This means that the portion of stablecoin capital that is actually tokenized or structured to directly deliver yields to holders still represents only a small percentage of the entire market. In other words, the majority of stablecoins currently serve payment and liquidity functions, rather than maximizing capital gains.
The shift to profitable stablecoins
sDAI is located in the lower left corner with an APY of approximately 2% and the lowest APY volatility. This structure is close to a traditional savings rate product: low yield but relatively stable. Meanwhile, sUSDS achieves approximately 4.5% APY with low volatility, resulting in a return/volatility ratio of approximately 4.1 times, the highest among the four assets shown on the chart. Statistics show that the more yield is increased by additional strategic layers, the higher the yield volatility. sDAI represents the low-yield and stable tier; sUSDS is in the best risk-adjusted efficiency zone; while sUSDe and market-neutral stablecoins are in the higher yield zone but are more dependent on market conditions.


However, updated data up to October 2026 shows a significant need for adjustment to the old chart interpretation. The 7–12% yield range of market-neutral products on the chart is no longer the prevailing state. sUSDe is currently at around 4.95%, and sUSDS at around 3.60%. The yield gap between the two groups has therefore narrowed considerably, while sUSDS maintains its large size and low volatility. More importantly, products like USDY, syrupUSDC, and tokenized Treasury products have emerged alongside sUSDS and sUSDe. This indicates the market is expanding from a “DeFi token generating yield” to a broader structure where Treasury yield, private credit, protocol surplus, and market-neutral strategies compete to become the underlying source of income.
In its current state, sUSDS stands out for its risk-adjusted yield and capital size, while sUSDe excels in its ability to generate higher yields but is more dependent on market conditions. The overall market trend is shifting from a “maximum APY” model to a “sustainable yield” model, where stablecoins with real income streams from Treasury, lending, protocol surplus, and market-neutral strategies are increasingly becoming the central asset class of the DeFi ecosystem.


From the yield peaks of 2024-2025 to the normalization phase in 2026, Ethena's sUSDe was the product with the highest daily yield, reaching nearly $2.9 million/day by the end of 2024, while Sky's sUSDS reached approximately $1 million/day by early 2025. After these peaks, daily earnings declined significantly as funding rates and favorable market conditions weakened.
The most significant phase on the chart began after Ethena launched USDe in early 2024. The sUSDe line rose rapidly from near zero to above $500,000 in daily income, then continuously fluctuated in the $500,000–$900,000 daily range for most of 2024. By the end of the year, as funding rates in the perpetual futures market surged, the daily yield of sUSDe increased exponentially, peaking at nearly $2.9 million per day.
Data from 2026 shows that Ethena's revenue stream is no longer solely dependent on perpetual funding; a significant amount of backing assets are deployed in lending markets and yield-bearing assets, while basis positions continue to play a supplementary role. Compared to the peaks on the chart, this represents a decline of approximately 55% and over 90%, respectively. However, this is not a sign of a full-blown market contraction. On the contrary, capital continues to be maintained at a large scale in yield-bearing products, while yield per dollar of capital has declined to a more sustainable level.
The most important point is that the quality of the yield source is becoming the determining factor instead of the absolute APY. sUSDe once reached the highest daily income in the chart thanks to exceptionally favorable funding conditions, but this very mechanism caused income to fluctuate sharply. Meanwhile, sUSDS had a lower peak but maintained a more stable income structure thanks to Savings Rate funded from protocol surplus.


In 2024, Ethena's sUSDe surged to over 50% APY, peaking at around 55%, while Sky's sUSDS remained around 10-15%. By the end of 2024, sUSDe continued to fluctuate around 20-30% before sharply declining in 2025. Falcon Finance, after its launch, also recorded an APY above 40%. However, by October 2026, these levels no longer represented the market state: sUSDe is currently around 4.95%, sUSDS 3.60%, while Falcon's sUSDf is only in the range of a few percent.
If yields decrease but capital also decreases sharply, it may reflect a loss of product attractiveness. Conversely, in the case of sUSDS, a decrease in yield while capital remains maintained and expands suggests that investors are accepting lower yields in exchange for greater stability and predictability of cash flow. The APY of sUSDS should therefore not be simply judged as “low.” In the context of normalized on-chain interest rates, a 3.60% yield on a multi-billion dollar product has a completely different meaning than an APY of 20–50% depending on funding or incentive conditions.
In the early stages, a significant portion of yields were driven by funding premiums, incentives, and unusual liquidity conditions. In the current state, yields are more closely aligned with the true economic values of Treasury exposure, protocol surplus, lending demand, and market-neutral strategies. Therefore, the main trend for the index in 2026 is not a continued increase in yields, but rather a repricing towards more sustainable levels. Products capable of maintaining stable APY across large capital scales will have a distinct advantage over protocols that can only generate high APY during favorable market conditions.


Staking is often presented as a passive income stream with a fixed APR, but this approach doesn't fully reflect the economic efficiency of the asset. Staking rewards on many Proof-of-Stake blockchains are paid out in part or in part with newly issued tokens. Therefore, an investor might receive 10% of tokens annually, but if the network-wide supply simultaneously increases by 8–10%, the increase in the investor's actual economic ownership percentage is much lower than the headline APR.
Data updated to early October 2026 shows that this structure has changed significantly compared to the snapshot shown in the chart. While ATOM still stands out with its high staking reward, networks like Ethereum, Solana, Avalanche, and Polkadot have entered a zone of much lower issuance, as the current reward rate is lower than the supply growth rate used in the comparison, making the real yield using this method negative. This shows that a high APR is not a sufficient condition for staking to generate real economic value for holders.
When rewards are generated from newly issued tokens, a portion of the profit is merely compensation for dilution. When rewards come from transaction fees, MEV, or real economic activity, the quality of the cash flow is higher. Ethereum is a prime example of this trend: staking APR is only around 2.5%, but inflation is only about 0.86%, while a portion of the reward comes from execution-layer fees. Conversely, ATOM has a nominal APR of nearly 20%, but the majority of the yield is still based on issuance. This difference means that a 1-2% real yield from a blockchain with low dilution can have much higher economic quality than a 10-15% nominal APR from a high-inflation system.


The Platform-Dependent Yield-Bearing Stablecoins Market Cap shows a very clear trend: the market has shifted from contraction to structural expansion, but the yield source still depends on the distribution platform rather than the token itself. Current data shows that the yield-dependent stablecoin group has moved past the deep downturn of 2022–2023 and is in a state of significant expansion. USDC has increased from a low of approximately $23.5 billion to $74.1 billion, equivalent to an increase of over $50 billion and about 3.15 times from its low. This is the largest recovery in the entire data series of the chart.
More importantly, USDC has now surpassed its peak of $55 billion shown in the chart by approximately 35%. This confirms that the stablecoin market has not only recovered from the SVB shock but has also established a new liquidity scale. Circle also noted a significant increase in USDC circulation in 2025-2026 and on-chain transaction volume reaching tens of trillions of USD per quarter.
PYUSD is much smaller but has a more direct yield structure within the PayPal ecosystem. Its current market cap is around $2.87 billion, about 30% lower than its peak in early 2026 but still many times higher than in early 2025. PayPal paying 4% rewards for eligible PYUSD demonstrates that platform-dependent yields are becoming a tool for distributing stablecoins and retaining liquidity, rather than just a short-term promotional program.
Stablecoin profitability depends on the platform
Platform-dependent yield-generating stablecoins differ fundamentally from intrinsic yield-generating stablecoins or on-chain staking assets. USDC and PYUSD themselves do not automatically generate yields for holders; income only arises when the asset is held on a reward-distribution platform, such as Coinbase or PayPal, or is included in external DeFi protocols. Therefore, the size of this group reflects three factors simultaneously: the level of stablecoin adoption, the issuer's distribution capacity, and the extent to which yields are transferred from the reserve asset to the end user.
The most important point when evaluating this group of stablecoins is to distinguish between the yield on the reserve asset and the yield that token holders actually receive. For USDC, Circle maintains a mechanism of backing through cash, bank deposits, short-term US Treasury bonds, and overnight reverse repos. As of the end of September 2026, the circulating supply of USDC exceeded $75 billion, while the majority of reserves continued to be held in highly liquid cash and cash equivalents.


Research and Analysis
A platform for On-chain Yield systems
Stablecoin Market Capitalization
Stablecoin Supply & Exchange Reserves
DeFi TVL & Stablecoin Liquidity
Staking APR vs Real Yield
ETH Staking & Restaking
Lending Supply, Borrowing & Utilization
DEX Volume & Liquidity Provider Fees
Synthetic Dollar Market Capitalization
Funding Rate & Basis Yield
On-chain Yield Risk–Return Framework
Assessment and Conclusion
The biggest difference between USDC and PYUSD lies in the depth of their on-chain distribution infrastructure. USDC is currently natively supported by Circle on 38 blockchains, a significant expansion from around 30 blockchains at the beginning of 2026. Recent allocation data shows that Ethereum remains the largest hub, accounting for approximately 63% of the USDC supply, equivalent to over $46 billion; followed by Hyperliquid, Solana, Base, and Arbitrum. This indicates that USDC has moved beyond its role as a stablecoin primarily serving Ethereum to become a cross-chain liquidity layer.
In particular, the expansion into Solana, Base, Arbitrum, and Hyperliquid has significant implications for capital efficiency. Ethereum continues to hold the majority of the stablecoin supply due to its role as a storage and DeFi hub, while lower-cost networks are increasingly handling transaction and payment activities. On Solana, USDC currently accounts for approximately 44.7% of the network's total stablecoin market capitalization, with a supply of around $7.4 billion, demonstrating that USDC is maintaining its core liquidity position in high-speed transaction ecosystems.
Non-yielding stablecoins continue to play a fundamental role in the liquidity structure of the digital asset market. Unlike stablecoins with yield-sharing mechanisms, USDT, USD1, and FDUSD do not automatically pay income to holders; their economic value lies primarily in their ability to maintain a 1 USD exchange rate, liquidity, transferability, and integration with exchanges and blockchain networks. Therefore, circulating capitalization and supply allocation among blockchains are more important indicators than APY when evaluating this asset class.
Current data suggests that the Non-Yield-Bearing Stablecoin market is entering a phase of strong liquidity centralization. USDT is a key factor in this trend: its market capitalization has increased from approximately $166 billion in chart data to $184.1 billion currently, while the supply is primarily distributed across Tron and Ethereum. Tether's reserve size and profitability have also increased correspondingly, with over $184 billion in circulating tokens and approximately $1.5 billion in operating profit in Q2 2026. This confirms that USDT is operating on the scale of a global payment and liquidity infrastructure in the digital asset market, rather than merely being an intermediary asset for transactions.
At the second level, USD1 is emerging as the fastest-growing stablecoin in the group, with a current supply of approximately $4.42 billion, more than double the level on the chart and only about 18% below its peak of $5.37 billion. Notably, this growth is accompanied by a relatively balanced supply distribution across Ethereum, BNB Chain, and Solana, creating a broader multi-chain platform than in the early stages. Conversely, FDUSD is in a state of structural contraction, with its supply down more than 90% from its 2024 peak to only about $325 million currently.


The group of small-cap, non-yielding stablecoins is exhibiting a very clear restructuring process during the 2024–2026 period. The chart shows that the group's market capitalization was once almost entirely led by FDUSD, with supply peaking at approximately $4.45 billion in April 2024. However, FDUSD then entered a prolonged decline cycle, while USD1 emerged from 2025 and quickly replaced much of the market size lost by FDUSD. Therefore, the volatility of this group should not be interpreted simply as an expansion of small-cap stablecoins, but rather as a structural shift among issuers and the distribution ecosystem.
The most important point isn't that USD1 is rising faster than FDUSD, but that the same small-cap segment is completely changing its leading asset. FDUSD represents a growth model heavily reliant on trading incentives and integration with a specific exchange ecosystem; USD1, on the other hand, is emerging through its ability to rapidly expand supply, trading liquidity, and multi-ecosystem integration. Therefore, this event shows that the competitive advantage of stablecoins increasingly depends on liquidity depth and distribution networks rather than simply maintaining a 1 USD exchange rate.


The decentralized stablecoin and synthetic dollar models are undergoing the most profound restructuring in the entire stablecoin segment. While the 2022–2023 period was largely driven by DAI, from 2024 onwards, the market began shifting towards new on-chain USD generation models such as Ethena's USDe, Sky's USDS, and Falcon Finance's USDf. The chart shows the group's total market capitalization increasing from approximately $4.5–5 billion at the 2023–early 2024 lows to nearly $20 billion by mid-2025, reflecting a significant expansion of demand for stablecoin models that are not entirely dependent on traditional fiat assets.
The real turning point came when Ethena launched USDe in 2024. USDe doesn't operate on the traditional collateralized stablecoin model of DAI, but instead uses a delta-neutral strategy, combining collateral with derivative positions to create a synthetic dollar. This significantly expands the stablecoin design space: instead of just creating a token that tracks the USD, the protocol can simultaneously turn crypto liquidity and derivative markets into revenue sources.
Current data suggests that decentralized stablecoins have entered a structurally mature phase, although the total market capitalization has not yet sustainably surpassed the chart's peak of approximately $20 billion. Compared to the 2023 bottom of $4.5-5 billion, the current size has expanded to over $16 billion if the DAI-USDS count is adjusted. More importantly, this expansion is no longer dependent on a single asset like DAI but is distributed among different dollar-making models.
Our assessment and conclusions
Through the entire analysis, it can be concluded that on-chain yield has shifted from a market focused on maximizing returns to a multi-tiered financial system where each yield level is derived from a specific economic income source. From non-yielding stablecoins, platform-dependent stablecoins, savings stablecoins, staking, lending, restaking, AMMs to synthetic dollar and structured yield structures, on-chain yield essentially boils down to a few fundamental drivers: policy interest rates passed into tokenized assets, protocol issuance rewards, credit spreads and basis, transaction fees, or income restructured through leverage and derivatives. The market's development, therefore, does not change the economic nature of yield, but primarily alters how returns are packaged, distributed, and transferred to asset holders.
Another important conclusion is that actual yields should be evaluated based on performance rather than APY at a given time. For yield-generating stablecoins, nominal APY can fluctuate with market interest rates and platform policies; for staking, rewards must adjust for inflation or supply dilution rates; for lending and AMMs, income depends on borrowing demand, trading volume, and market conditions; and for synthetic dollars and structured yields, yields can simultaneously be affected by funding rate, basis, collateral volatility, and leverage structure. Therefore, rolling realized yield, cash flow stability, and the yield rate remaining after removing incentives are more valuable for analysis than a advertised APY at a given time.
At the risk level, research shows that liquidity and the ability to exit positions must be considered on par with yield. A product may generate attractive returns under normal conditions but can still suffer significant losses during market stress if it relies simultaneously on a bridge, oracle, L2, money market, staking protocol, or an external liquidity source. When multiple products utilize the same infrastructure layer, risk is no longer independent but can become correlated risk, meaning a failure at the bridge, oracle, lending protocol, or underlying blockchain simultaneously affects multiple positions.
On-chain yield is not a new source of profit separate from the traditional financial system; it is the process of tokenizing, programming, and restructuring existing economic income streams on the blockchain. Policy interest rates are transformed into yields on tokenized cash assets; network rewards become staking yields; credit spreads create lending yields; transaction fees become AMM yields; and structured products package or amplify these cash flows into new profit profiles.
Disclaimer
This report was prepared by HCCVenture Research with the aim of providing information, research, and market analysis. The entire content of the report is based on publicly available data, on-chain data, market data, venture capital (Venture Capital) data, macroeconomic data, and HCCVenture's internal research methodologies at the time of publication. Data sources are compiled from numerous reputable research platforms and organizations, including but not limited to Glassnode, CoinGecko, TradingView, Dune Analytics, CoinGlass, CryptoRank, RootData, PitchBook, DefiLlama, CryptoQuant, Messari, Token Terminal, Artemis, CoinMarketCap , public blockchain data, reports from financial institutions, investment funds, blockchain companies, and other publicly available information sources. HCCVenture strives to select reliable data sources and applies a verification and cross-checking process throughout its research. However, HCCVenture does not guarantee the completeness, accuracy, timeliness, or error-free nature of all data due to differences in statistical methods, data collection scope, update times, or adjustments from data providers.
All opinions, assessments, valuation models, cyclical analysis, on-chain data, capital flow analysis, Venture Capital activity, ETFs, Digital Asset Treasury Companies (DATs), technical indicators, macroeconomic indicators, and scenarios presented in this report reflect only the research views of HCCVenture Research at the time of publication, based on available assumptions and data. These contents are not investment advice, financial advice, legal advice, accounting advice, tax advice, brokerage advice, portfolio management advice, or recommendations to buy, sell, or hold any digital asset, security, financial product, investment fund, blockchain protocol, or business. The digital asset and blockchain markets are highly volatile and are influenced by global liquidity, monetary policy, regulatory regulations, macroeconomic conditions, and many other unpredictable factors. Therefore, the trends, patterns, correlations, or historical cycles mentioned in this report are not guaranteed to repeat in the future and should not be considered reliable predictions of market developments. Readers should conduct their own independent research ( DYOR – Do Your Own Research ) and consult with qualified financial, legal, tax, or investment professionals before making any decisions. Any investment decisions or actions arising from the use of information in this report are the sole responsibility of the reader.
HCCVenture, its affiliates, research team, personnel, or related parties may own or will own digital assets, invest in blockchain projects, investment funds, technology companies, or maintain commercial, research, media, consulting, or collaborative relationships with the organizations, protocols, businesses, or platforms mentioned in this report. These relationships may create actual or potential conflicts of interest, although HCCVenture always applies internal research standards to maintain objectivity and independence in its analysis. Nothing in this report is construed as an offering, brokerage, promotion, fundraising, or provision of investment services as regulated by any country or territory. The entire content of this report is protected under intellectual property and copyright law. It is strictly prohibited to copy, modify, reproduce, distribute, or use all or part of this report for commercial purposes in any form without the written consent of HCCVenture. Accessing, using, or quoting this report signifies that the reader has understood, accepted, and agreed to the entire content of this disclaimer.
Explore HCCVenture group
HCCVENTURE QUANT JSCO
© 2026 HCCVENTURE. ALL COPYRIGHTS RESERVED.


Connect with us
Popular content
Contact to us
Address: 8th Floor, Bach Dang Complex Building, 50 Bach Dang Street, Hai Chau Ward, Da Nang City, Vietnam.
Phone: 1900 1509
Gmail : sp_contact@hccventure.com
Disclaimer: The information on this website is for informational purposes only and should not be considered investment advice. We are not responsible for any risks or losses arising from investment decisions based on the content here.
TERMS AND CONDITIONS • CUSTOMER PROTECTION POLICY
ANALYTICAL AND NEWS CONTENT IS COMPILED AND PROVIDED BY EXPERTS IN THE FIELD OF DIGITAL FINANCE AND BLOCKCHAIN BELONGING TO HCCVENTURE ORGANIZATION, INCLUDING OWNERSHIP OF THE CONTENT.
RESPONSIBLE FOR MANAGING ALL CONTENT AND ANALYSIS: HCCVENTURE FOUNDER - TRUONG MINH HUY
Read warnings about scams and phishing emails — REPORT A PROBLEM WITH OUR SITE.