


On-chain analysis week 9/2025: Bearish market, boring Bitcoin
Last week, Bitcoin had a strong correction of -11.55%, a correction that caused the entire market to fall into panic, and the STH sentiment was selling off a lot. Many experts believe that Bitcoin will move to the price of 72,000 USD, the previous ATH peak. However, ETFs are trying to buy Bitcoin despite the actual loss.
3/1/20258 min read
Summary
The Bybit hack became one of the most serious security incidents in crypto history, with 403,996 ETH (~$1.13 billion) stolen from cold wallets due to a vulnerability in a smart contract. The incident triggered a wave of mass withdrawals , with a total of ~$4.3 billion in capital leaving the exchange , including Bitcoin and stablecoins.
Market sentiment quickly deteriorated , triggering a broad sell-off across the entire market: Bitcoin (BTC) : -13.6% for the month, falling to lower support. This drop brought the market back to the April 2024 price zone.
BTC is back in the “air gap” in realized supply between $70K - $88K , where the low cost base density makes the price susceptible to high volatility.
History shows that when selling pressure peaks , a period of “ seller exhaustion ” may occur . However, if new money does not return to the market , the downtrend may continue, especially if BTC continues to lose the $92.5K mark and is pushed to lower support zones like $80K - $72K .
The big question is: Will the buying pressure be strong enough to stop the decline, or will the market enter a deeper correction phase?
Onchain Metrics Analysis
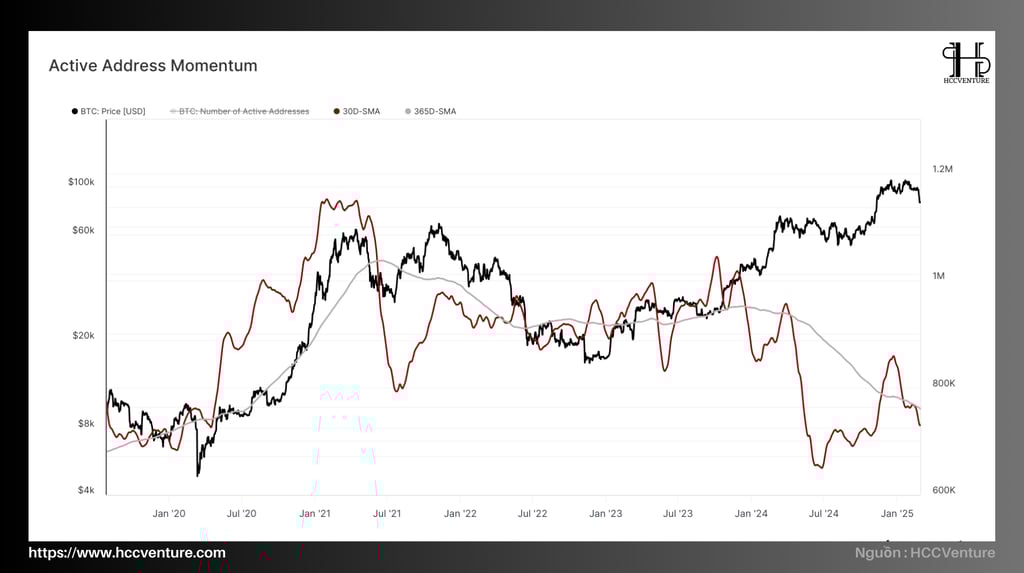
Active addresses peaked at 1 million but have since dropped by more than 25%, indicating a decline in network participation, historical data shows that:
January 2023 - June 2023: Recovering from the bear market
After the 2022 crash, the number of active addresses recovered from 900K to over 1.1M, indicating new capital inflows into the market. BTC rose from $23K to $31K in April 2023 but fell to $25K in June as the number of active addresses dropped slightly to 970K, marking a re-accumulation phase.
July 2023 - December 2023: Accumulate before the strong price increase
Even though BTC dropped to $26K in August, the number of active addresses remained above 1M, reflecting strong accumulation. By November, BTC surged to $38K, with the number of active addresses peaking at 1.25M, indicating capital returning to the crypto market.
January 2024 - June 2024: Explosive growth to historical peak (ATH)
Active addresses hit 1.55M as BTC entered price discovery, surpassing $74K in April 2024. This was the most active period since 2021, fueled by institutional demand and retail investor FOMO.
July 2024 - February 2025: Adjustment & Decline
Even though BTC reaches $105K in January 2025, the number of active addresses has only increased to 1.3M, below the 2021 ATH (~1.6M). This reflects a weakening of network activity, similar to previous cycles when BTC topped out before the market began to run out of steam. If the number of active addresses drops below 1.1M, selling pressure could increase, pushing BTC down to the $80K - $85K range.
Important impacts on the market
Bullish scenario: If BTC holds above $92.5K and active addresses recover, the market could enter a new accumulation phase to continue the uptrend.
Bearish scenario: If active addresses drop below 1.1M, selling pressure could increase, leading to deeper corrections.
Current market phase: BTC is at a crucial turning point where the recovery or continued decline in active addresses will determine the price direction in the coming months.
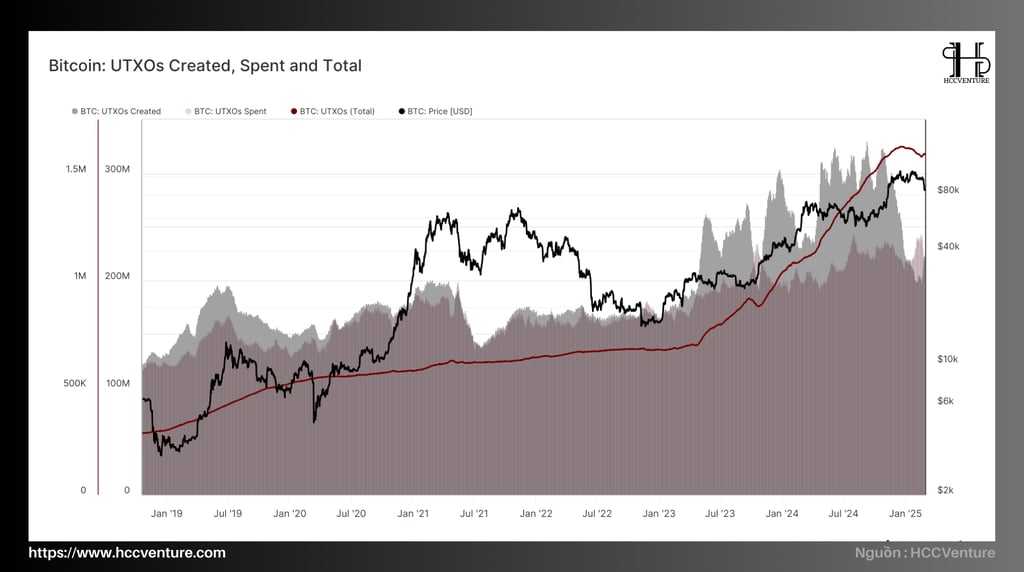
UTXO (Unspent Transaction Output) is an important on-chain metric that represents the total number of unspent Bitcoin transaction outputs. This metric provides insight into investor behavior, accumulation trends, and potential market shifts.
The period from 2023 to 2025 sees significant volatility in UTXO growth, mainly due to the 2024 Halving event, accumulation by long-term investors, and BTC price volatility.
2023: Accumulation returns
The number of UTXOs increased steadily, reaching around 140 million by the end of the year, showing a strong accumulation trend.
After the sharp decline in 2022, the increase in UTXO reflects restored investor confidence as BTC recovers.
Retail investors (Shrimps & Fish) lead the expansion of UTXO, applying DCA (Dollar-Cost Averaging) strategy for long-term holding.
2024: Strong increase before & after Halving
Pre-Halving (Q1 2024): UTXOs spike to around 155 million , as accumulation intensifies ahead of the Halving event.
Post Halving (Q2 2024): UTXO count drops slightly as some investors take profits, but long-term holders remain bullish.
The expansion of UTXOs by small wallets shows continued adoption , while miner activity adds volatility to the supply.
2025: Testing Stability & Resilience
If the accumulation trend continues, the number of UTXOs could reach around 170 million .
If BTC experiences a major correction, panic selling could cause UTXOs to drop in the short term, but the long-term impact would be negligible.
Sustained growth in BTC price will reinforce UTXO expansion, emphasizing market stability and strong long-term holding demand.
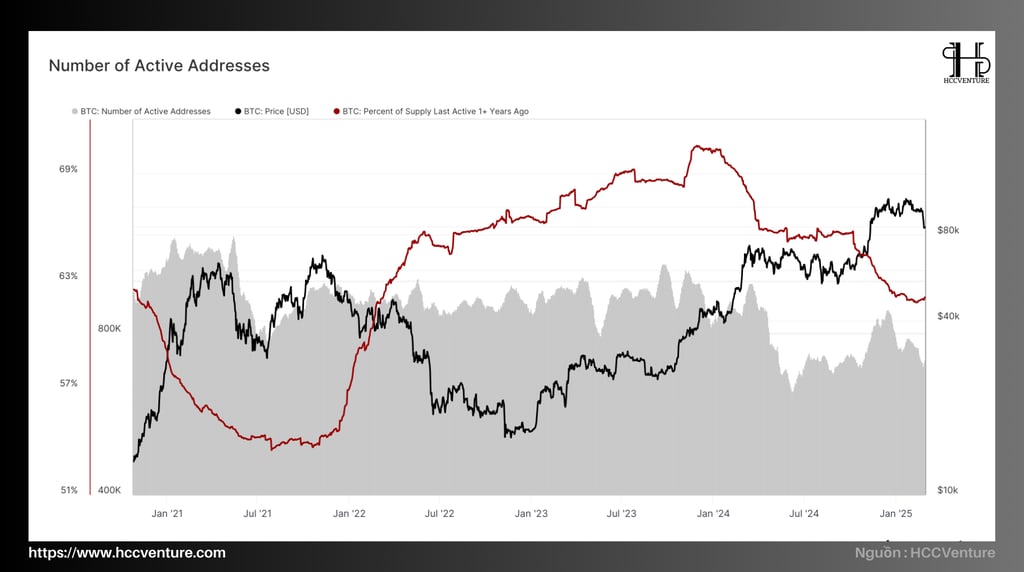
The number of Bitcoin active addresses is an important indicator of investor participation, network activity, and overall market trends . This metric provides insight into Bitcoin's price cycles and potential volatility.
FOMO Phase & Setting New Highs (Early 2024)
Active addresses peaked at 1.55 million in March-April 2024 , coinciding with BTC breaking its previous ATH and hitting $74K .
This is the most active period since 2021, driven by both institutional and individual investor demand .
Decline & Distribution Phase (Late 2024 - Early 2025)
Although BTC reached $105K in January 2025 , the number of active addresses dropped to 1.3 million , lower than the previous peak of 1.55 million.
This shows that network momentum is weakening , reflecting the ability to distribute supply and increasing selling pressure .
Market Impact & Future Scenarios
Bullish Scenario: If active addresses recover to 1.4M - 1.5M , BTC could maintain a mid-term uptrend, indicating continued market strength .
Bearish Risk: If the number of active addresses continues to drop below 1.1M , it could trigger a sharp correction, pulling BTC to the $80K - $85K zone due to profit-taking pressure.
Current Position: Bitcoin is at a critical juncture where on-chain activity will play a decisive role in the next direction of BTC price.

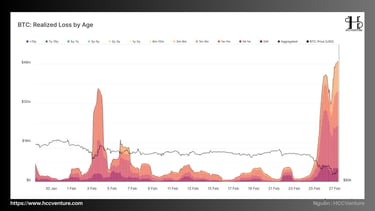
During the period of February 25-27 , the total realized loss amounted to $2.16 billion , mainly coming from new investors entering the market .
Data shows that investors holding BTC for a short term are the hardest hit group:
1 day - 1 week : $927M ( 42.85% total loss from new join group)
1 week - 1 month : $678M ( 31.3% )
1 month - 3 months : $257M ( 11.9% )
Under 24h : $322M ( 14.0% )
Those who bought BTC within the past week suffered the biggest losses, accounting for nearly 43% of the total losses. In contrast, long-term holders saw almost no significant losses , indicating that they are still holding BTC despite the market volatility :
3 months - 6 months : $6.5M ( 0.3% )
6 months - 12 months : $3.2M ( 0.15% )
Buyers in the second half of 2024 and earlier are still holding BTC, while new investors are leaving the market due to bearish pressure.
Short-term investors are under extreme selling pressure, creating the strongest sell-off since mid-2024. Long-term holders remain steadfast, which could help the market find a balance if selling pressure eases. If the lack of demand continues, BTC could continue to retest important support before confirming the next trend.
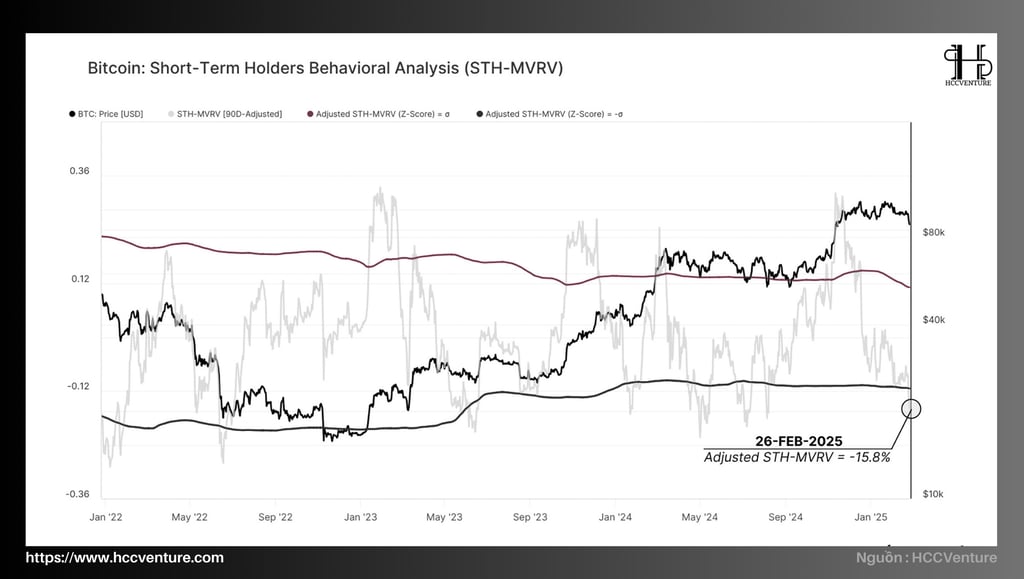
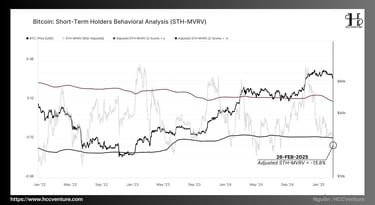
Bitcoin has fallen to $87,000, down 20% from its peak of $109,000, leaving short-term investors with significant losses. Currently, BTC is trading about 5% below the average cost of Short-Term Holders (STH Cost Basis), reflecting the decline in short-term profits.
The STH-MVRV index is currently at 0.95, indicating that the majority of short-term investors have entered the loss zone. Compared to historical data, the average return of this group has decreased by 15.8% compared to the quarterly median, surpassing the threshold of one standard deviation (-11%).
In previous cycles, when STH-MVRV dropped below 1.0 and remained in negative territory for a prolonged period, the market often witnessed large sell-offs due to panic and pressure from leveraged positions. This phenomenon can lead to two main scenarios:
Negative scenario: If the selling pressure from STH continues to increase, especially from investors who have entered the market in the recent period, Bitcoin may continue to decline towards the important support zone between $80,000 and $72,000. This is an area with a higher capitalization density and can act as an absorption zone for selling pressure.
Recovery scenario: If the market sees a strong enough new capital flow, pushing STH-MVRV back above 1.0, this could be a sign that demand is returning and the market is likely to establish a local bottom.
Short Term Outlook
The risk of a sell-off is increasing as STH suffers heavy losses, especially for those who bought in the recent period.
BTC price continuing to stay below the STH Cost Basis could extend the downtrend and push the price to lower support zones.
The market needs new money to recover, otherwise the downtrend may continue in the short term.
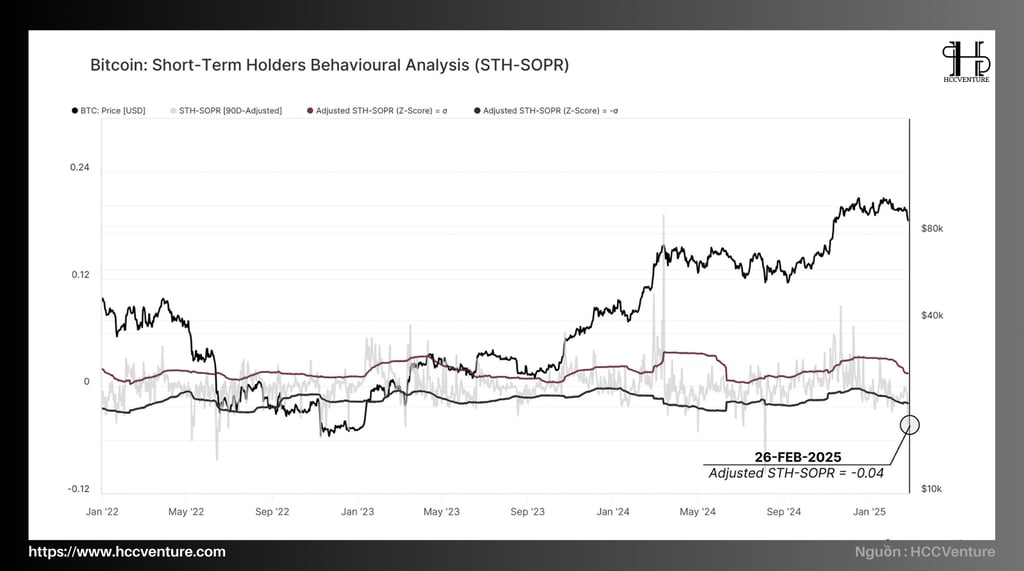
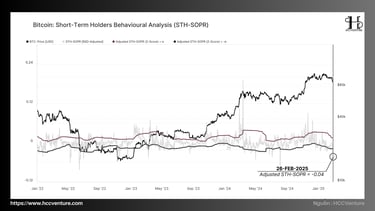
In the recent period, STH-SOPR has decreased by -0.04 from the quarterly median, which is significantly lower than the one standard deviation threshold (-0.01). This shows that a large number of short-term investors are cutting their losses, accepting to sell BTC at a lower price than they bought it.
Market history shows that when SOPR drops sharply , one of two scenarios usually occurs:
Short-term stability : As selling pressure from weak hands gradually decreases, the market may enter a temporary accumulation and recovery phase.
Continued Deep Drop : Without new money flow or strong support, the sell-off could continue, pushing BTC to lower support zones.
At present, macroeconomic conditions remain risky , including tight monetary policy and a decline in liquidity in financial markets. Without a strong stimulus, this correction could last longer than in previous cycles.
STH-SOPR is signaling a sharp increase in stop-loss selling activity, putting pressure on BTC price.
History shows that when SOPR drops sharply, the market often needs time to absorb the selling pressure before having a chance to recover.
If new money does not return soon, BTC could continue its downtrend in the short term.
Conclusion and evaluation
The cryptocurrency market has undergone a sharp correction following the Bybit hack, which led to a sell-off that sent Bitcoin down more than 13.6% for the month. Ethereum, Solana, and the Memecoins group suffered more severe losses, wiping out the previous cumulative gains and sending the market back to April 2024 levels. The impact of this incident not only caused short-term panic but also weakened the market's inherent growth momentum.
One of the most worrying factors is the state of Short-Term Holders (STH) , as on-chain indicators such as MVRV and SOPR both show increasing loss pressure. When Bitcoin fell to the $87,000 - $88,000 range , many investors recently fell into negative equity, forcing them to cut their losses. Market history shows that when the STH-SOPR index falls deeply below the average threshold, the market may enter a “capitulation” phase (a radical sell-off), if there is no new money entering.
In the coming weeks, the market needs a strong catalyst to stimulate demand, otherwise the risk of a deeper decline remains. The key price zones to watch are $87,000 - $92,500 (short-term support), while if this zone is lost, Bitcoin could continue to test $80,000 - $72,000 . The price staying above these levels will determine the market trend in the next quarter.
In short, the cryptocurrency market is at a critical stage. If demand recovers, this could be a good accumulation opportunity for the next cycle. However, if selling pressure from short-term investors continues to increase and there are no new supporting factors, Bitcoin and the entire market could face a deeper correction.
Join the HCCVenture community to get the latest market information. Once again, we give our opinion on potential projects in the crypto market. This is not investment advice, consider your portfolio. Disclaimer: The views expressed in this article are solely those of the author and do not represent the platform in any way. This article is not intended to be a guide to making investment decisions.
API & Data : Glassnode
Compiled and analyzed by HCCVenture
Join our telegram community: HCCVenture
Explore HCCVenture group
HCCVenture © 2023. All rights reserved.


Connect with us
Popular content
Contact to us
E-mail : sp_contact@hccventure.com
Register : https://linktr.ee/holdcoincventure
Disclaimer: The information on this website is for informational purposes only and should not be considered investment advice. We are not responsible for any risks or losses arising from investment decisions based on the content here.

TERMS AND CONDITIONS • CUSTOMER PROTECTION POLICY
ANALYTICAL AND NEWS CONTENT IS COMPILED AND PROVIDED BY EXPERTS IN THE FIELD OF DIGITAL FINANCE AND BLOCKCHAIN BELONGING TO HCCVENTURE ORGANIZATION, INCLUDING OWNERSHIP OF THE CONTENT.
RESPONSIBLE FOR MANAGING ALL CONTENT AND ANALYSIS: HCCVENTURE FOUNDER - TRUONG MINH HUY
Read warnings about scams and phishing emails — REPORT A PROBLEM WITH OUR SITE.