On-chain analysis week 8/2026: Political instability - Market decline
Updated on-chain data for Q1 2026 shows that Bitcoin is entering a stabilization phase after a liquidity slump, with prices fluctuating around $68,000–$71,000.
3/5/202612 min read

Market Summary
Although prices have repeatedly approached and slightly surpassed the psychological mark of $70,000 , the market has yet to establish a stable closing cycle above this level since the beginning of February. This reflects a lack of sustained buying momentum, especially in the context of sharply declining realized profits and investor returns.
However, some stabilizing signals have begun to emerge. Selling pressure in the spot market is gradually decreasing, spot ETF flows in the US are showing signs of reversal after a prolonged period of withdrawal, while the options and derivatives markets are shifting to a more neutral state.
One of the most important on-chain indicators reflecting the weakening of demand momentum is the Realized Profit (30D SMA) – a measure of the value of realized profits on the chain. Between late 2025 and early 2026, this indicator fell by approximately 63% from its most recent cyclical peak , suggesting a significant decline in the amount of profits recorded in the market.
The Percent of Supply in Profit – the proportion of Bitcoin supply that is currently profitable – has now fallen to around 57% , below the -1 standard deviation threshold of the long-term average. In previous cycles, this indicator falling below this threshold typically signaled the market entering a deeper correction phase.
In the derivatives market, the perpetual funding rate and directional premium continue to narrow , reflecting a decrease in speculative leverage. This suggests that traders remain cautious and are not yet ready to build large long positions.
In this context, dealer hedging activities could generate technical buying as the price approaches the $75,000 mark, pulling the price towards this strike zone. This phenomenon has occurred many times in previous cycles, where large gamma clusters become short-term price magnets.
Analyzing on-chain metrics
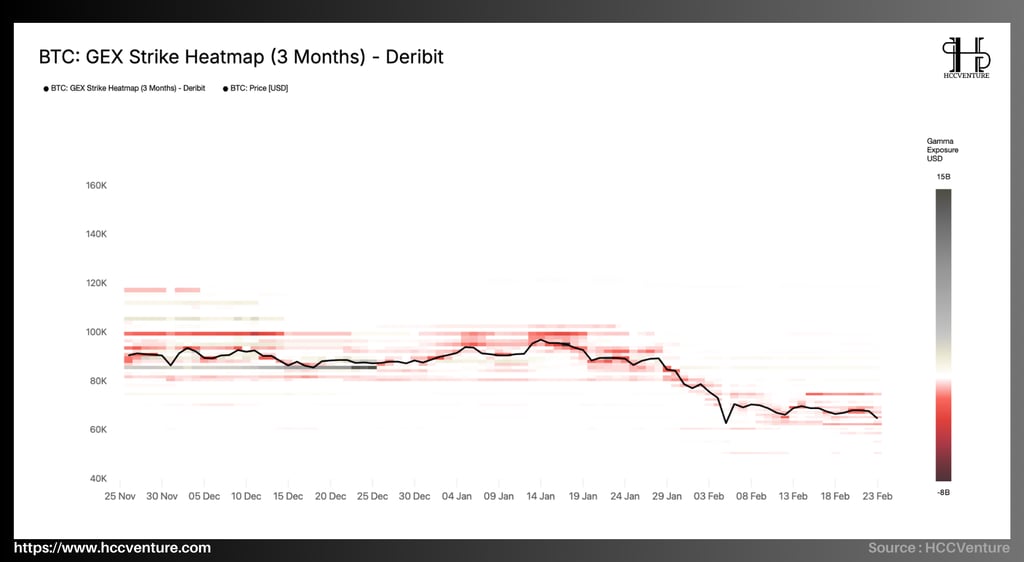
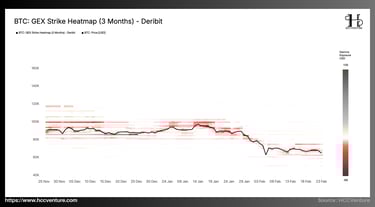
The GEX Strike Heatmap on Deribit for the last three months shows that the microstructure of the Bitcoin market has undergone a significant shift from a stable environment to a state of widening volatility. While in December the market was anchored by large positive gamma zones, keeping the price stable around $85,000–$90,000, this structure changed significantly in January and February as negative gamma zones expanded sharply below the spot price.
This shift reflects market makers (dealers) moving from long gamma to short gamma , causing their hedging mechanism to no longer reduce volatility but instead tend to amplify price movements . By the end of December and the beginning of January, as year-end options contracts expired, the positive gamma zone around $85,000 gradually disappeared from the market structure. When this gamma wall disappeared, the price stabilization mechanism was also eliminated.
Heatmap data shows that in December, the market had a large cluster of positive gamma around the $85,000 mark . The green bands on the chart represent significant positive gamma activity in this area. In practice, this created a gamma wall – a price zone where dealer hedging consistently absorbed volatility.
As a result, Bitcoin maintained a relatively narrow trading range around $85,000–$92,000 during this period , despite fluctuations in macroeconomic factors and capital flows. This stability was not a result of strong capital inflows but mainly stemmed from the technical structure of the options market.
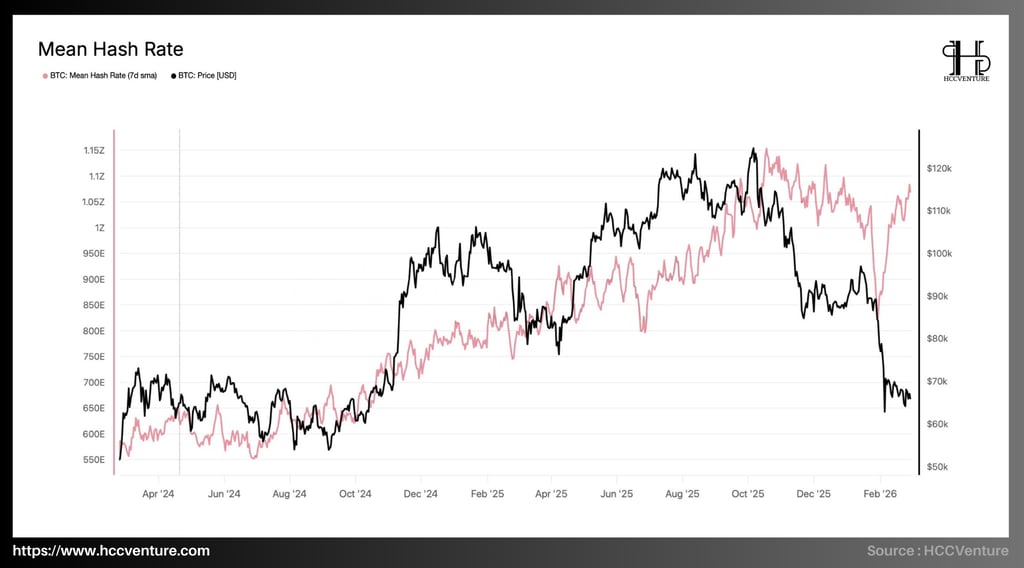
The Bitcoin network's Mean Hash Rate (7-day average) continues its long-term upward trend, reflecting the ecosystem's increasing investment in mining infrastructure. Data updated to early 2026 shows the network's average hashrate has reached approximately 1.05–1.10 ZH/s , a significant increase from around 550–600 EH/s at the beginning of 2024 , representing an increase of over 80–90% in just two years .
This dramatic increase in computing power coincides with the Bitcoin price surge in 2024–2025, when the price peaked around $115,000–$120,000 . However, in early 2026, as the price corrects to the $65,000–$70,000 range , the hashrate will remain at historically high levels.
When placing current data in a historical context, it's evident that the upward trend in hashrate has consistently preceded or paralleled Bitcoin's growth cycles. During the 2017 cycle, hashrate increased from 4 EH/s to nearly 15 EH/s before the market peaked. In the 2021 cycle, this indicator continued its sharp increase from 90 EH/s to over 180 EH/s .
Notably, even during the sharp correction in Bitcoin's price from $120,000 to around $65,000 , the hashrate did not experience a significant drop, remaining near its historical peak. This suggests that large-scale miners are better able to withstand price fluctuations due to lower production costs and larger operating scales.
In the context of the post-2024 halving period, when block rewards dropped to 3,125 BTC , the continued growth in hashrate suggests that miners have offset the revenue decline by scaling up and improving hardware performance.
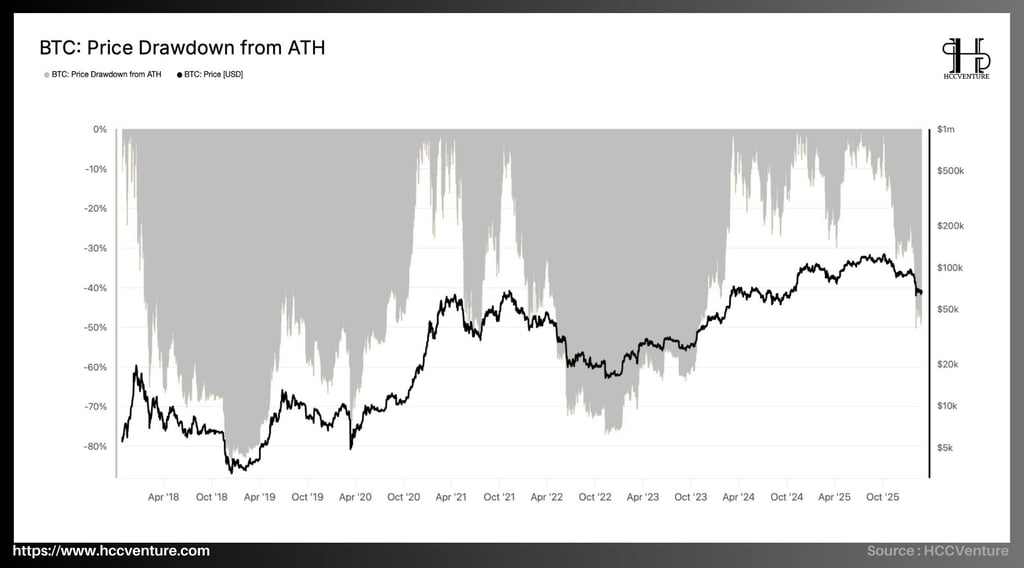
The price drawdown from the all-time high (ATH) is one of the key metrics for assessing Bitcoin's cyclical position within the long-term market structure. The latest on-chain data shows Bitcoin is currently trading in a correction phase, approximately -40% to -45% from its most recent ATH around $120,000 , bringing the price down to the $65,000–$70,000 range .
This decline, when placed within Bitcoin's historical context, remains within the average range of major bull cycles. In previous bear market phases, Bitcoin experienced significantly deeper drawdowns, typically ranging from -70% to -85% from the cycle peak . Therefore, the current correction reflects a rebalancing phase within a long-term bull cycle, rather than a structural weakening of the market.
Similarly, during the 2017–2018 cycle, after setting an all-time high of nearly $20,000 , Bitcoin experienced a prolonged bear market with a maximum drawdown of approximately -84% , bringing the price down to around $3,200 by the end of 2018.
In the most recent cycle of 2021–2022, after peaking around $69,000 , Bitcoin fell to the $15,500 region , equivalent to a drawdown of approximately -77% . This was a deep correction but still consistent with the historical behavior of this asset in previous cycles.
In the current cycle, Bitcoin has reached a new all-time high (ATH) of around $115,000–$120,000 in 2025 , before entering a sharp correction phase in early 2026. The current drawdown of approximately -40% falls precisely within the typical correction range seen in previous bull cycles.
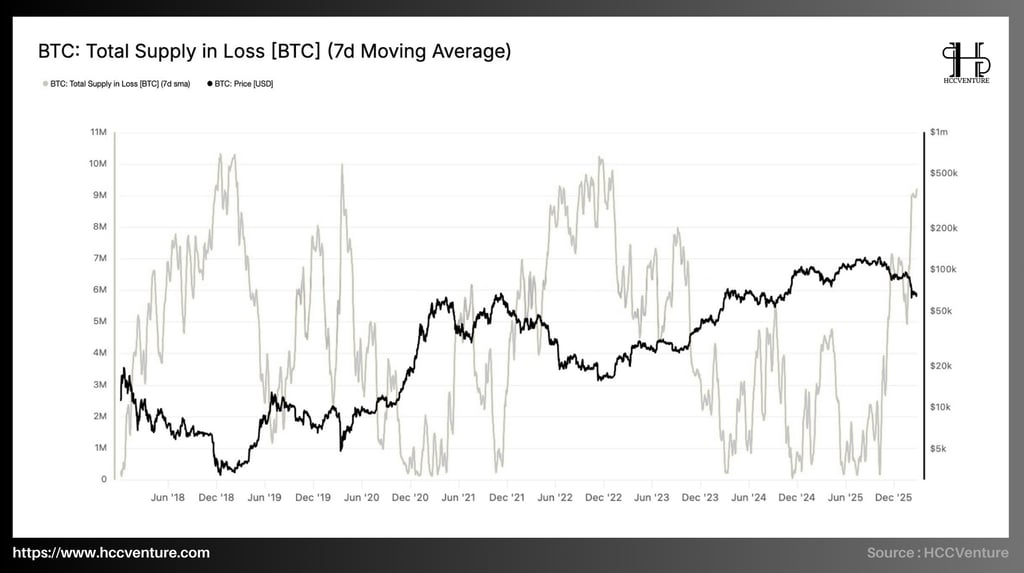
Total Supply in Loss (7-day moving average) reflects the proportion of Bitcoin held at an unrealized loss, meaning the purchase price of the coins was higher than the current market price. The latest on-chain data shows that the amount of Bitcoin in a loss has increased to approximately 9.2 million BTC , equivalent to nearly 46–47% of the total circulating supply .
The sharp increase in loss-making supply is a sign that psychological and financial pressure is spreading across many investor groups, especially those who entered the market in the late stages of the recent bull cycle.
However, given Bitcoin's historical context, the current extent of unrealized losses typically occurs in the later stages of a bear market cycle , when much of the emotional selling pressure has already been reflected in the price.
A similar scenario unfolded in the 2022 cycle , when the collapse of numerous institutions in the cryptocurrency industry and tight liquidity conditions caused Bitcoin to fall to the $15,500 region , resulting in over 9 million BTC entering a state of unrealized losses. Compared to those periods, the current level of 9.2 million BTC in losses in the current cycle demonstrates the extent of psychological pressure in the market.
It has reached a level equivalent to the final stages of a bear market in history.
From a market structure perspective, the sharp increase in the supply of losing coins reflects a significant shift in investor sentiment. When the proportion of losing coins rises to nearly half of the total circulating supply, the market enters a state where the majority of short-term and medium-term investors are under financial pressure.
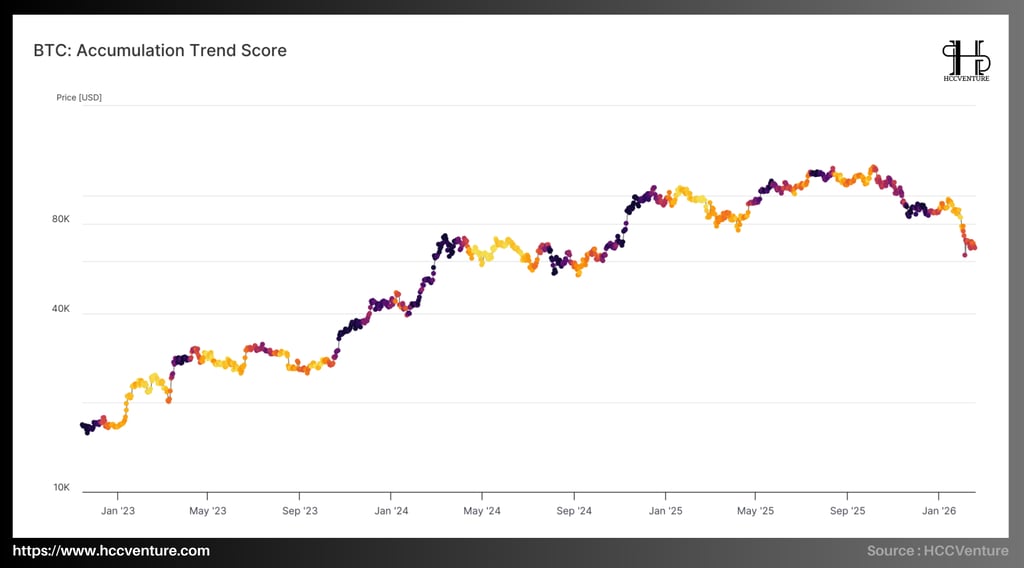
Historically, Bitcoin's ATS (Average Price Action) phases approaching or exceeding the 0.8-1.0 threshold often coincide with strong market accumulation phases, as large investors accelerate their buying in the lower price ranges of the cycle. This occurred during the 2019-2020 period before the strong growth cycle to $64,000, as well as in early 2023 , when Bitcoin began to recover from the 2022 bear market.
Conversely, when ATS remains below 0.5 for an extended period , the market typically enters a neutral or mild distribution phase, where large entities temporarily stay out of the market and new capital inflows are not yet strong enough to establish a sustainable uptrend. Current data suggests that ATS remains capped below 0.5 , reflecting a market state where large-scale investors are not yet ready to move into an active accumulation phase.
The chart shows a clear correlation between periods of strong ATS surges and the formation of sustained uptrends in Bitcoin prices. In previous cycles, when ATS shifted from neutral to strong accumulation zones, the market typically entered a supply reabsorption phase after deep corrections .
However, in the current context, although the supply of Bitcoin in a loss-making state has increased to approximately 9.2 million BTC , large entities have yet to show decisive buying behavior. This suggests that the market lacks sufficient demand to absorb the supply under pressure from short-term investors.
The absence of strong accumulation activity from large wallets reflects a market where long-term confidence has not been fully restored . Under these conditions, any price recovery tends to be technical or short-term, rather than being supported by long-term capital flows.
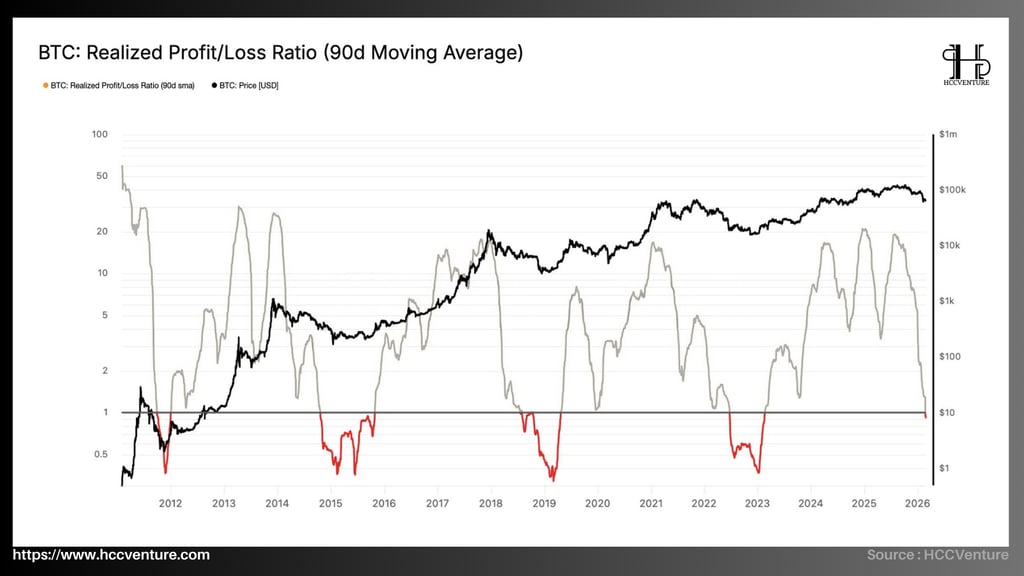
The Realized Profit/Loss Ratio has fallen below 1.0 , marking a shift to an excess loss regime . This is a significant point in the market structure, because when this ratio is below 1, the value of realized losses across the network has exceeded the value of realized profits.
Observing Bitcoin's long-term cycle reveals that the Realized Profit/Loss Ratio typically fluctuates in distinct market phases. During periods of strong growth, this indicator usually remains between 2 and above 10 , reflecting an environment where the majority of transactions on the network are executed in a profitable state.
The major cycle peaks of Bitcoin in 2013, 2017, and 2021 all saw surges in the ratio, as speculative and new money flows pushed the asset's price to historical highs. Conversely, during market downturns, the Realized Profit/Loss Ratio typically falls sharply and remains below 1.0 for extended periods , reflecting the spread of losses across the entire ecosystem.
A Realized Profit/Loss Ratio falling below 1 not only reflects an increase in losing trades but also indicates a significant decline in new buying activity . In this environment, investors are forced to sell assets at prices lower than their purchase cost, creating a negative liquidity cycle as capital leaves the market at a loss.
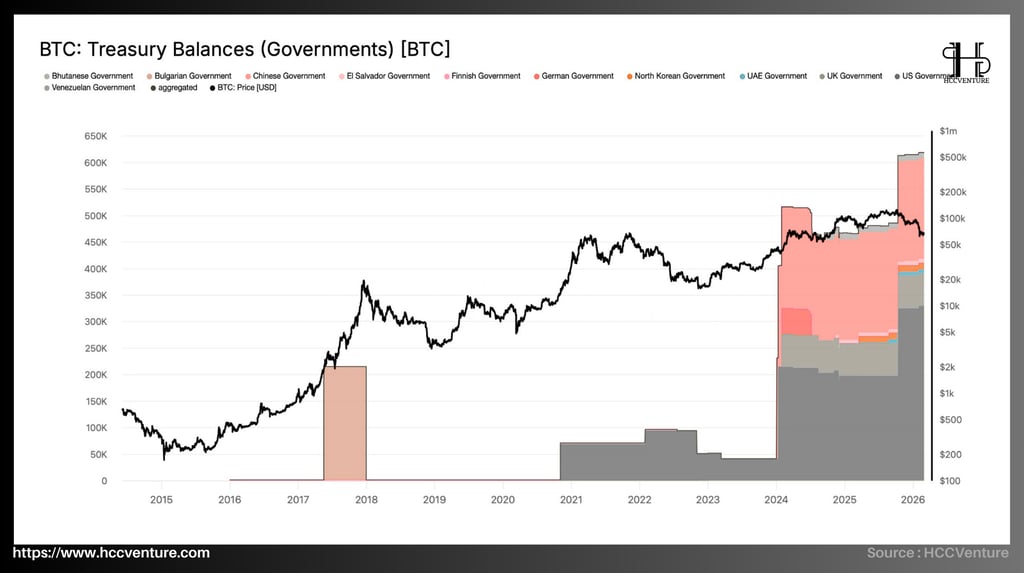
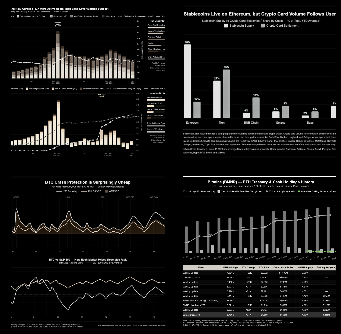
Government Treasury Balances reflect a growing trend in global Bitcoin ownership structure: government agencies have become one of the largest asset holders and wield significant influence over market liquidity.
According to updated data from on-chain analytics platforms, the total amount of Bitcoin controlled by governments has now exceeded 600,000 BTC , equivalent to approximately 3% of the network's total circulating supply . This is the highest level ever recorded since Bitcoin's inception, reflecting a clear shift in how countries approach and manage digital assets.
Among state entities, the United States currently holds the largest amount of Bitcoin , with approximately 200,000–210,000 BTC stored in government-controlled wallets. The majority of these assets come from seizures related to illegal online activities, including major cases like Silk Road and global cybercrime investigations.
Following the United States is China , with approximately 190,000 BTC seized from the PlusToken scam. Although the majority of this Bitcoin is managed by the Chinese authorities through law enforcement agencies, it is still considered one of the potential sources of supply that could significantly impact the market if liquidated.
Besides these two countries, several other countries also possess significant amounts of Bitcoin:
United Kingdom: approximately 60,000–70,000 BTC , primarily from asset seizures related to financial crimes.
Ukraine: over 45,000 BTC , largely from donations and grants following the geopolitical conflict.
El Salvador: approximately 5,700–6,000 BTC , purchased directly through the national Bitcoin reserve strategy.
Bhutan: over 13,000 BTC , largely accumulated through state-run Bitcoin mining operations.
In summary, governments now control a sufficient amount of Bitcoin to become a significant component of the global market's supply structure.
This dramatic increase stems primarily from three main sources: assets confiscated from cybercrime activities , strategic accumulation policies of some countries , and the management of digital assets within national legal systems . Compared to the period before 2020 – when the amount of BTC held by governments was almost negligible – the current structure shows that Bitcoin has gradually become an asset directly supervised and managed by states on a large scale.
This dramatic increase stems primarily from three main sources: assets confiscated from cybercrime activities , strategic accumulation policies of some countries , and the management of digital assets within national legal systems . Compared to the period before 2020 – when the amount of BTC held by governments was almost negligible – the current structure shows that Bitcoin has gradually become an asset directly supervised and managed by states on a large scale.
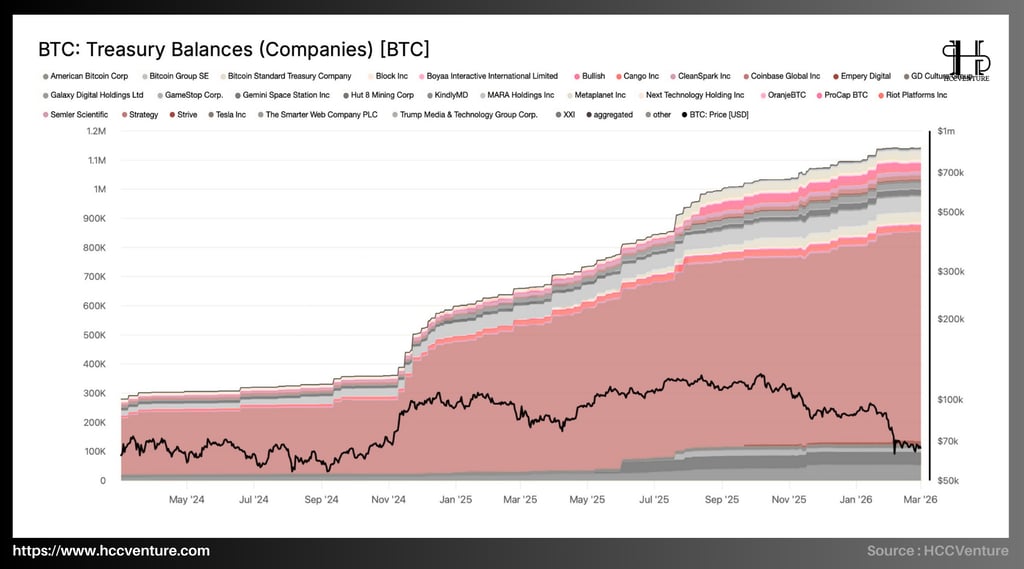
Prior to 2020, the amount of Bitcoin held by businesses was almost negligible. However, a major turning point occurred when Strategy (formerly MicroStrategy) implemented a large-scale Bitcoin accumulation strategy in 2020. Since then, this trend has gradually spread to many other businesses in the technology, Bitcoin mining, and digital finance sectors.
Current data shows that Strategy continues to be the largest Bitcoin holder in the corporate sector , with over 500,000 BTC , accounting for nearly half of the total Bitcoin held by companies. This is one of the largest treasury positions in financial market history, far surpassing other companies. Besides Strategy, several other businesses are also increasing their Bitcoin holdings on their balance sheets, including:
Marathon Digital Holdings (MARA) – over 45,000 BTC
Riot Platforms – approximately 17,000 BTC
Tesla – approximately 10,500 BTC
CleanSpark – over 9,000 BTC
Coinbase – approximately 9,000 BTC
Hut 8 Mining – over 9,000 BTC
Block Inc. – approximately 8,000 BTC
In addition to mining and technology companies, the chart also shows the emergence of many new business entities joining the Bitcoin accumulation strategy, including financial companies, investment funds, and media technology businesses.
The fact that businesses hold over 1.1 million BTC has a significant impact on the long-term supply structure of the market. When companies accumulate Bitcoin as a reserve asset, the majority of this Bitcoin is typically held for the long term and is unlikely to return to the market in the short term.
Assessment and Conclusion
One of the most significant structural shifts in the current Bitcoin cycle is the rapid increase in the amount of BTC held by institutional entities, including listed companies and governments. Aggregate on-chain data shows that in the last six months, corporate Bitcoin treasuries have increased from approximately 854,000 BTC to over 1.11 million BTC , equivalent to a net increase of about 260,000 BTC .
According to the latest aggregated data, the 30-day moving average realized profit has decreased by more than 60% from its peak in the cycle , reflecting a significant decline in demand for trading at high price levels. When realized profits fall sharply, it indicates that market participants are no longer willing to accept trades at high valuations, and the rate of capital turnover within the system has also slowed down.
Spot cash flow data indicates that selling pressure in the spot market is gradually decreasing , particularly as the Cumulative Volume Delta (CVD) index on major exchanges begins to stabilize after a prolonged period of heavy selling. Simultaneously, capital flows from US spot Bitcoin ETFs – which had experienced a prolonged outflow for several weeks – are now showing signs of stabilization, with small inflow sessions beginning to return .
Meanwhile, data from the options market reveals a notable shift in hedging structure. Following a sharp increase in implied volatility in February, ATM Implied Volatility across major maturities is gradually narrowing , indicating a significant decline in demand for extreme risk hedging. Simultaneously, the 25-delta skew has also fallen sharply from previous highs , reflecting a decrease in traders' aggressive buying of options to protect the downside.
From a market structure perspective, a key characteristic of this investor group is their long-term holding period and low sensitivity to short-term price fluctuations . Unlike speculative capital flows in derivative markets or cyclical ETF flows, the amount of BTC in corporate treasuries is typically held for many years and rarely reintroduced into the market.
Disclaimer: The information presented in this article is the author's personal opinion in the field of cryptocurrency. This is not financial or investment advice. All investment decisions should be based on careful consideration of your personal portfolio and risk tolerance. The views expressed in this article do not represent the official stance of the platform. We recommend that readers conduct their own research and consult with experts before making any investment decisions.
Compiled and analyzed by HCCVenture
Follow HCCVenture here: https://link3.to/holdcoincventure
Explore HCCVenture group
HCCVenture © 2023. All rights reserved.


Connect with us
Popular content
Contact to us
E-mail : sp_contact@hccventure.com
Register : https://linktr.ee/holdcoincventure
Disclaimer: The information on this website is for informational purposes only and should not be considered investment advice. We are not responsible for any risks or losses arising from investment decisions based on the content here.
TERMS AND CONDITIONS • CUSTOMER PROTECTION POLICY
ANALYTICAL AND NEWS CONTENT IS COMPILED AND PROVIDED BY EXPERTS IN THE FIELD OF DIGITAL FINANCE AND BLOCKCHAIN BELONGING TO HCCVENTURE ORGANIZATION, INCLUDING OWNERSHIP OF THE CONTENT.
RESPONSIBLE FOR MANAGING ALL CONTENT AND ANALYSIS: HCCVENTURE FOUNDER - TRUONG MINH HUY
Read warnings about scams and phishing emails — REPORT A PROBLEM WITH OUR SITE.