


On-chain analysis week 8/2025: Bitcoin cools down, liquidity declines
Bitcoin is currently trading in the $93k - $97k range, indicating a correction phase across the entire digital asset market. Capital inflows into the market are weakening, while activity in the derivatives market shows signs of cooling down, reflecting investor caution.
2/23/20258 min read
Summary
After failing to surpass the $105k mark for the second time in late January , the Bitcoin market has entered a contraction phase , with monthly price momentum declining across most major digital assets.
On-Chain data shows that the accumulation pattern of Short-Term Holders (STH) is similar to the period in May 2021 – a time when the market struggled and faced a strong sell-off. This could signal a potential period of instability , especially if market sentiment continues to weaken.
While Bitcoin remains stable, altcoins like Ethereum, Solana, and the Memecoins group are seeing deeper corrections , reflecting a shift in investor risk appetite.
Over the past two years, Solana has emerged as one of the most capital-intensive digital assets , outperforming Ethereum – which has struggled to maintain steady demand.
Data from the perpetual futures market shows a sharp decline in total open interest , reflecting investor disenchantment with leverage: Bitcoin (-11%), Ethereum (-23.8%), Solana (-6.2%), Memecoins (-52.1%).
Memecoins losing more than 50% of their OI shows that the market is rapidly draining liquidity from high-risk assets, as investors reduce leverage and speculative sentiment weakens significantly.
In the coming period, Bitcoin may continue to maintain its market leadership position, while altcoins will need time to absorb the selling and re-establish growth momentum.
On-chain metrics analysis
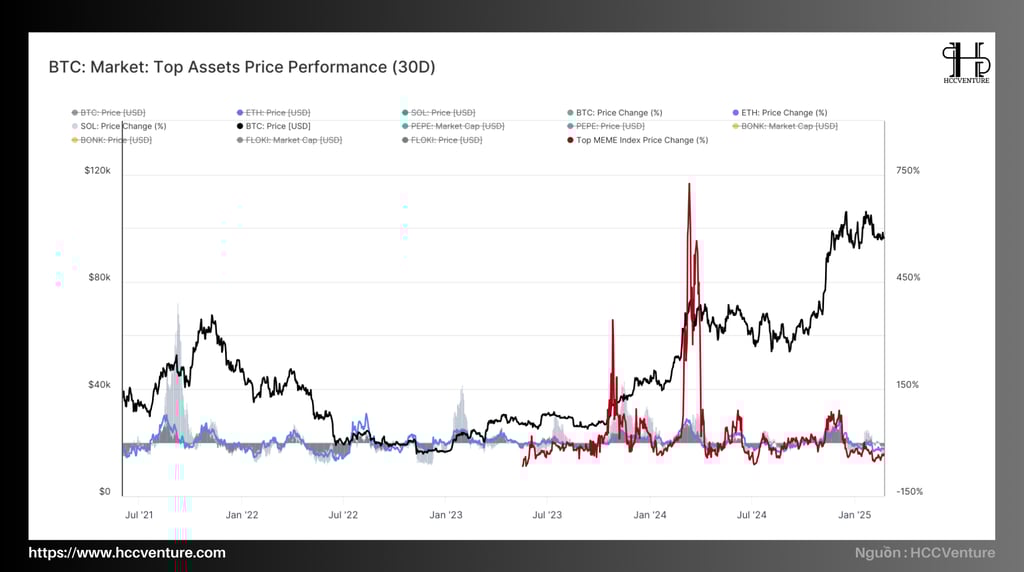
In late January 2025, Bitcoin made an attempt to break the ATH and entered a price discovery phase. However, this rally failed to sustain enough momentum, leading to the market entering a contraction and accumulation phase since then. Price momentum has been falling sharply across most major digital assets, including:
Bitcoin : +48.4% (November 2024) → -5.9% (Feb 2025)
Ethereum : +60.3% (Dec 2024) → -16.9% (Feb 2025)
Solana : +53.2% (November 2024) → -33.1% (Feb 2025)
Meme Coins Index : +90.2% (December 2024) → -37.4% (Feb 2025)
During strong market uptrends, Solana and Memecoins tend to perform the best , with gains outperforming Bitcoin and Ethereum.
However, during the correction period, these two asset groups also declined the most , reflecting high levels of speculation and greater sensitivity to deteriorating market conditions.
Ethereum, despite showing strong gains in late 2024 , has been one of the worst performing assets in this entire cycle . While Ethereum has been down less than Solana over the past week, there is still no clear sign of a sustained outperformance trend.
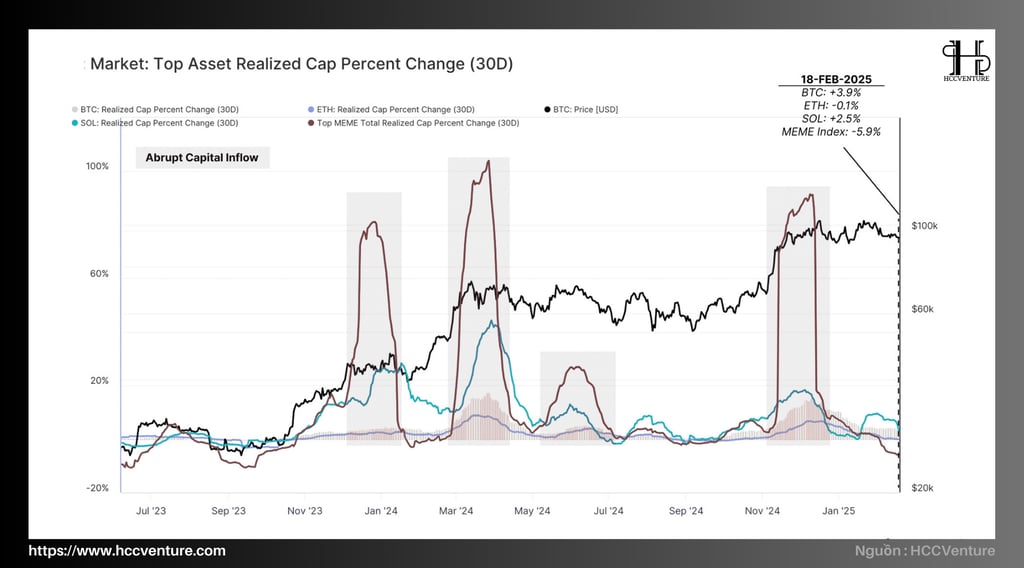
Over the past two years, Solana has outperformed other digital assets , thanks to steady and sustained investment flows. When analyzing the monthly changes in Realized Cap , clear trends in capital flows among major digital assets can be seen:
Solana : Attracting the largest capital inflow , creating a foundation for strong price growth.
Ethereum : Recorded the weakest net inflows among major asset classes, explaining ETH's poor performance this cycle.
Memecoins : Short-term but unsustainable capital inflows , reflecting strong speculation but lack of long-term sustaining momentum.
Over the past few weeks, inflow momentum has declined across the entire market . Notably, Ethereum and Memecoins have turned negative net inflows :
Ethereum : -0.1% net outflow from Realized Cap , indicating investors are taking profits or moving capital to other assets.
Memecoins Index : -5.9% outflow , reflecting a sharp withdrawal of speculative capital from highly volatile assets.
This could indicate that the decline in capital flows indicates that speculative sentiment is cooling and could lead to a sharper correction in riskier assets. While Solana has the advantage of strong capital flows, if the general trend of capital withdrawals continues, the SOL token could also face a major decline in the near future.
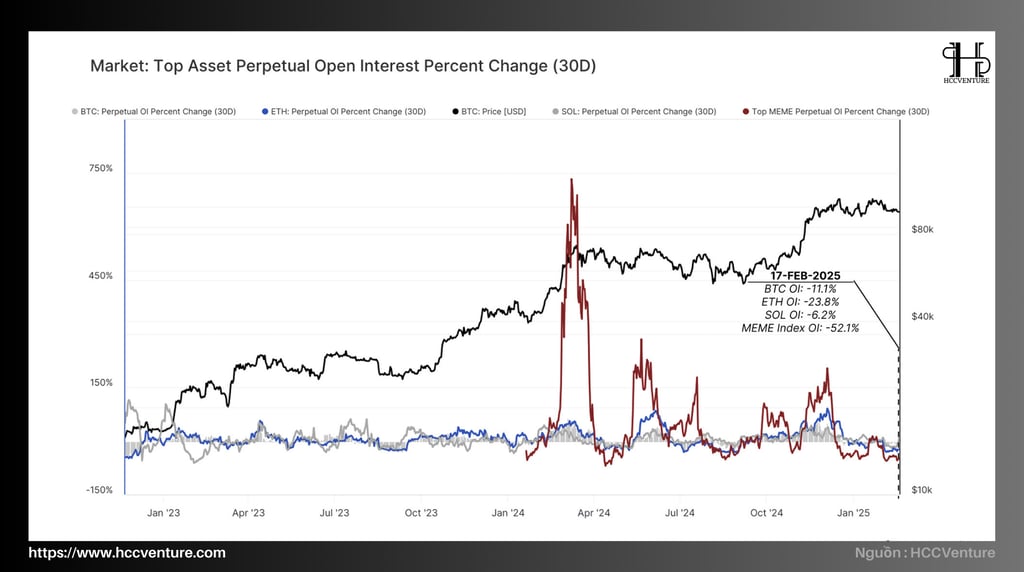
As price momentum in the spot market began to weaken, capital flows also recorded a clear retreat in the perpetual futures market .
The decline in spot market demand has led to a sharp decline in total Open Interest (OI) across all major assets, reflecting the withdrawal of speculative flows and weakening arbitrage yields (cash & carry).
OI change data over the past 30 days shows a broad-based decline:
Bitcoin OI : -11.1%
Ethereum OI : -23.8%
Solana OI : -6.2%
Memecoins OI : -52.1%
Looking at the figures, the biggest decline among major assets was in Ethereum with -23.8% while memecoins saw a drop of more than 50% which shows that with the withdrawal of speculative types, the market will create a strong negative sentiment and liquidity will gradually dry up.
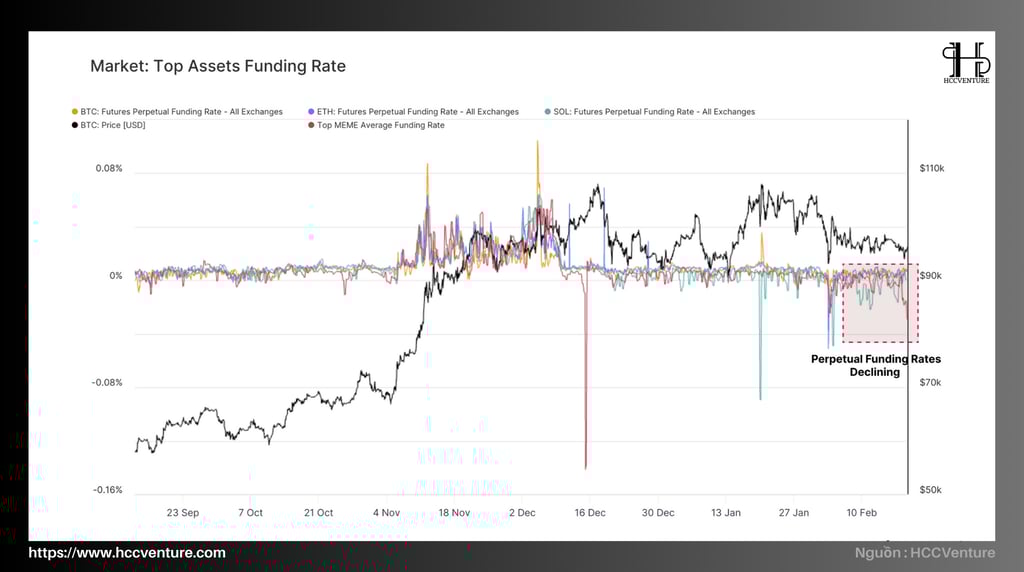
The weakening in Open Interest (OI) is being further reinforced by a decline in perpetual contract funding rates , suggesting that market sentiment is tilting towards bearish.
This is a clear sign of leveraged positions being closed , especially in high-risk assets. In-depth analysis shows that:
Bitcoin and Ethereum maintained positive FR, reflecting deeper liquidity and relative stability in the market, while the two assets had negative FR when they entered a “leverage wash-out” event.
Meanwhile, Solana and Memecoins have had negative FRs for the past two weeks, forcing long positions to close or be liquidated.
If funding rates continue to remain deeply negative , shorting weak assets like Memecoins may be considered, but risk management should be tight due to the potential for high volatility.

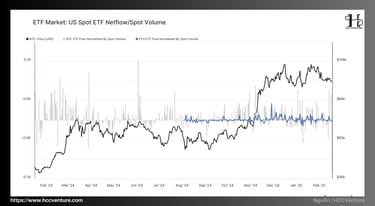
In the context of narrowing adjustment, institutional investors in Bitcoin and Ethereum ETFs have slowed down significantly, which can be seen in the net flows of ETFs and spot volume:
Over the past week, ETFs have seen continuous outflows, with some days recording net withdrawals of over $200M, indicating increased selling pressure from these institutions. However, there are two directions of judgment: a market correction or because they are restructuring their investments.
However, after the withdrawal period, the market witnessed a strong recovery in capital flows into ETFs, with net buying value exceeding 8% of total spot trading volume . Are they “buying the dip”?
Ethereum ETF inflows have been almost negligible , with the net difference between inflows and outflows hovering around near zero . This reflects a lack of institutional investor interest in ETH.
This divergence could continue in the coming period if ETH does not have a significant stimulus to reverse this trend.
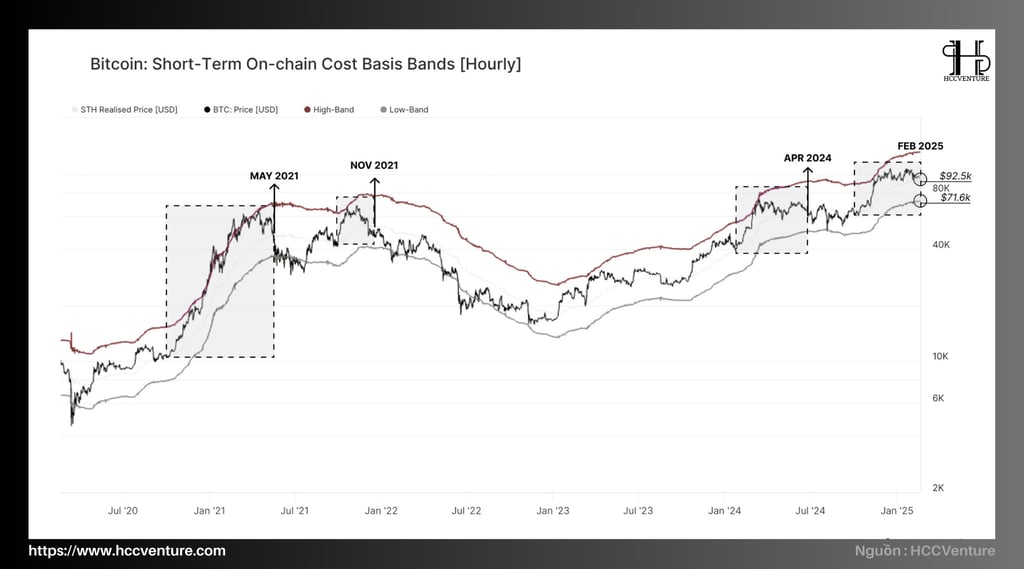
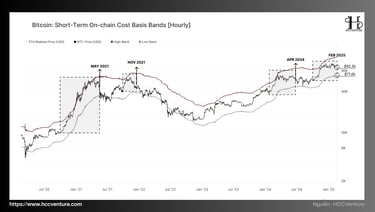
Bitcoin is currently trading in the $1,000 - $5,000 range above the Short Term Holdings (STH) price target , which is set at $92,500.
Market history shows that this is a pivotal point , acting as a pivot point between periods of price increase and local correction. This is the area where the most recent investors start to fall into unrealized profit or loss, directly affecting their psychology and trading behavior.
When analyzing the periods where Bitcoin reached an all-time high (ATH) before entering a correction, we can see a similar pattern across periods:
May 2021 : Strong correction after reaching ATH, when price dropped below STH cost.
November 2021 : Similar trend with loss of important support level, signaling a prolonged decline.
April 2024 and February 2024 : Two Bitcoin corrections after peaking, with price trajectory approaching the lower band of the STH cost model.
In all four cases, Bitcoin extended its decline to -1 standard deviation (σ) below the STH cost . If this pattern continues, we can expect Bitcoin to potentially correct to $71,600 , which is a key level to assess short-term downside risk.
Bitcoin is currently at a crucial crossroads between bullish and bearish trends. The $92,500 level is not only a psychological support level but also a measure of the market's ability to maintain momentum. In the event of increased selling pressure, the $71,600 level would be the next support level to watch.a
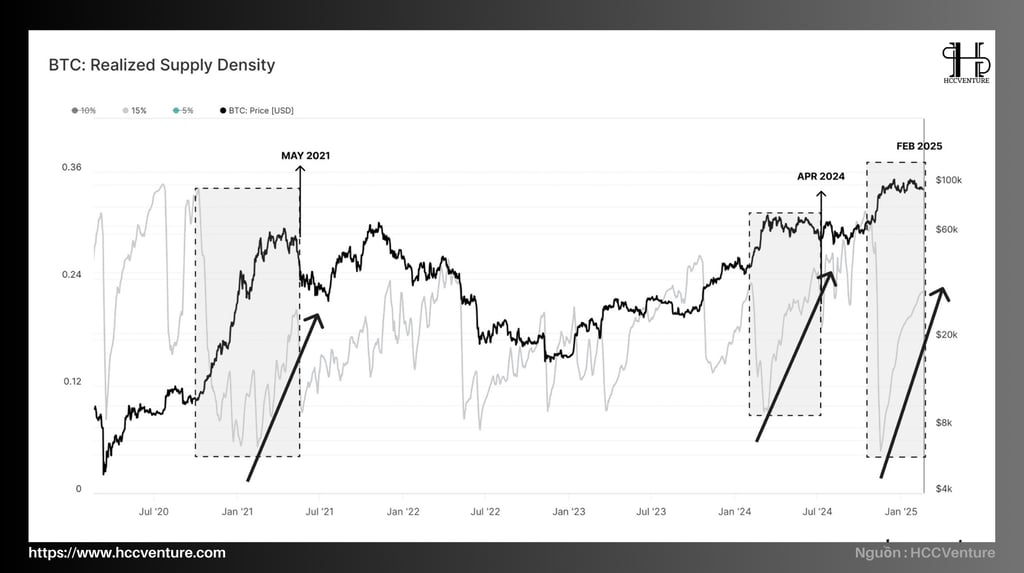
In previous cycles, when Bitcoin reached an all-time high (ATH) , the market usually went through an accumulation and correction phase with a clear pattern.
Specifically, there is a significant increase in the actual supply density within ±15% of the spot price. Historical data shows:
Price Discovery Phase : When price breaks ATH, actual supply density declines sharply as investors hold BTC in anticipation of higher prices.
Accumulation and Correction Phase : When the market cannot sustain the strong upward momentum, distribution begins. Investors sell a portion of their BTC holdings, increasing the actual supply density within a range of ±15% around the current price.
Support Level Testing Phase : Typically, the Short-Term Holding (STH) price level becomes the main support zone, where new investor sentiment is tested.
Bitcoin is currently in a supply-demand balance phase after reaching ATH. History shows that a high increase in real supply density within ±15% of the spot price is a sign of a correction phase after a strong rally.
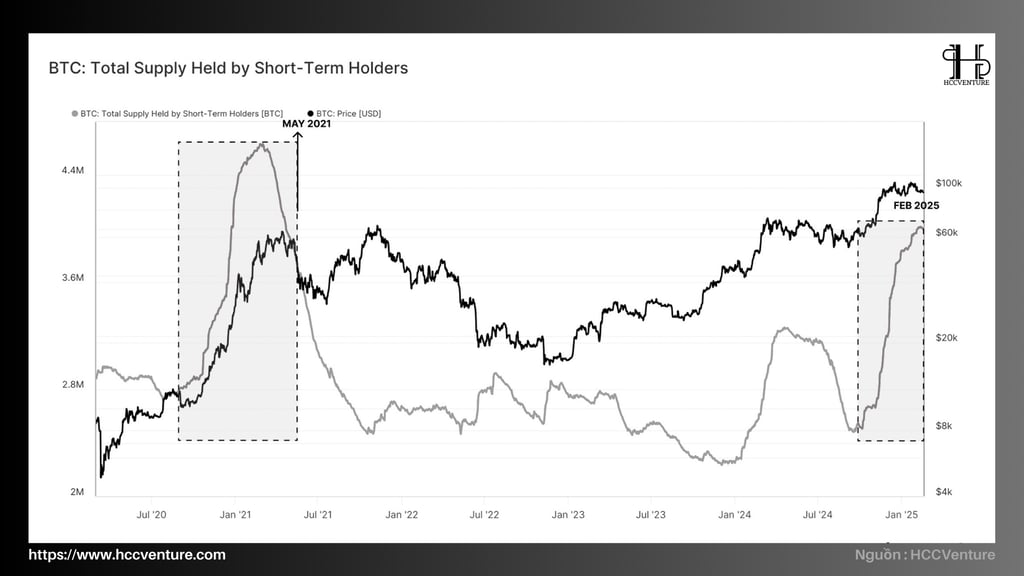

Data on STH supply changes shows:
The current cycle has many similarities to the May 2021 period – this is when the supply held by STH increased sharply, meaning a large number of new investors bought in during the hot market period. This made them vulnerable when the price fell below the average cost of capital (~$92.5k).
April 2024 also recorded strong accumulation by new investors , however, the structure of STH supply growth in this cycle is more similar to 2021 than 2024.
Based on the above data, we can see two scenarios:
Uptrend Continues: If buying pressure remains steady, Bitcoin could establish a new trading range above the ATH, which would require strong demand from institutional investors and ETFs.
Deeper correction trend: If the price falls below the average capitalization price of the STH group ($92.5k), this could trigger panic among new investors, causing them to sell off BTC to preserve capital. The distribution process could continue for a long time, similar to the large corrections after ATH in previous cycles.
Evaluation and Conclusion
Bitcoin continues to trade steadily around $95k , maintaining a multi-week consolidation. However, this stability is not reflective of the entire digital asset market, as Ethereum, Solana, and the Memecoins group are under strong corrective pressure from cyclical peaks .
The Memecoins group, in particular, has seen a significant drop in demand , as evidenced by capital outflows , a severe price decline, and bearish sentiment in the derivatives market . This is a sign that the euphoria of the previous growth phase has run out, and money is gradually leaving riskier assets.
The $92.5k price point , which corresponds to the STH Cost Basis , is a key milestone to watch:
If Bitcoin holds above this level , it will be a positive signal, indicating that the market may continue its accumulation state before establishing a new trend.
Conversely, a break below $92.5k could trigger a strong sell-off , as a large number of recent investors would see their investments move from unrealized profits to unrealized losses. This could lead to panic , leading to increased selling pressure and opening the door to a deeper correction.
Join the HCCVenture community to get the latest market information. Once again, we give our opinion on potential projects in the crypto market. This is not investment advice, consider your portfolio. Disclaimer: The views expressed in this article are solely those of the author and do not represent the platform in any way. This article is not intended to be a guide to making investment decisions.
API & Data : Glassnode
Compiled and analyzed by HCCVenture
Join our telegram community: HCCVenture
Explore HCCVenture group
HCCVenture © 2023. All rights reserved.


Connect with us
Popular content
Contact to us
E-mail : sp_contact@hccventure.com
Register : https://linktr.ee/holdcoincventure
Disclaimer: The information on this website is for informational purposes only and should not be considered investment advice. We are not responsible for any risks or losses arising from investment decisions based on the content here.
TERMS AND CONDITIONS • CUSTOMER PROTECTION POLICY
ANALYTICAL AND NEWS CONTENT IS COMPILED AND PROVIDED BY EXPERTS IN THE FIELD OF DIGITAL FINANCE AND BLOCKCHAIN BELONGING TO HCCVENTURE ORGANIZATION, INCLUDING OWNERSHIP OF THE CONTENT.
RESPONSIBLE FOR MANAGING ALL CONTENT AND ANALYSIS: HCCVENTURE FOUNDER - TRUONG MINH HUY
Read warnings about scams and phishing emails — REPORT A PROBLEM WITH OUR SITE.