


On-chain analysis week 7 / 2024: LTH damage level
The digital asset market has been experiencing a period of extreme volatility in recent weeks, with Bitcoin and Altcoin prices plummeting, leaving many investors with significant losses. The Altcoin sector in particular has been hit particularly hard, with valuations and liquidity plummeting. The sell-off reflects a combination of factors, including heightened risk sentiment, macro volatility, and liquidity pressure from the derivatives market.
2/16/20258 min read
Summary
This sell-off has caused the total cryptocurrency market capitalization to evaporate more than $400 billion in just two weeks, falling from $2.5 trillion to $2.1 trillion .
Realized Losses: In just 5 days, the market has seen a realized loss of $3.2 billion , one of the highest in history.
Exchange Inflows: Over 200,000 BTC has been pushed onto exchanges, the highest level since the FTX crash in 2022. This is a sign that panicked investors are selling.
Bitcoin Dominance increased from 55% to 61% , showing that investors are withdrawing capital from Altcoins to preserve assets. Stablecoin Dominance also increased sharply , with money flowing into USDT, USDC to avoid risks from volatile markets.
Investors are now closely watching key support zones to gauge whether this sell-off is a short-term correction or the start of a deeper downtrend.
On-chain metrics
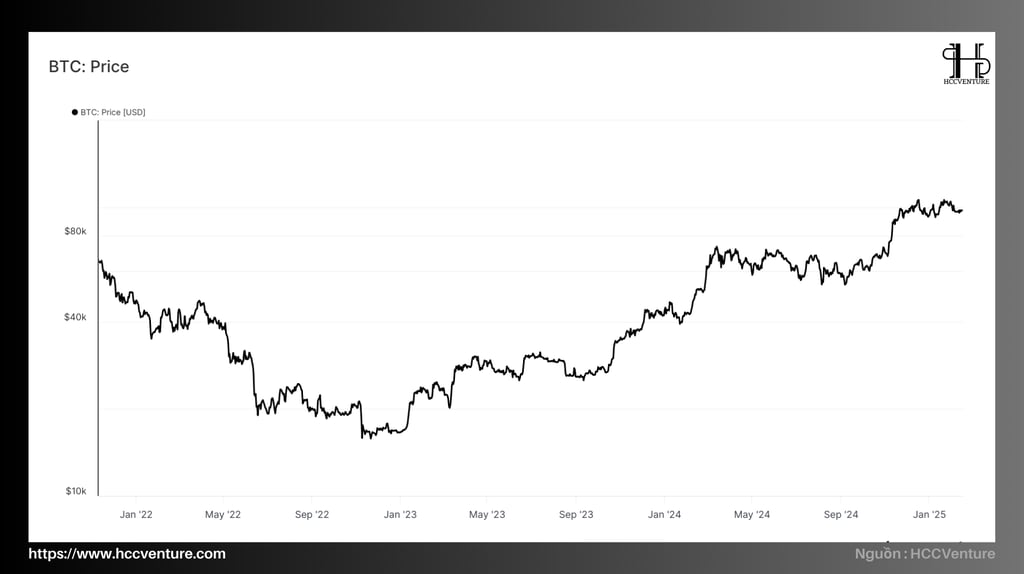
Bitcoin investors have seen a wild price swing over the past week. BTC initially dropped to $93,000 , then quickly recovered to $102,000 , before returning to trade around $98,000 .
The volatility largely reflects market sentiment in the face of President Trump's threat to impose tariffs on Canada, Mexico and China , creating a volatile macro backdrop for investors.
In addition, the US dollar continues to maintain its strength , making the liquidity environment more tense. The DXY (US Dollar Index) has been rising steadily in recent weeks, putting pressure on risk assets like Bitcoin.
This combination of political and macroeconomic factors is sending markets into a period of hesitation, as investors seek to position themselves ahead of the next developments in global monetary and trade policy.
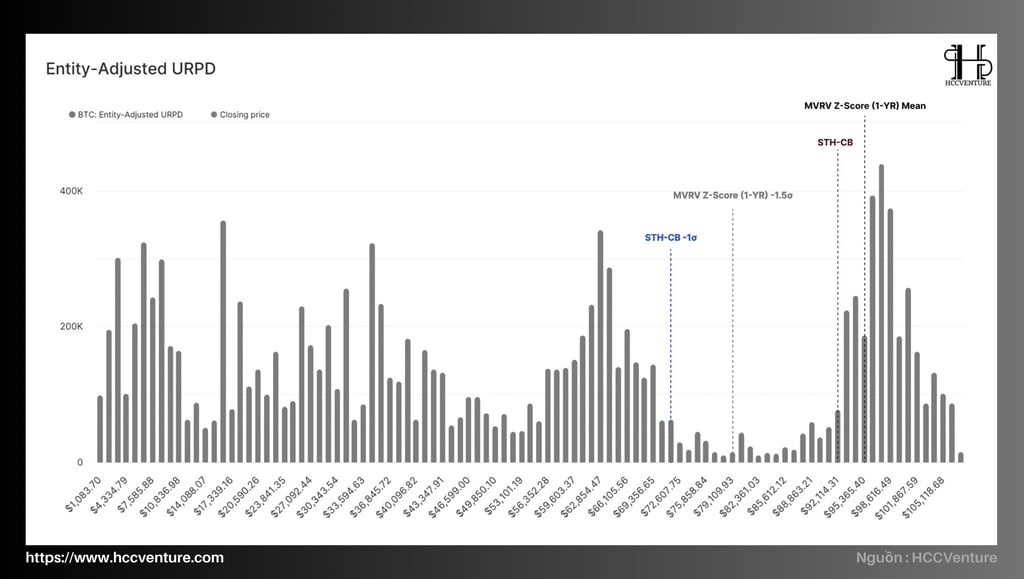
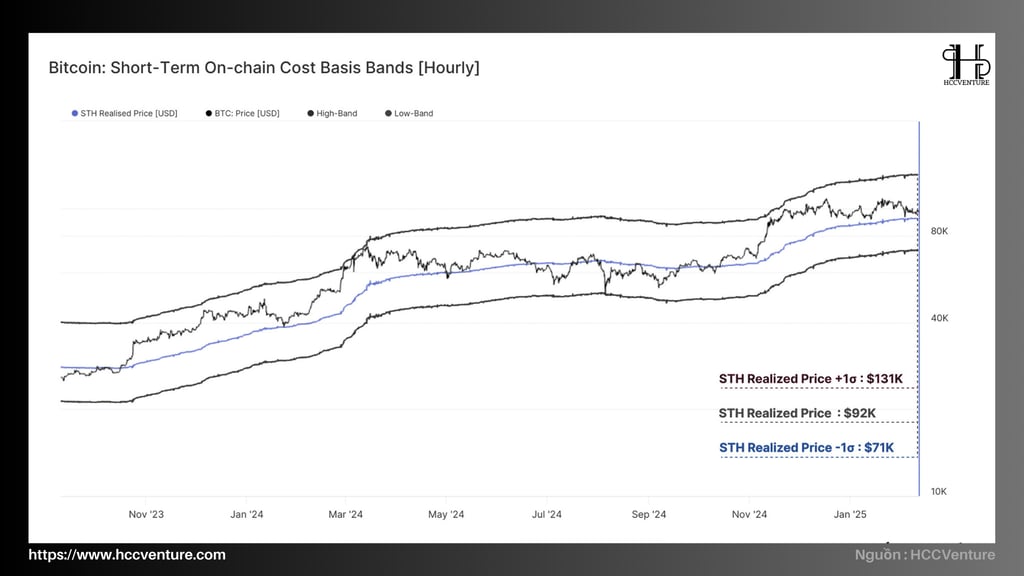
The importance of protecting the base cost of the Short Term Trader (STH) group and the price zones according to the MVRV 1Yr Z-Score indicator becomes more evident when compared to the URPD volume profile data .
When analyzing volume by price level, a volume air-pocket can be observed just below these important levels, reflecting that very few trades were made within that price range.
This means that if BTC price breaks below key support levels, the market could experience a lack of local liquidity , increasing the risk of further sharp declines.
Notably, the -1σ zone of the STH basis cost is located right at the upper boundary of this volume gap, suggesting that this could be an extremely sensitive area if price continues to correct.
History shows that low volume areas tend to result in stronger price movements , due to a lack of support buy orders. If Bitcoin breaks below this level, selling pressure could increase, pushing the price to deeper support levels.
History shows that the STH base cost often acts as strong support in uptrends , especially during bull market cycles.
Currently, the STH Cost Basis level is around $92.2K , which is considered an important zone that needs to be held to avoid the risk of a deeper correction.
Alternatively, we can apply the Z-Score Transformation method , using ±1σ bands to determine the normal range of BTC price fluctuations:
STH Cost Basis +1σ (upper resistance zone): $131K
STH Cost Basis -1σ (support zone below): $71K
Currently, Bitcoin price is trading within this range and above the STH Cost Basis level, indicating that buyers are still in control of the market. However, the recent sell-off has pushed BTC price closer to this important support area, indicating that selling pressure is increasing.
Tracking Strategy
If Bitcoin breaks below $92.2K , this could be a signal of weakness and open up the risk of a retest of the $71K zone (-1σ threshold).
Conversely, if BTC holds the STH Cost Basis zone, buying pressure from short-term investors could push the price back to the $100K+ zone , with the next target being the $131K (+1σ) zone.
Investors need to monitor the reaction of Bitcoin ETFs , capital flow data, and derivatives markets to determine the strength of buyers at this important support zone.
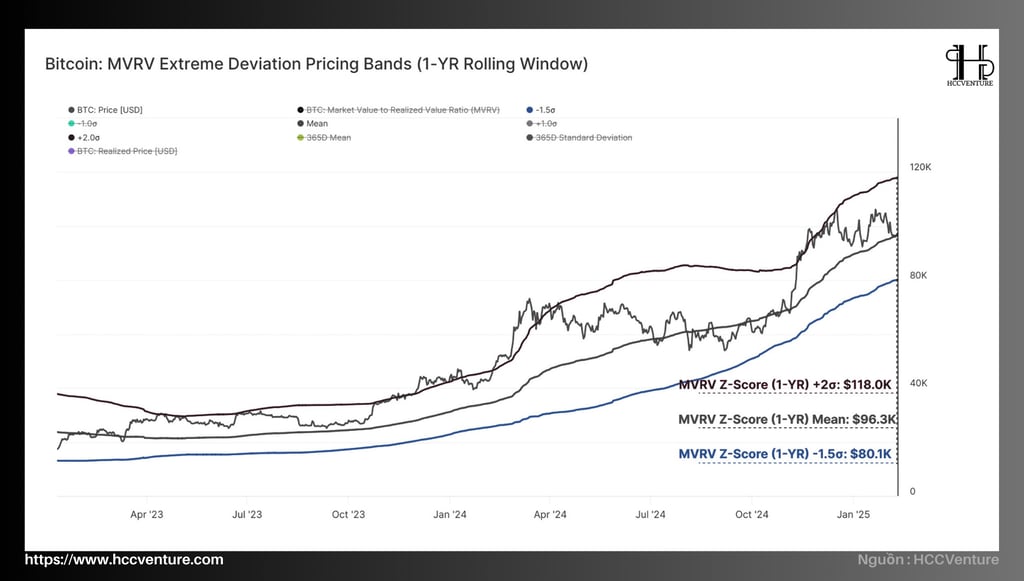
As Bitcoin price has been volatile in recent times, using on-chain indicators helps identify important support and resistance levels to gauge market trends.
Here are the key price milestones according to MVRV Z-Score:
+2σ (Upper Resistance Zone) : $118K
Mean (Average 1 Year) : $96.3K
-1.5σ (Support Zone Below) : $80.1K
Currently, Bitcoin price is finding solid support near the Mean $96.3K level , indicating that this is an area that buyers are actively defending. If the price stays above this level, the uptrend could continue, with the nearest resistance level located at +2σ ($118K) .
However, if the price breaks below the Mean zone , the next scenario to watch is the -1.5σ level at $80.1K , which could be the next strong support level where bulls will defend their positions.
Tracking Strategy
If BTC holds above $96.3K , the uptrend could continue with a target of $118K . However, profit-taking pressure could appear here as many investors take unrealized profits.
If BTC breaks below $96.3K , the risk of a retest of the $80K support zone increases. This will be an important defensive level for bulls to avoid a deeper decline.
Investors should monitor ETF flows, data from the derivatives market (OI & Funding Rate), as well as global liquidity fluctuations to confirm short-term trends.
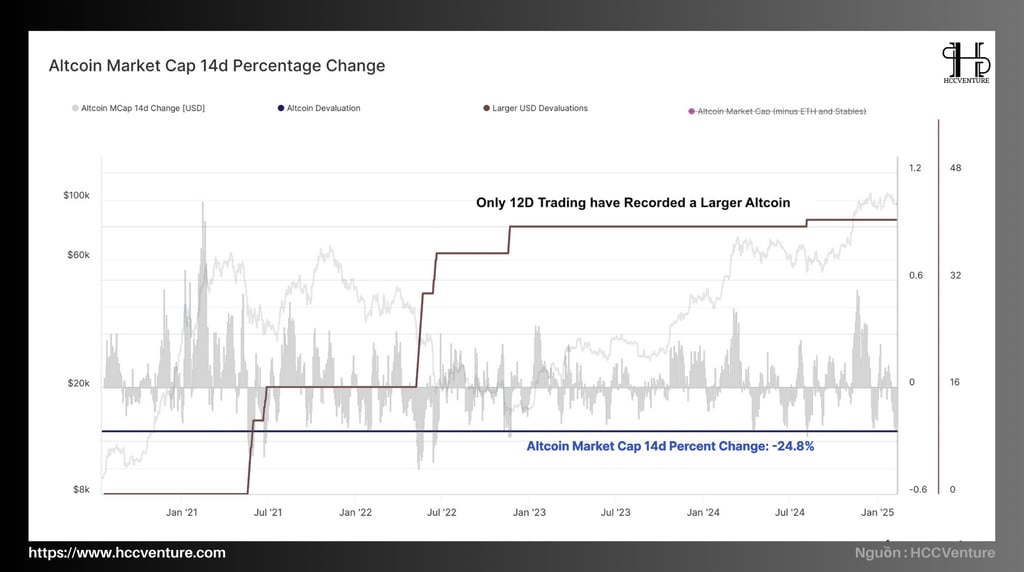
Over the past 14 days, the altcoin market capitalization has fallen by a whopping $234 billion , reflecting the magnitude of the sell-off in the digital asset space. Only a handful of previous events have recorded a larger absolute decline, underscoring the severity of this correction.
Based on the magnitude of the losses, this could be viewed as a capitulation event in the altcoin bear market , as investors lose confidence and accept to sell assets at low prices. However, it is worth noting that Bitcoin did not show similar weakness, indicating a clear divergence between BTC and the rest of the digital asset market.
We can simulate that:
If altcoin capitalization does not recover soon , this could signal a prolonged divergence cycle , where Bitcoin continues to attract capital inflows while altcoins suffer selling pressure.
Conversely, if BTC breaks the $100K - $105K resistance zone , capital flows could return to the altcoin market, improving investor sentiment.
Investors need to continue to monitor the cash flow developments in the stablecoin market , as this will be an important indicator of whether there is new capital ready to return to the altcoin market.
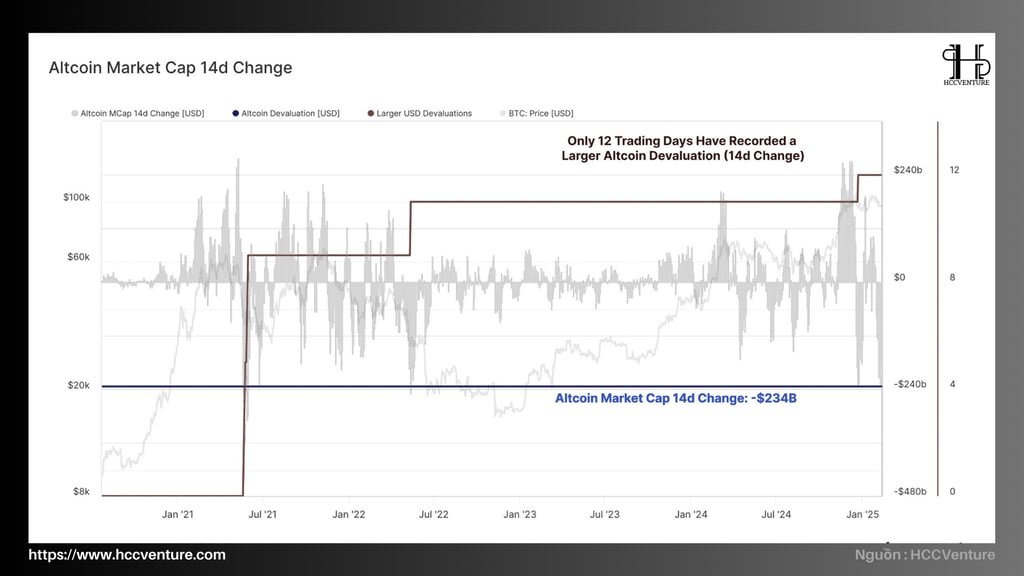
When assessing the altcoin market cap decline in percentage terms , it can be seen that this is still a strong correction , with only 41 out of 1662 trading days recording a larger decline .
This confirms the severity of the recent sell-off, but compared to previous events, this correction is still within the range of normal declines in 2024 .
It is worth noting that this drop is still significantly lower than major crashes in the past , specifically:
May 2021 - Great Miner Migration : When China banned Bitcoin mining, it caused the hash rate to plummet and dragged the entire digital asset market down.
Late 2022 - The Fall of LUNA/UST and 3AC Fund : One of the most devastating periods, causing a wave of mass bankruptcies and wiping out hundreds of billions of dollars in market capitalization.
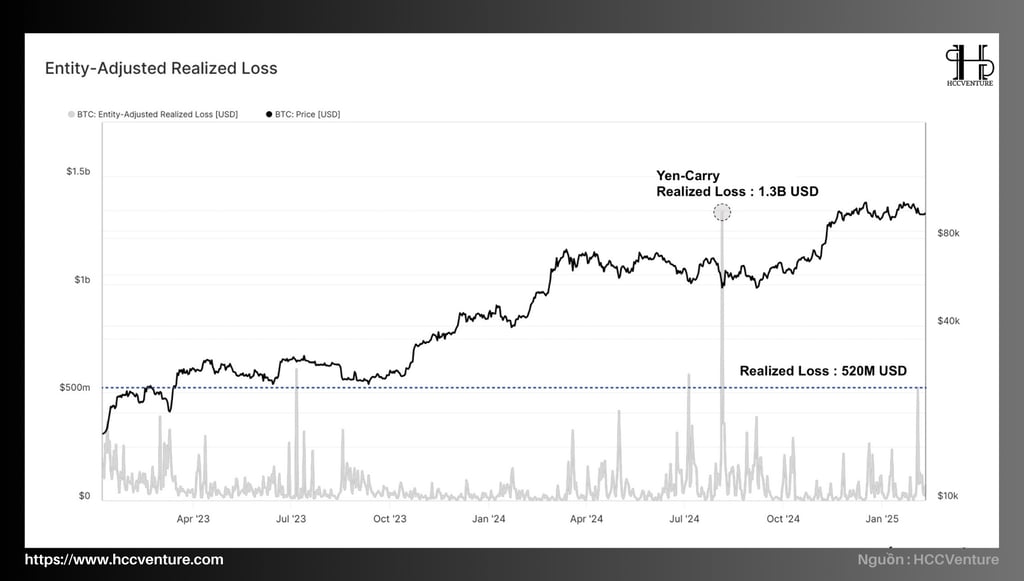
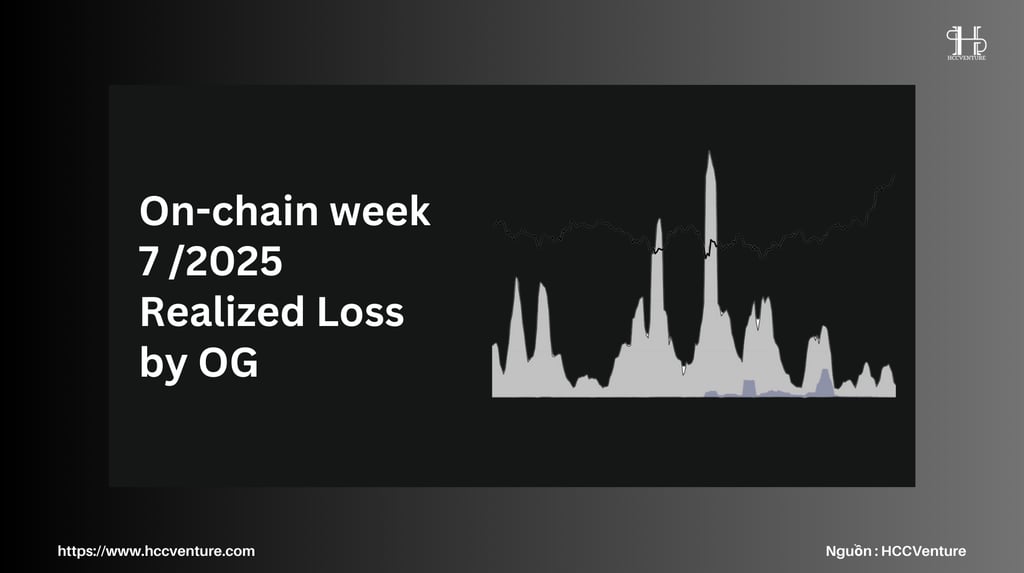
Although Bitcoin price has remained relatively stable over the past week, on-chain data shows that investors have recorded the largest Realized Losses in the current bull cycle .
Specifically, when BTC dropped to $93,000 , investors accepted losses selling with a total value of up to $520 million , marking one of the largest local sell-off events since the beginning of the cycle .
Comparison with Previous Capitulation Events
Historical data shows that this loss is second only to the event on August 5, 2023 , when the market witnessed a major collapse related to the yen-carry trade unwind , resulting in a realized loss of up to $1.3 billion in a single day .
With such a large loss, this can be considered a significant "capitulation" in a long-term bullish trend of Bitcoin.
This shows that selling pressure from short-term investors (Short-Term Holders) is still very large , especially those who bought near the top and were forced to cut losses when prices fell sharply.
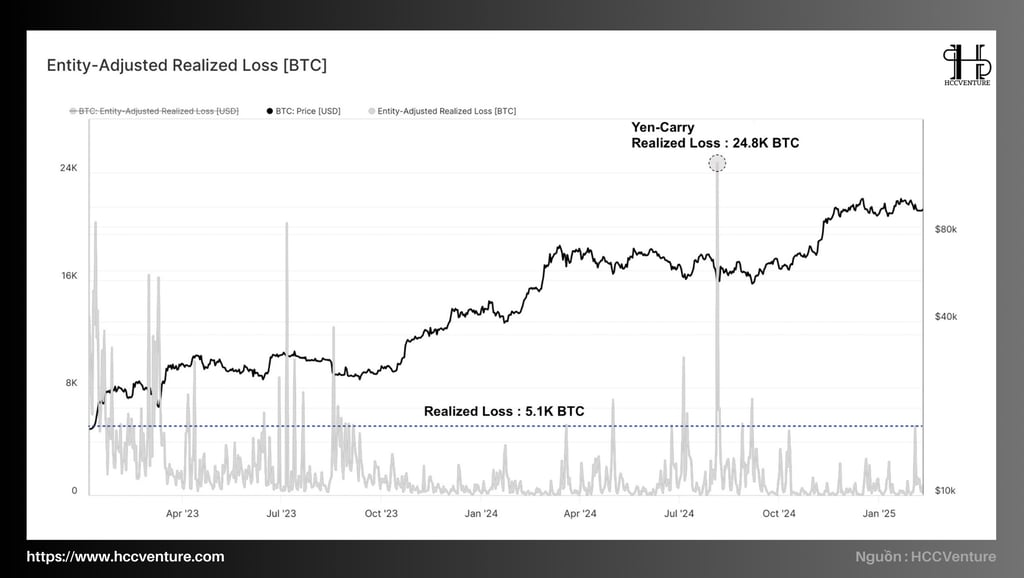
On-chain data shows that the actual loss when converted to BTC is not much different from previous adjustments in 2024 .
This indicates that, although the USD loss may seem large, the magnitude of the correction is actually within the normal range of a bull market correction/consolidation.
Investment Analysis & Strategy
BTC remains bullish if it holds above the key support level of $92,000 - $93,000. This is the average cost zone of Short-Term Holders (STH), a key indicator in a bull market.
If the price breaks this zone , selling pressure could increase as more investors fall into a losing position, pushing BTC towards deeper support levels around $80,000 - $85,000 .
If the price recovers above $100,000 - $102,000 , this could confirm that the correction is over and BTC is ready to resume the uptrend.

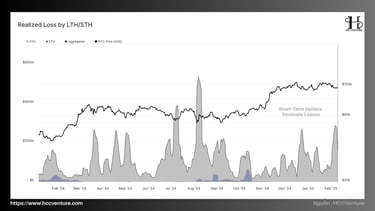
Behavior of Long-Term Holders During Price Cycles
In a bull market , long-term investors hardly record losses , because they are in a state of profit.
Profit-taking by the LTH group usually occurs when the market peaks , signaling the transition from bull market to bear market.
As the price enters a sharp downtrend, LTH begins to sell off more aggressively , especially in the late stages of a bear market, when pessimism peaks. This is when LTH's selling pressure is at its highest , marking the formation of a cycle bottom.
Short-Term Holders: The Most Price-Sensitive Group
STH groups tend to sell at a loss even in bull markets , when prices fall sharply in the short term.
Last week, STH recorded a realized loss of $520 million , showing a loss comparable to previous corrections in the 2024-2025 bull cycle.
This behavior reflects the weak hands of short-term investors, who often sell off when prices fall , while long-term investors are less affected.
Evaluation and Conclusion
The Bitcoin market has continued to see strong volatility over the past few weeks, with prices fluctuating within a wide range without a clear trend. BTC peaked at $105k, fell to a low of $93k, and finally closed around $98k – virtually unchanged from the start of the week.
This sharp move resulted in a $520 million stop loss event , which is one of the largest losses of the current cycle in USD terms. However, when assessing the severity of the drawdown using normalized drawdown indicators, the magnitude of the correction is similar to previous local corrections, suggesting that this is just a technical correction in the bull cycle , rather than a sign of a long-term downturn.
While Bitcoin shows relative strength, the Altcoin market is under strong selling pressure and has not yet found equilibrium . Most tokens recorded sharp declines, with a high correlation , showing that money is not circulating between projects but is leaving the market.
The event marked one of the most severe price drops in Altcoin history , highlighting a sharp divergence between Bitcoin and the rest of the digital asset market. This is in contrast to previous cycles , when capital typically rotated from BTC to Altcoins during periods of strong growth.
Join the HCCVenture community to get the latest market information. Once again, we give our opinion on potential projects in the crypto market. This is not investment advice, consider your portfolio. Disclaimer: The views expressed in this article are solely those of the author and do not represent the platform in any way. This article is not intended to be a guide to making investment decisions.
API & Data : Glassnode
Compiled and analyzed by HCCVenture
Join our telegram community: HCCVenture
Explore HCCVenture group
HCCVenture © 2023. All rights reserved.


Connect with us
Popular content
Contact to us
E-mail : sp_contact@hccventure.com
Register : https://linktr.ee/holdcoincventure
Disclaimer: The information on this website is for informational purposes only and should not be considered investment advice. We are not responsible for any risks or losses arising from investment decisions based on the content here.
TERMS AND CONDITIONS • CUSTOMER PROTECTION POLICY
ANALYTICAL AND NEWS CONTENT IS COMPILED AND PROVIDED BY EXPERTS IN THE FIELD OF DIGITAL FINANCE AND BLOCKCHAIN BELONGING TO HCCVENTURE ORGANIZATION, INCLUDING OWNERSHIP OF THE CONTENT.
RESPONSIBLE FOR MANAGING ALL CONTENT AND ANALYSIS: HCCVENTURE FOUNDER - TRUONG MINH HUY
Read warnings about scams and phishing emails — REPORT A PROBLEM WITH OUR SITE.