On-chain analysis week 5/2026: The market is experiencing a structural decline
Bitcoin has confirmed a structural weakness as its price plummeted from its peak near $98,000 to the $72,000 area, equivalent to an approximate 26% correction, with persistently weak spot volume.
2/12/202612 min read
Market Summary
Bitcoin has slipped below the True Market Mean – a representation of the average market cost adjusted for cyclical patterns. In previous cycles, a break below this zone typically marked a transition from an accumulation phase to a deeper correction.
Currently, the densest on-chain accumulation cost zone is concentrated between $66,900 and $70,600 , reflecting the significant supply accumulated during the previous sideways price phase. Compared to the 2022 cycle bottom when BTC traded around $15,500 and most short-term supply was deeply in a loss-making state, the current structure suggests the market is entering a highly "defensive" absorption zone , but is still subject to short-term distribution pressure.
The Realized Loss 90D MA recorded a sharp increase during the price drop from $98,000 to $72,000. Compared to the mid-2023 correction, the current rate of realized losses is significantly higher, reflecting that many investors who bought at high levels are now forced to close their positions.
A “vacuum of demand” – a genuine gap in demand. Selling pressure is present but not absorbed by sufficiently large new inflows. Compared to the recovery phase from the 2023 bottom, where volume surged when prices surpassed $30,000 , the current structure lacks the equivalent absorbing momentum.
The options skew is clearly bearish , with implied volatility remaining high and market participants paying higher premiums for short-term protection. The dealer gamma has shifted into negative territory , increasing price sensitivity as volatility widens.
Analyzing on-chain metrics
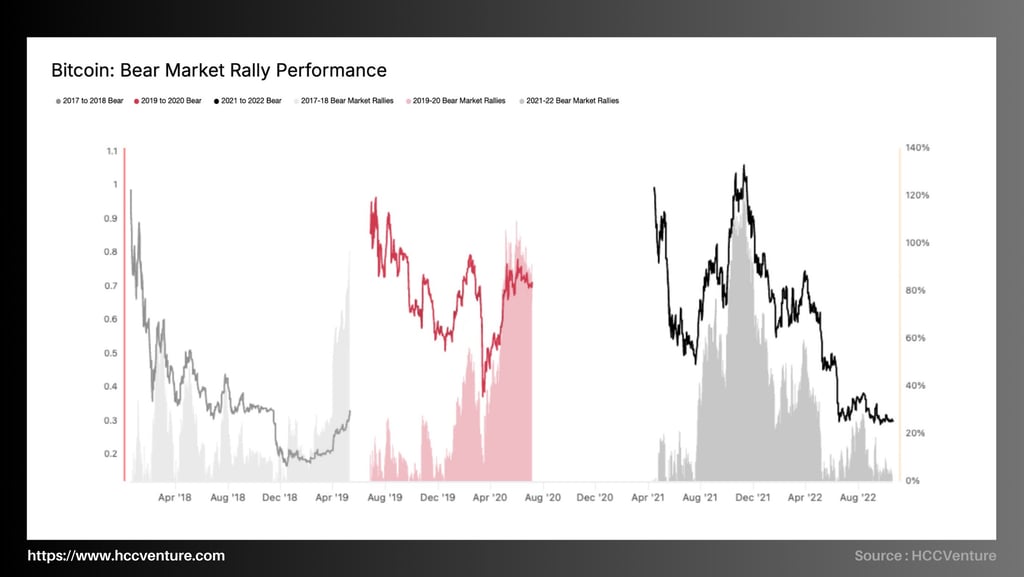
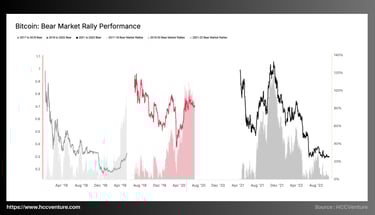
“Bitcoin: Bear Market Rally Performance” highlights the common characteristics of the 2017–2018, 2019–2020, and 2021–2022 downturn cycles . Within the dominant downtrend, Bitcoin often experiences strong technical rallies (bear market rallies) with price swings of 40%–120% , but these do not alter the long-term downtrend structure.
2017-2018 Cycle: After peaking at nearly $20,000 at the end of 2017, Bitcoin entered a downturn cycle lasting approximately 12 months, with a maximum decline of about -84% (bottom around $3,200).
2019–2020 Cycle: After a mid-cycle recovery peak around $14,000 , Bitcoin corrected to the $3,800 region during the March 2020 liquidity crisis. During this period, several rallies of 40%–70% occurred, but the overall downtrend structure remained unchanged.
2021–2022 Cycle: From a peak of $69,000 , Bitcoin fell to $15,500 (-77%) . The 2022 period saw at least three technical rebounds of over 40%, including a rebound exceeding 100% from the mid-2021 low to the late 2021 peak before the downtrend resumed.
Bitcoin recently dropped from around $98,000 to $72,000 (~-26%). While the correction isn't yet comparable to previous deep downturns, the on-chain structure shows characteristic elements of a bear market rally forming:
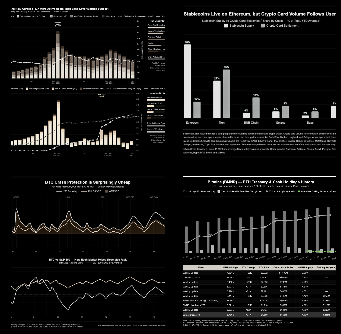
The average 30-day spot volume remains significantly lower than during the preceding breakout period.
The Realized Loss 90D MA is rising sharply, reflecting selling pressure from holders who bought at higher levels.
Funding rates in the futures market have turned neutral or slightly negative, confirming the leverage cleanup process.
ETF net flows have declined compared to the previous expansion period, eroding sustained demand support.
Compared to the lowest point of the 2022 cycle ( MVRV ~0.75 and the proportion of short-term holders supplying at loss exceeding 60% ), the current market has not yet reached an extreme capitulation state, but has entered a defensive phase as the proportion of short-term supply under loss pressure increases.
The current dense accumulation zone is around $66,900–$70,600 , forming a significant cost cluster. In comparison to the 2022 cycle, the Realized Price (GM) zone acted as resistance for several months before the trend reversed.
At this point, prices trading below structural moving averages indicate that demand is not yet strong enough to regain control. History suggests that in this context, rallies are more likely to be technical rebounds than cyclical reversals.
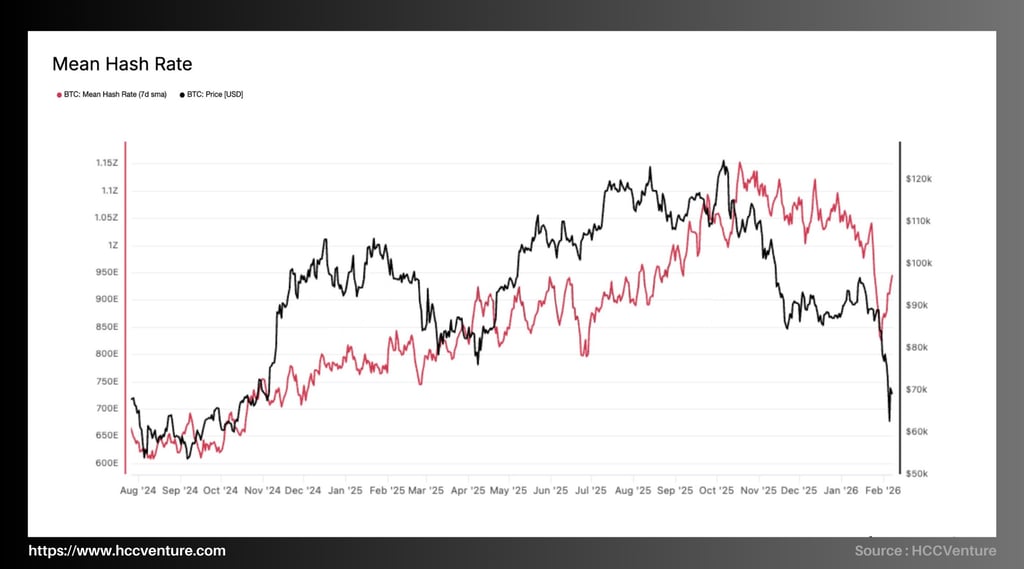
The Mean Hash Rate (7-day SMA) directly reflects the security level and capital investment intensity of the Bitcoin mining ecosystem. The latest data shows the average hashrate fluctuating around ~930–960 EH/s after adjusting from its historical peak of ~1.15 ZH/s (1,150 EH/s). Compared to the local low in August 2024 (~610 EH/s) , the hashrate has increased by over 50% , confirming that the long-term expansionary structure of the network remains intact despite short-term price fluctuations.
Given that BTC's price recently underwent a sharp correction from its peak above $120,000 to below $70,000 before recovering, the fact that the hashrate remains at historically high levels indicates that the supply structure – particularly from the miner side – is not experiencing widespread capitulation. This is of crucial importance for the sustainability of the cycle.
Historically, hashrate has typically reacted to price with a lag of 1–3 months. However, the current period shows a clear divergence, with sharp price corrections while hashrate has only decreased slightly. Compare this to the 2022 cycle:
In 2022, when prices dropped by approximately 75%, hashrate plummeted by over 25% due to miner capitulation.
Currently: the price has corrected by over 30% , but the hashrate has only decreased by about 15% from its peak.
This indicates that the current mining cost structure has been significantly optimized. Large-scale miners have restructured their debt and upgraded their machinery, resulting in lower break-even points compared to the previous cycle.
The Mean Hash Rate (HAS) remains around 930–960 EH/s after reaching a historical peak of 1.15 ZH/s, confirming that the Bitcoin network is still in its most secure and infrastructure-invested state ever. Although the price has undergone a sharp correction, the hashrate decline is purely technical and does not reflect large-scale capitulation. Compared to the 2022 cycle, the current structure is significantly more stable.
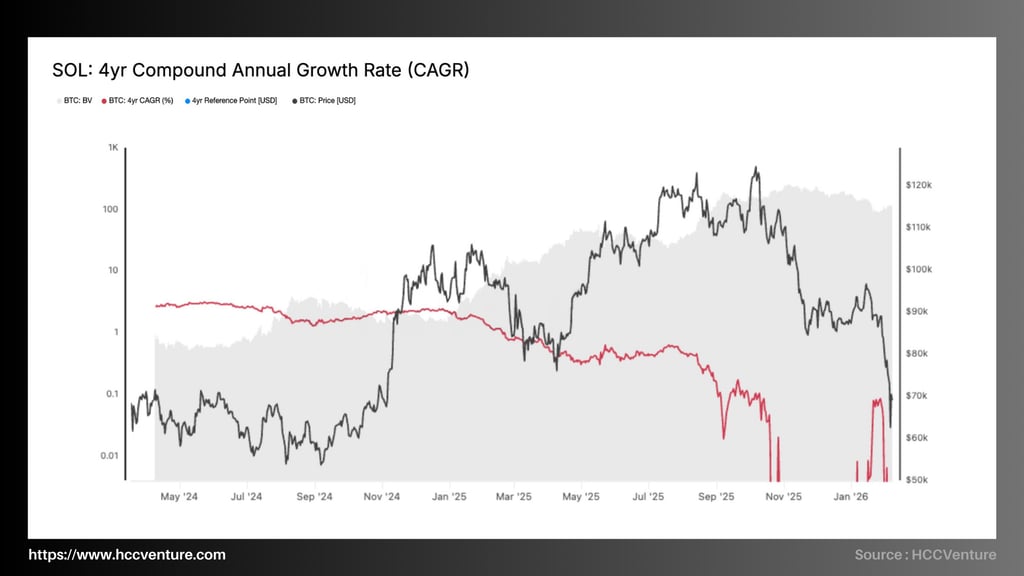
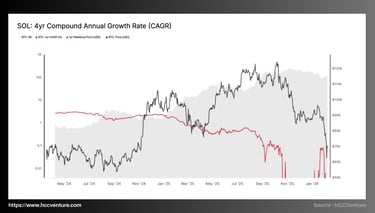
Bitcoin's 4-Year Compound Annual Growth Rate (CAGR) reflects the average compound annual growth rate over a 4-year cycle – the timeframe corresponding to the halving structure. Following a price correction from the ~$120,000 range to the ~$65,000–$70,000 range , the 4Y CAGR has fluctuated around 0–0.1, the lowest since the 2022–2023 cycle bottom. Compared to the peak growth phase of the current cycle, the compound annual growth rate has decreased by more than 95% , confirming a clear phase shift from an expansion to a contraction phase of the cycle.
From Q3/2025 , this index rapidly declined to below 1.0 , then broke through the 0.5 threshold, and at the end of 2025 even fell below 0. This means that the current price of BTC is no longer higher than the price four years ago according to the historical average growth rate.
The structure is repeating a downward price pattern from approximately $120,000 to approximately $65,000 (a drop of nearly 45%) , while the 4-year CAGR is narrowing to a neutral level. This suggests that much of the cyclical growth has been absorbed and the price has been revalued.
When prices corrected sharply to the $65,000 region , CAGR reacted almost immediately due to the calculation formula being based on a 4-year log-return. This means:
Unless prices recover strongly, the CAGR will continue to remain in low territory.
If the price re-establishes the range of $90,000–$100,000 , the CAGR will quickly recover to $0.5–$1.0.
Currently, the data structure suggests the market is in a growth revaluation phase, similar to cyclical compression phases before the formation of a medium-term bottom.
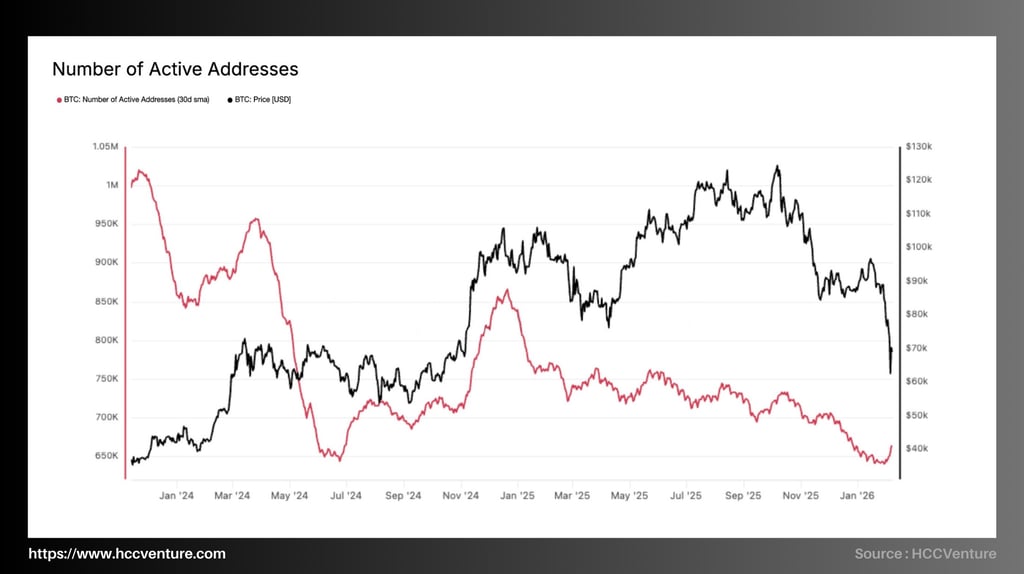
While the price of BTC has corrected from its peak of approximately $120,000 to around $65,000–$70,000 (a drop of approximately 45%), the number of active addresses has decreased by more than 35% compared to its peak in early 2025 (~850,000–880,000 addresses). This clearly confirms the weakening of the on-chain demand structure and the significant contraction in network interaction.
In early 2024, Active Addresses remained above 1,000,000 addresses (30D SMA) , reflecting strong network expansion coupled with price increases. However, by mid-2024, the index rapidly declined to approximately 650,000 addresses – equivalent to a nearly 40% decrease in just a few months.
From late 2024 to early 2025, as prices recovered to the $110,000–$120,000 range , Active Addresses increased again to approximately $850,000–$870,000. However, this recovery was significantly lower than the early 2024 peak, indicating a negative divergence between price and network activity.
Active Addresses represent the number of entities participating in transactions within the network. When this indicator drops sharply during a price correction, it reflects three main factors:
Natural demand for trading has weakened.
Speculative activity has decreased sharply.
On-chain liquidity is shrinking.
Current data shows that the decline in network activity is occurring concurrently with a decrease in spot trading volume and liquidation pressure in the futures market. This confirms that the market is not only bearish but also experiencing a decline in actual participation. Compared to the 2021 peak, when Active Addresses exceeded 1.2 million addresses , current levels are nearly 50% lower. This indicates that the current cycle expansion is significantly weaker in terms of network interaction.
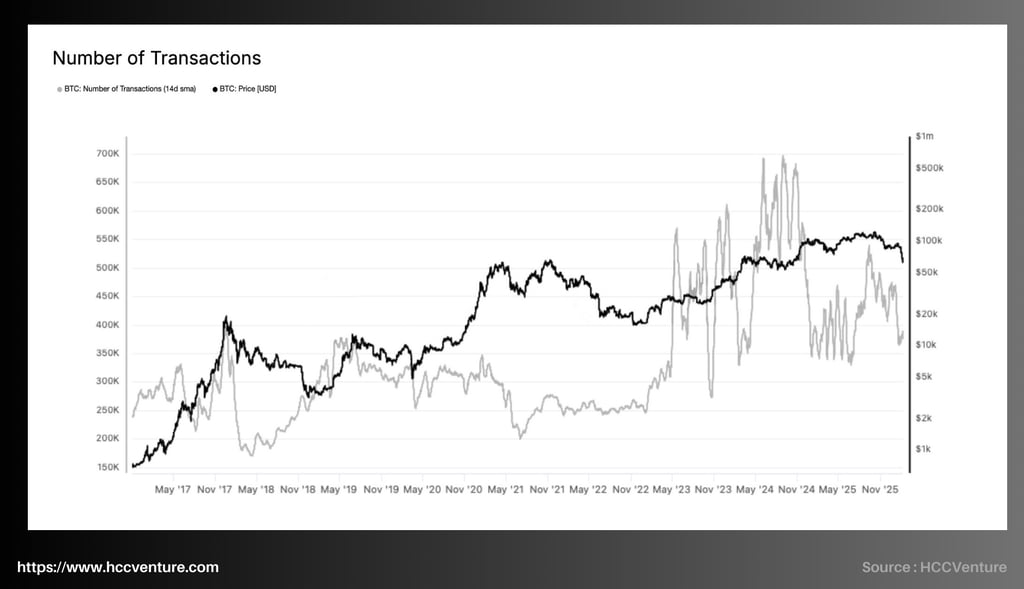
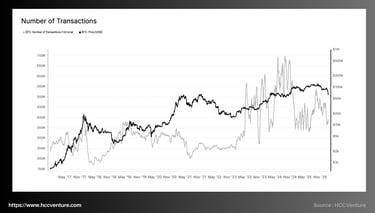
The Number of Transactions (14D SMA) is currently fluctuating around 360,000–400,000 transactions per day , down approximately 40–45% from its historical peak in 2024, but still significantly higher than previous cyclical lows.
During the 2024 expansion phase, the number of transactions surged before the price peaked, reflecting speculative capital flows, inscription activity, Ordinals, and increased demand for asset transfers. When the price surpassed $100,000 , the number of transactions reached a record high, confirming the network's overheated state.
However, since Q4 2025, the number of transactions has continuously decreased alongside price corrections. There hasn't been a surge in transactions during the recent sharp decline, indicating that the market hasn't entered a state of extreme panic, but rather a phase of shrinking demand.
Compared to previous cycles, current transaction levels remain significantly higher. This implies that the long-term user base and underlying value transfer activity are still intact. More importantly, current transaction levels remain significantly higher than historical lows. This confirms that the Bitcoin network has reached a more sustainable operational scale with each cycle. There are no signs of weakening of the network's long-term structure. Instead, this is a natural contraction phase following a liquidity peak.
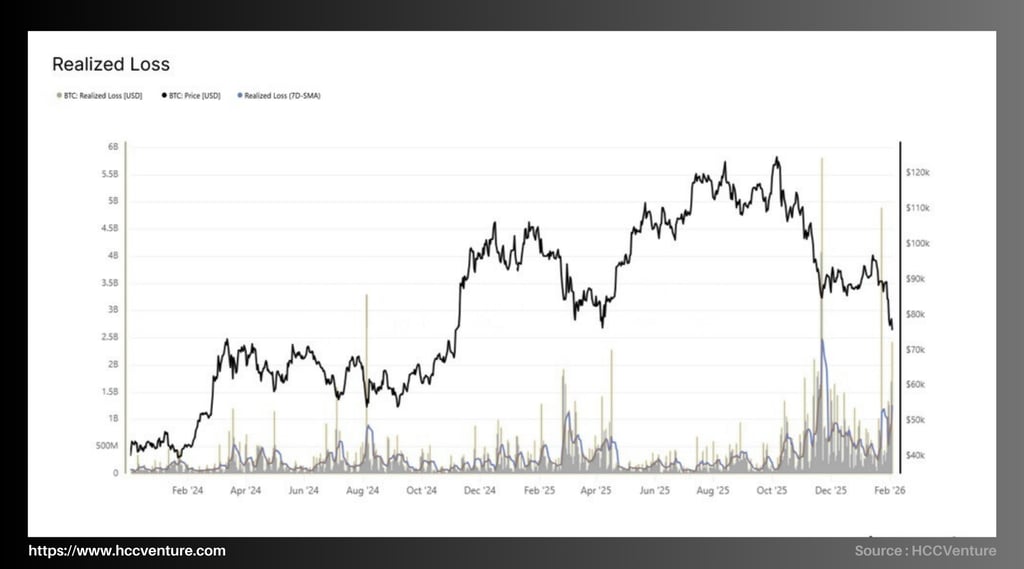
Data updated to early February 2026 shows that Realized Loss (7D-SMA) has surged to the $1.1–$1.4 billion/day range, while individual spikes have exceeded $5–$6 billion during periods of high volatility.
Compared to the expansion phase of 2024–early 2025, realized losses have increased significantly, confirming that the market is entering a forced redistribution phase as prices correct from the peak of approximately $120,000 to approximately $75,000–$80,000 , equivalent to a decrease of about 35–40% . Observing the data series from 2024 to the present shows:
During the strong bull run at the end of 2024 , Realized Loss remained below $300–400 million per day, reflecting a high-profit environment and profit-taking behavior rather than stop-loss cutting.
From Q4 2025 , Realized Loss will gradually increase to $700–900 million per day as prices begin to weaken.
In early 2026 , Realized Loss (7D-SMA) exceeded $1.2 billion per day – the highest level since the 2022 correction cycle.
Compared to the 2022 cycle low, when Realized Loss peaked at over $2–3 billion per day (after the FTX event), the current level is about 40–50% lower. This indicates systemic selling pressure, but it hasn't reached the extreme panic levels seen in structural collapse events.
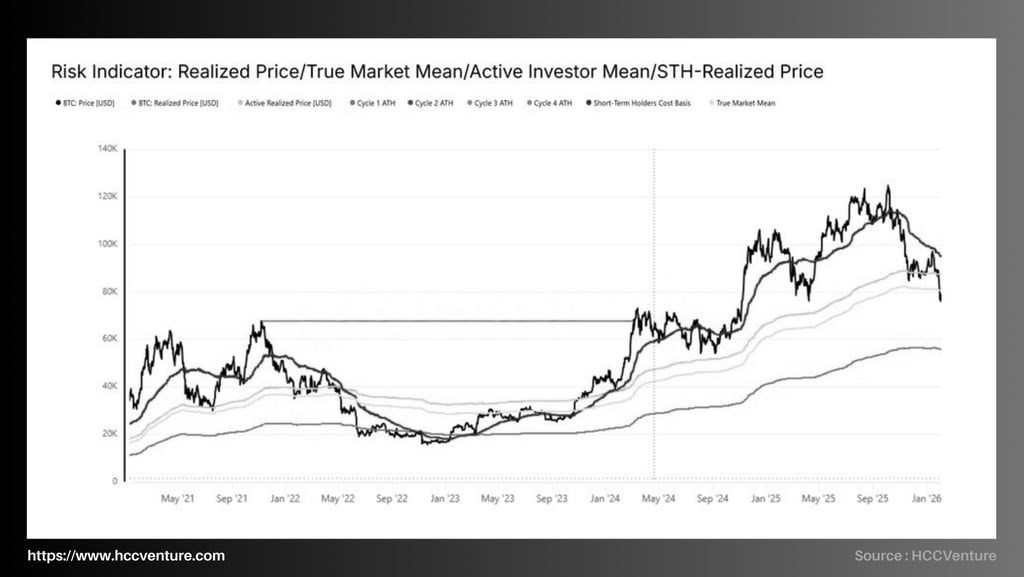

BTC has officially broken below its True Market Mean ($80,200) after failing to reclaim the Short-Term Holder Cost Basis ($94,500) . The current valuation structure confirms systemic weakness, shifting the market from a shallow correction phase to a structural decline similar to the early part of 2022.
The price is currently trading around $75,000–$78,000, below the True Market Mean and only about $20,000 away from the Realized Price (~$55,800) . A clear medium-term price range has been established with a resistance ceiling at $80,200 and a structural bottom at $55,800.
The True Market Mean represents the average cost of the actual circulating supply, excluding lost coins, Satoshi-era coins, and non-circulating early-mined coins. Throughout the 2024–2025 correction phase, this line will serve as the final pillar of the price structure.
From March 2024 to November 2025, each time the price approached the True Market Mean, there was demand to absorb it.
Currently, the price has broken below $80,200 and there hasn't been a strong enough rebound to reclaim this structure.
This event confirms a cyclical downturn, similar to Q1/2022 when BTC lost its medium-term Realized Price before entering a deeper decline phase. The gap between the current price (~$76,000) and the STH Cost Basis (~$94,500) is nearly $18,000, equivalent to a negative ~19%. This is the largest discount of the 2024–2026 cycle to date.
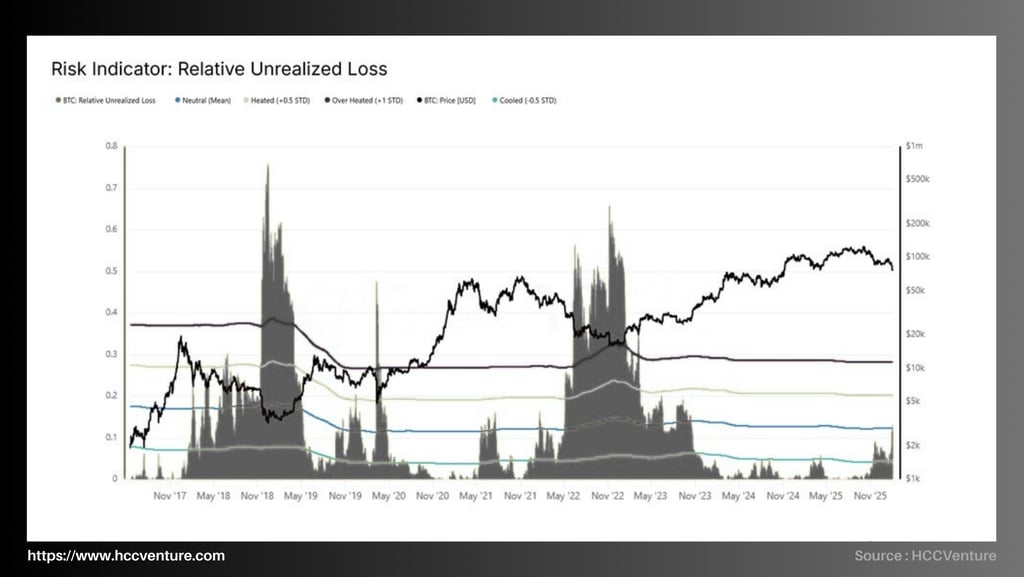
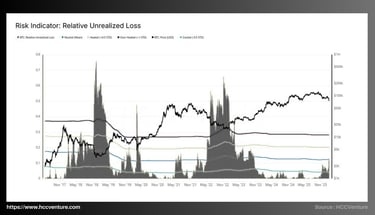
Relative Unrealized Loss (RUL) has risen above its long-term cyclical average ( ~12% ), confirming increasing pressure for unrealized losses across the system. However, current stress levels remain significantly lower than the historical peaks of 2018 and 2022, when the index entered the 65%–75% market capitalization range.
BTC is trading around the $74,000–$78,000 range, while the Realized Price is hovering around $55,800. This suggests that despite increasing pressure, the market has not yet reached the extreme " dislocation " state seen at previous cycle bottoms.
The RUL exceeding the mean by 12% confirms that a large amount of supply is being held at a cost basis higher than the spot price. This is particularly relevant to the group of short-term holders who bought in the $90,000–$110,000 range.
Statistically, RUL levels above +1 standard deviation ( ~30% ) typically signal an accelerated sell-off phase. Currently, this indicator remains below that threshold. Therefore, the market is in a phase of increasing pressure but has not yet reached an " exceptional dislocation " state. In previous cycles, approaching or touching the Realized Price was associated with extreme RUL levels.
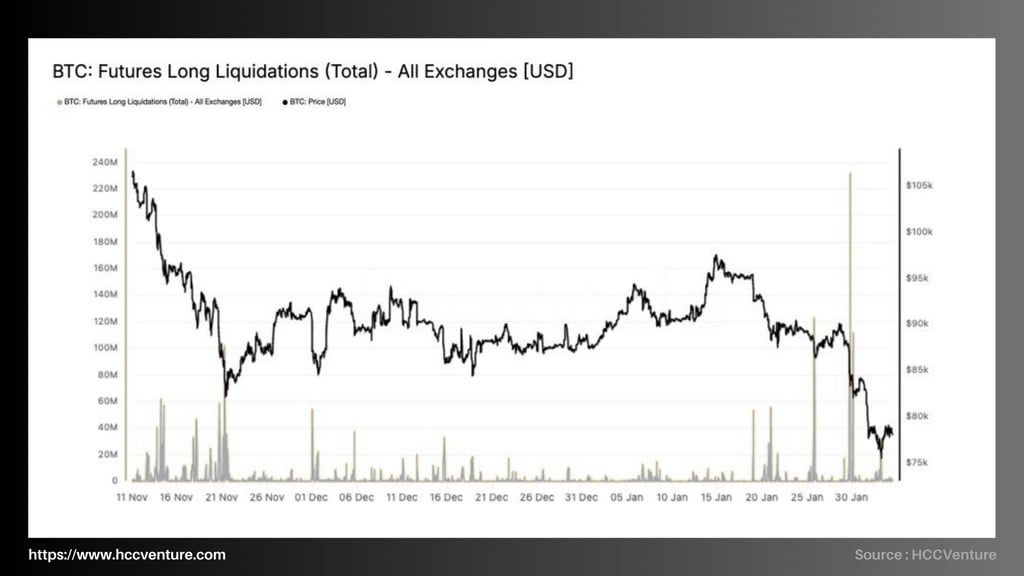
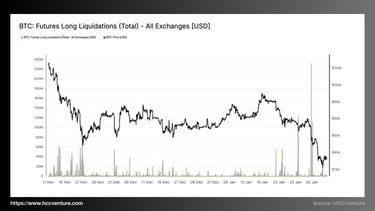
The derivatives market witnessed the largest long liquidations during the entire current correction , with the total value of liquidations across all exchanges exceeding $230–250 million in a single session, marking the highest level since BTC began weakening from the $98,000 region to the mid- $70,000 area .
Throughout November and most of December, long liquidation remained low , averaging only $10–30 million per session, even though prices failed to create a new, sustainable peak. This suggests:
Leverage is being gradually rebuilt amidst weakening spot volume .
Funding rates remain neutral to slightly positive.
Open interest accumulates again in an environment where the immediate demand is not strong enough.
This imbalance created conditions for a liquidity shock when prices broke through short-term support structures around $90,000 and then $85,000. In the most recent sharp decline, total long liquidations in USD reached over $230 million , the highest level during this entire correction and approaching the spikes recorded during the sharp drops of 2023–2024.
Compared to the previous lowest point in the current cycle (when liquidations amounted to only a few million USD per day), the current level is more than 10 times higher. This confirms that the market has shifted from a passive weakening phase to an active forced deleveraging phase .
Our market analysis
Bitcoin has officially entered a medium-term defensive regime after losing the True Market Mean around $80,200 and repeatedly failing to reclaim the cost basis of Short-Term Holders (STH) around $94,500. This development confirms the structural weakness that has accumulated since the end of Q4, when unrealized gains narrowed and realized losses increased sharply during the dip to the lows of $70,000.
The True Market Mean (~80,200 USD) represents the aggregate cost basis of actively circulating supply, excluding lost or long-term inactive coins. Throughout the previous shallow correction phase, this level served as crucial structural support.
The decisive price break below $80,200 confirms that active supply is currently at a loss, medium-term accumulation momentum is weakening, and the market is shifting from a range-compression phase to an extended downtrend. Compared to the cyclical peak above $120,000, the current price is more than 35% lower, and is only about $15,000–$20,000 away from the Realized Price ($55,800). This indicates that the defensive margin is narrowing.
Disclaimer: The information presented in this article is the author's personal opinion in the field of cryptocurrency. This is not financial or investment advice. All investment decisions should be based on careful consideration of your personal portfolio and risk tolerance. The views expressed in this article do not represent the official stance of the platform. We recommend that readers conduct their own research and consult with experts before making any investment decisions.
API & Data : Glassnode
Compiled and analyzed by HCCVenture
Join the HCCVenture organization here: https://link3.to/holdcoincventure
Explore HCCVenture group
HCCVenture © 2023. All rights reserved.


Connect with us
Popular content
Contact to us
E-mail : sp_contact@hccventure.com
Register : https://linktr.ee/holdcoincventure
Disclaimer: The information on this website is for informational purposes only and should not be considered investment advice. We are not responsible for any risks or losses arising from investment decisions based on the content here.
TERMS AND CONDITIONS • CUSTOMER PROTECTION POLICY
ANALYTICAL AND NEWS CONTENT IS COMPILED AND PROVIDED BY EXPERTS IN THE FIELD OF DIGITAL FINANCE AND BLOCKCHAIN BELONGING TO HCCVENTURE ORGANIZATION, INCLUDING OWNERSHIP OF THE CONTENT.
RESPONSIBLE FOR MANAGING ALL CONTENT AND ANALYSIS: HCCVENTURE FOUNDER - TRUONG MINH HUY
Read warnings about scams and phishing emails — REPORT A PROBLEM WITH OUR SITE.