


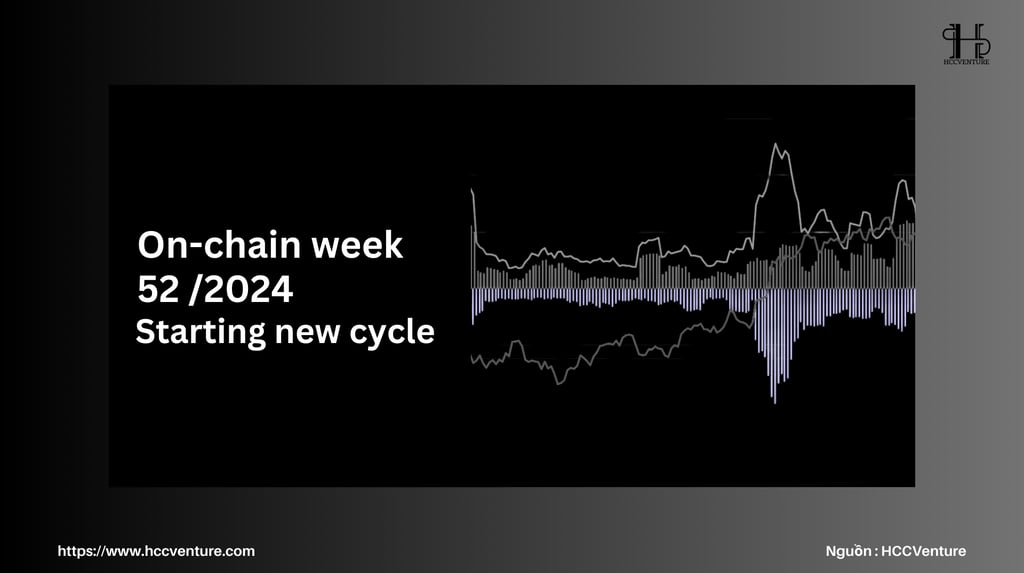
On-chain Analysis Week 52 / 2024 : Bitcoin's New Cycle is Forming
Since Bitcoin’s ATH at $107,000, there has been distribution right at this peak and long-term investors have started to take profits from the recent bull market, with profits they were able to achieve over 80% from Bitcoin. This distribution at the peak has caused Bitcoin to move to the price zone around $95,000.
12/31/20246 min read
Summary
Bitcoin has corrected 10% since the ATH price zone, this correction comes from the redistribution and profit-taking side of previous long-term investors, depending on market factors, the current correction is moderate.
A striking degree of similarity can be seen in Bitcoin price trajectories across previous cycles despite vastly different market sizes, investor compositions, and market structure dynamics.
While long-term investors continue to collect the Bitcoin they just distributed at the ATH zone, short-term investors start to sell their stocks with fear of Bitcoin correcting at this price zone. This is shown by the MVRV of short-term investors showing a sharp downward trend.
Meanwhile, the output profit ratio started to decline gradually at the previous level of 1.03 in March this year, which shows that an adjustment trend is happening for the next new growth cycle.
To get an overview of how the cryptocurrency market and Bitcoin are moving, let's take a look at on-chain metrics with HCCVenture to see how Bitcoin's next correction will affect the entire market.
On-chain metrics analysis
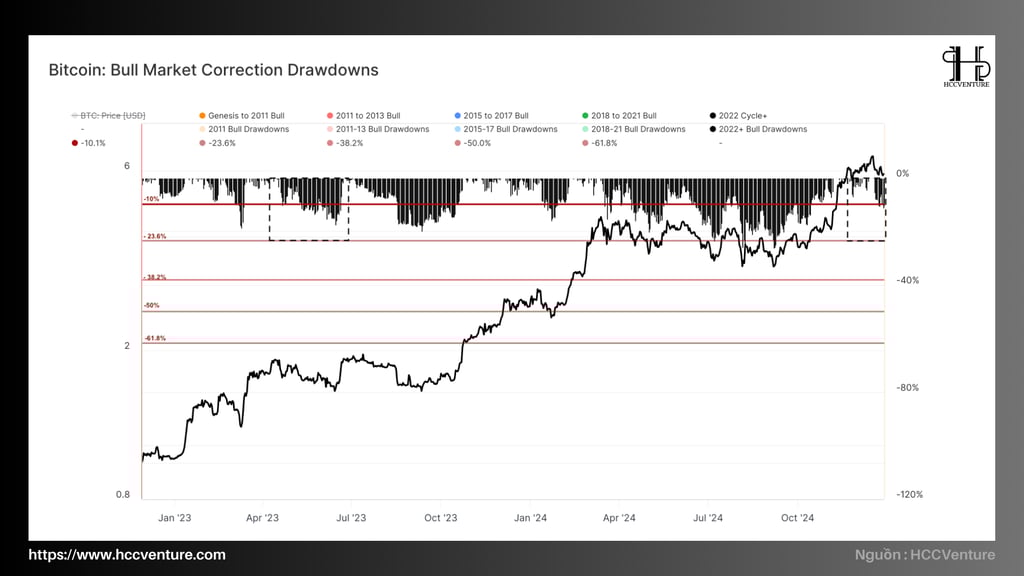
Since January 2023, Bitcoin has grown more than 568% from the $16,000 price zone. During this process, Bitcoin has had consecutive corrections when setting new ATHs. Notably, these declines only stopped around 10-20% compared to the local peak, showing strong support from buyers and a positive supply-demand balance.
If we look more closely, before each strong price increase, Bitcoin adjusted to around -10% and grew rapidly, in which:
Q3 - 2023: Decrease ~15% then grow ~91%
Q1 - 2024: Decrease ~13% then grow ~92%
Q3 - 2024: Decrease ~23% then grow ~46%
Q4 - 2024 : Decrease ~11% and there are distribution signals to continue growth, expected to increase 20-30% from the current price range.
Compared to previous cycles, this decline is considered relatively mild. For example, in previous growth cycles, Bitcoin often experienced corrections with declines of at least 25%, sometimes even exceeding 50%.
Bitcoin growth always requires periods of price reduction and distribution, so price drops of over 10% at ATHs are relatively positive signals for long-term investors.
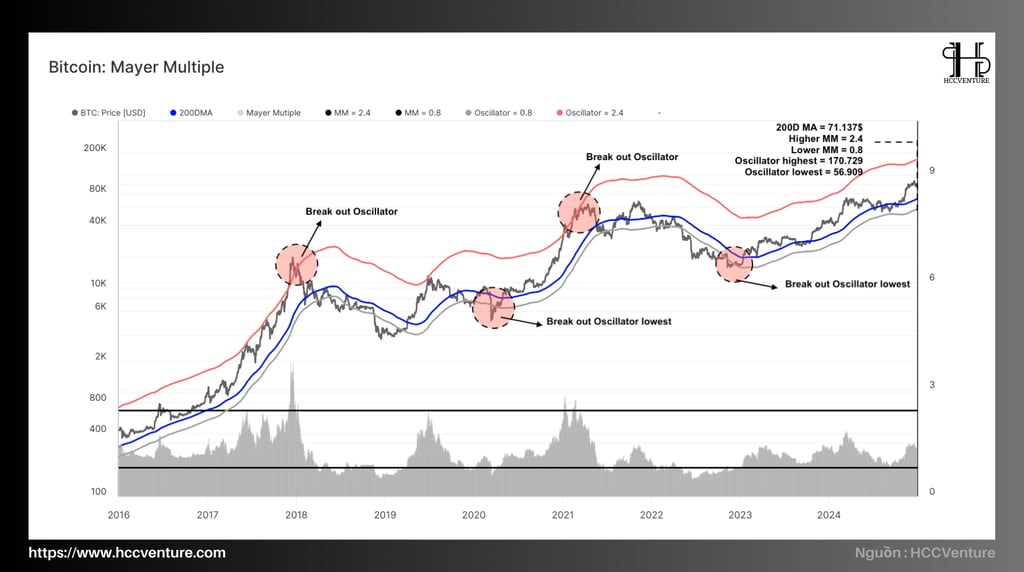
The Mayer Multiple is a technical analysis tool used to assess the relative value of Bitcoin compared to its history. It is calculated by dividing the current Bitcoin price by its 200-day moving average (MA200).
Mayer Multiple < 1: Bitcoin price is trading below its 200-day moving average, which could indicate that the market is in a correction phase or there could be additional selling pressure.
Mayer Multiple > 1: Bitcoin price is trading above its 200-day moving average, which could indicate the market is in a bull run or possibly in a bubble.
Currently, Bitcoin's Mayer Multiple value is at 1.31, this period shows that Bitcoin is at a relatively high growth rate. Previously, in 2018, 2019 and 2021, there were periods when this index grew to 2.4, which shows that the current period is only at an average level.
However, it should be noted that when Mayer Multiple > 1.3 , Bitcoin may be in an overbought phase or may be in a bubble. Investors should be cautious and may consider selling part of the profits.

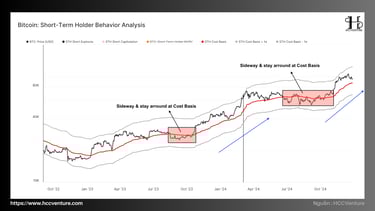
STH Cost Basis is the average price at which short-term investors (STH) have purchased Bitcoin. In other words, it is the average price at which investors have paid to own Bitcoin over a period of less than 155 days. If the current price is lower than the STH Cost Basis, it means that STH is making a loss and may be forced to sell.
Bitcoin's growth in 2024 has created a period of price range around the STH cost Basis, showing that short-term investors have suffered losses and are forced to exit, but after that period, Bitcoin has set a new ATH at 107 thousand USD.
However, the current correction of BTC at ATH is shaking the psychology of short-term investors as the current value of BTC is approaching the STH Cost Basis average line.
STH Cost Basis will change as new STH transactions occur. If Bitcoin price increases, the new STH Cost Basis will be higher. Conversely, if Bitcoin price decreases, the new STH Cost Basis will be lower.
To gain momentum, Bitcoin will have to touch the psychological zone of short-term investors, this can be seen as a psychological trick of the creator to force STH to distribute some of the BTC they are holding.
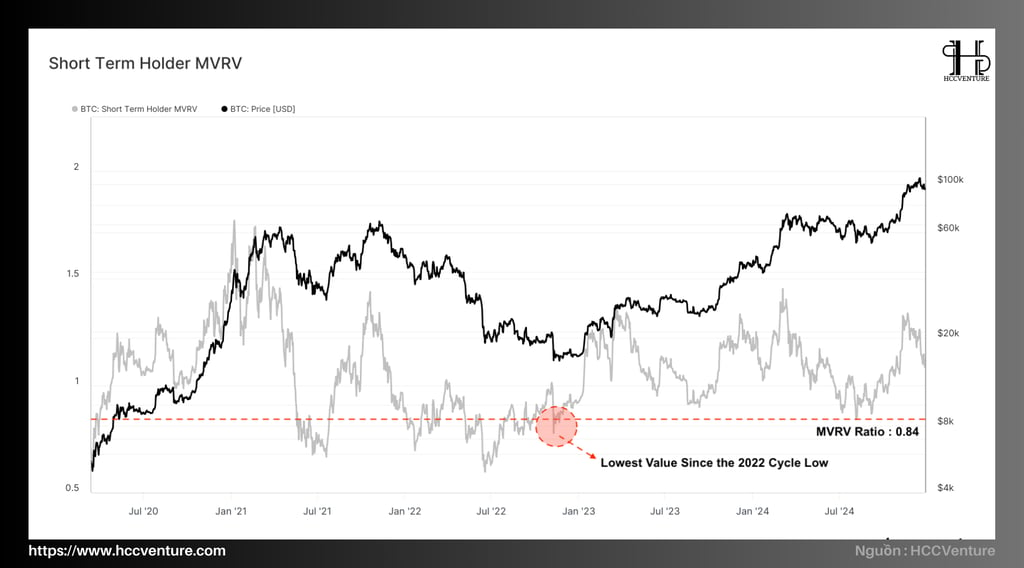
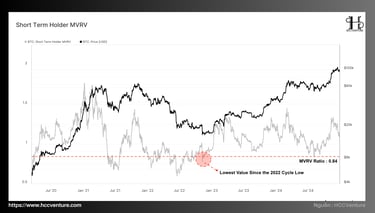
STH's MVRV (Market Value to Realized Value) compares the current market value of Bitcoin that short-term investors (STH) are holding to the original price at which they purchased it.
The MVRV of short-term investors is currently on a downward trend as soon as it rises to 1.3, which shows that the short-term investors' selling sentiment is happening, STH is in a loss and may continue to hold or sell off, causing selling pressure.
However, there is currently a tendency to adjust to near level 1, this is the break-even point for short-term investors, if Bitcoin moves down to around 89-90 thousand USD, they will break-even, this proves that there are many buy orders placed in this price range, creating a relatively strong support zone.

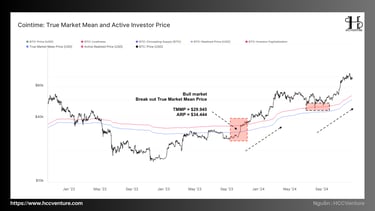
True Market Mean Price is the average price at which all Bitcoins purchased on the secondary (non-mined) market were purchased.
Active Investor Price is the average price of Bitcoins purchased by investors who are actively trading during the current market cycle.
Currently, since the secondary market price at which investors placed orders for Bitcoin around the $40,000 price range, the current Bitcoin price has grown by more than 100% compared to the previous purchase price. This clearly shows that long-term investors have made a relatively large profit from placing orders for Bitcoin around this price range, but the distribution and profit-taking volume of Bitcoin is only around $2 billion this week.
Currently, Bitcoin is relatively far from the two price indexes above, so it can be assessed that Bitcoin still has growth potential in 2025. It can be seen that the current fluctuations will end a Bitcoin cycle in 2024 and open a new cycle in 2025.
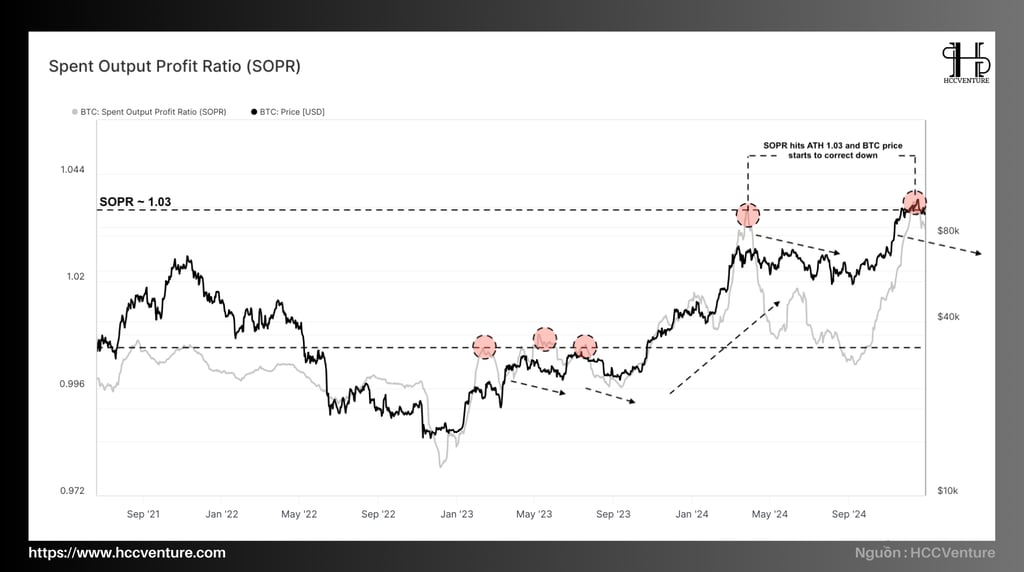

Next, analyze the average price behavior of bitcoin holders using the SOPR index, which measures the average rate of return that spent bitcoins generate.
Currently in 2024, the SOPR index has touched its ATH twice at ~1.03, after which Bitcoin price had a 10-15% correction period at ATH and went sideways for a while before exploding again, we can see in December the SOPR index continued to touch 1.03 and then had a ~10% correction.
When the SOPR index is higher than 1, it shows that users are holding Bitcoin at a high profit compared to the initial purchase price, which shows that they are still holding Bitcoin at a much lower price.
Evaluation and Conclusion
Bitcoin has had a year full of prosperity and strong fluctuations, continuously setting ATH, growing from the price range of 16 thousand USD to 107 thousand USD, Bitcoin has grown more than 568% in 2024, a large profit for long-term investors with wallet addresses holding Bitcoin for more than 6 months.
However, in the current period since the ATH at 107 thousand USD, the profit-taking of these investors has not been really much, and the distribution of Bitcoin is only at an average level, investors are looking towards a price higher than the current value in 2025.
On the other hand, short-term investors have rotated their investments but by the end of 2024, STH investors are slowly returning to break-even with their Bitcoin order value around $88k to $95k.
In terms of current psychology, the distribution belongs to LTH but the sell-off and fear of Bitcoin falling below $80k comes from short-term investors, however, they do not hold large amounts of Bitcoin so the current adjustment of Bitcoin is a stepping stone for further growth in 2025.
For the ~10% drop at the current ATH, Bitcoin could move sideways in the price range with a wide side of $8-10k, however the next growth could be 20-30% from the current price, which would be a good time for long-term as well as short-term investors to book their profits.
So, at the end of the last week of 2024, Bitcoin has had a strong growth path with the 4th Halving event, Bitcoin will continue to move sideways to find growth potential in 2025, a new cycle and a new loop of the market is gradually forming.
Join the HCCVenture community to get the latest market information. Once again, we give our opinion on potential projects in the crypto market. This is not investment advice, consider your portfolio. Disclaimer: The views expressed in this article are solely those of the author and do not represent the platform in any way. This article is not intended to be a guide to making investment decisions.
API & Data : Glassnode
Compiled and analyzed by HCCVenture
Join our telegram community: HCCVenture
Explore HCCVenture group
HCCVenture © 2023. All rights reserved.


Connect with us
Popular content
Contact to us
E-mail : sp_contact@hccventure.com
Register : https://linktr.ee/holdcoincventure
Disclaimer: The information on this website is for informational purposes only and should not be considered investment advice. We are not responsible for any risks or losses arising from investment decisions based on the content here.
TERMS AND CONDITIONS • CUSTOMER PROTECTION POLICY
ANALYTICAL AND NEWS CONTENT IS COMPILED AND PROVIDED BY EXPERTS IN THE FIELD OF DIGITAL FINANCE AND BLOCKCHAIN BELONGING TO HCCVENTURE ORGANIZATION, INCLUDING OWNERSHIP OF THE CONTENT.
RESPONSIBLE FOR MANAGING ALL CONTENT AND ANALYSIS: HCCVENTURE FOUNDER - TRUONG MINH HUY
Read warnings about scams and phishing emails — REPORT A PROBLEM WITH OUR SITE.