


On-chain analysis week 51: Counter-reaction, reverse cash flow
Bitcoin continues to trade above the key $100k price level, supported by steady inflows. Long-term investors are taking advantage of this liquidity to distribute supply on a massive scale, reaching an all-time high (ATH) in profits of $2.1 billion.
12/19/20248 min read
Market Summary
Bitcoin continues to show remarkable similarities in price trajectories across previous cycles, despite significant differences in market size, investor composition, and market structure dynamics. This demonstrates the consistency and repeatability of the digital asset’s price behavior, even as market conditions change.
Over the past few weeks, Bitcoin price has remained above the psychologically important $100k level. Long-Term Holders have taken advantage of this opportunity to distribute supply into new demand. This has led to an all-time high in realized profits (ATH), surpassing $2.1 billion.
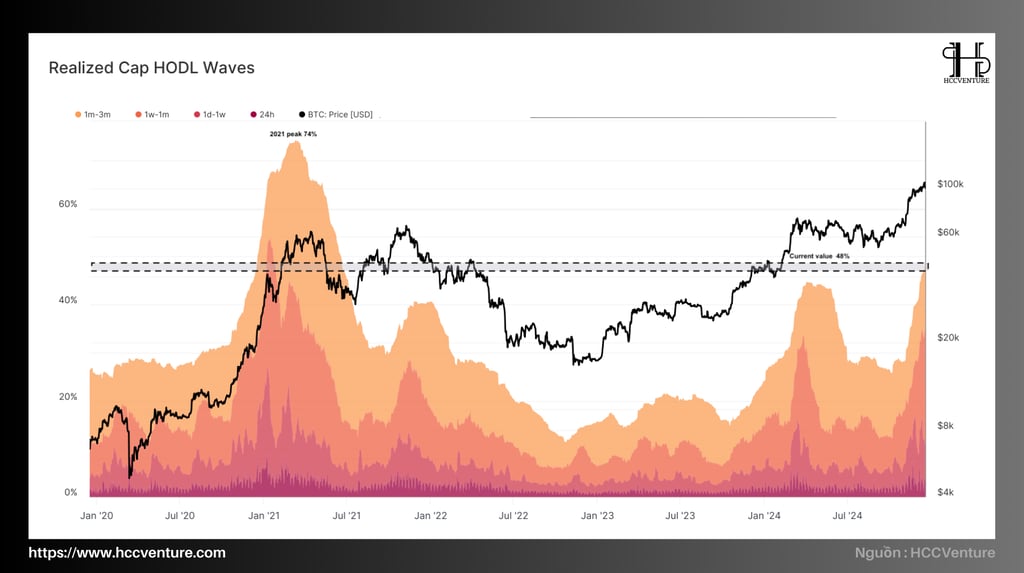
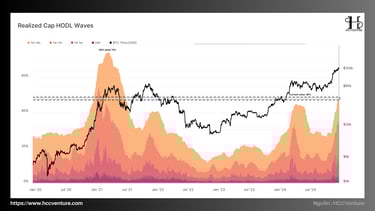
Notably, the majority of realized profits come from coins that are between 6 and 12 months old. Meanwhile, coins that are older (over 12 months) are still relatively "dormant", with little change in trading activity. This suggests that the majority of profits come from medium-term investors, rather than long-term investors.
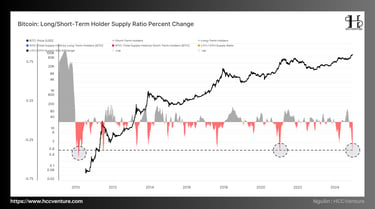
Additionally, the proportion of network assets held by new investors has increased sharply, reflecting strong market demand and new investor participation. However, this trend also indicates a shift in the balance of assets away from long-term investors (HODLers) and towards new investors. This could have implications for price stability, as assets become increasingly concentrated in the hands of short-term and less experienced investors.
On-chain metrics analysis
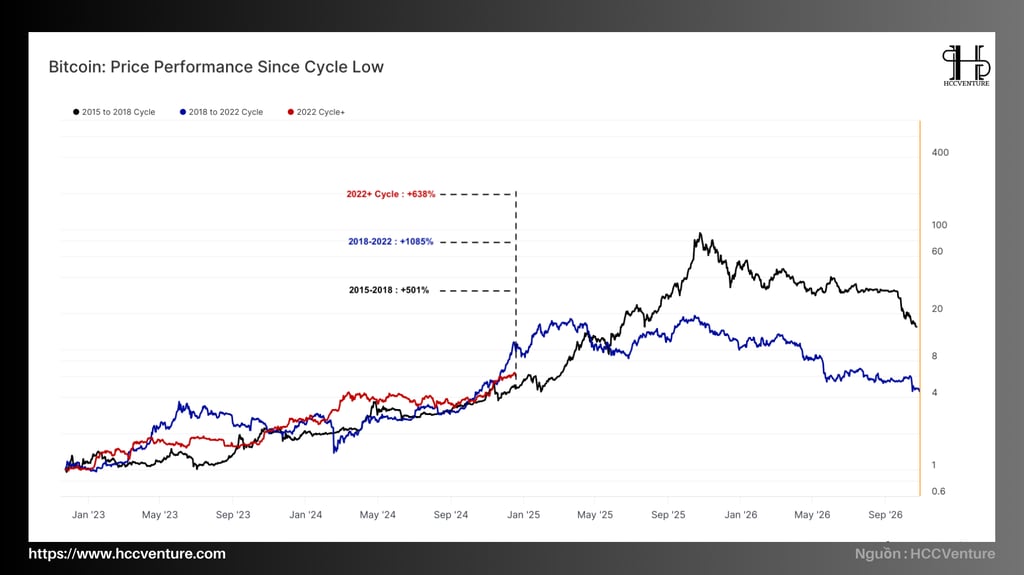
2024 continues to be an impressive year for Bitcoin, with year-to-date returns exceeding 150%. BTC price has surpassed $100,000 in a matter of weeks, showing strong growth and great confidence from investors.
When comparing price performance across cycles, we see that the current cycle has many clear similarities to the 2015-2018 and 2018-2022 cycles.
Cycle 2015-2018 : Increase +501%.
Cycle 2018-2022 : Increase +1085%.
Cycle 2022+ : Up +638%.
While the growth rate of the 2022+ cycle is lower than that of the 2018-2022 cycle, it is still significantly higher than that of the 2015-2018 cycle. This is especially noteworthy considering that Bitcoin's market capitalization in the current cycle is many times larger than in previous cycles.
Bitcoin still shows long-term growth potential, although subsequent growth cycles may find it difficult to maintain the high growth rates seen in the past due to its already huge market capitalization.
Comparisons with previous cycles not only show a repeating pattern in Bitcoin's price history, but also reflect the maturation of the cryptocurrency market as a whole.
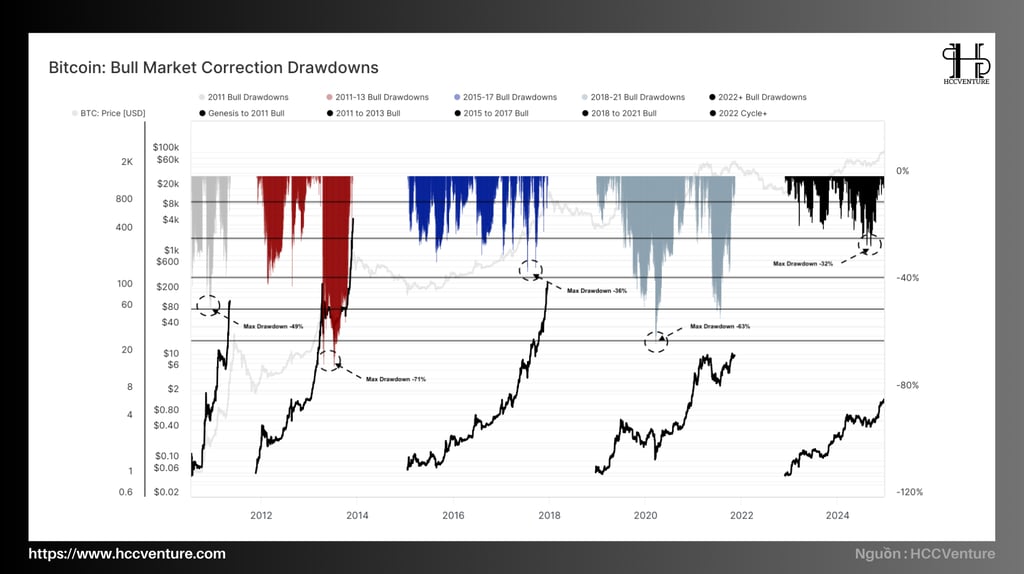

Interestingly, the severity of the price declines during each Bitcoin bull cycle has decreased as the market has matured, although selling pressure has typically been high during periods of strong price increases.
In the current cycle, the deepest recorded drop was -32% on August 5, 2024. However, the majority of the drops have only taken Bitcoin down -25% from its local peak, making this cycle one of the lowest volatility cycles ever. This is a notable point when compared to previous cycles, where corrections were often much deeper, sometimes exceeding -50% drops .
This reduction in volatility may reflect a significant increase in demand from spot ETFs, which are due to launch in early 2024, but also growing interest from institutional investors. Large institutions with deep pockets have provided greater liquidity, helping to mitigate the impact of market sell-offs.
Additionally, the current market structure has also been reinforced by factors such as the growing popularity of long-term Bitcoin holdings, with a large proportion of Bitcoin being withdrawn from exchanges and stored in cold wallets. This reduces the available supply on the market, contributing to price stability.
In the history of price corrections, the two deepest declines in the current bull cycle occurred in August 2023 and September 2024. Both periods are characterized by extreme market pressure, with high risks leading to fear and the potential for accelerated sell-offs, causing even greater losses.
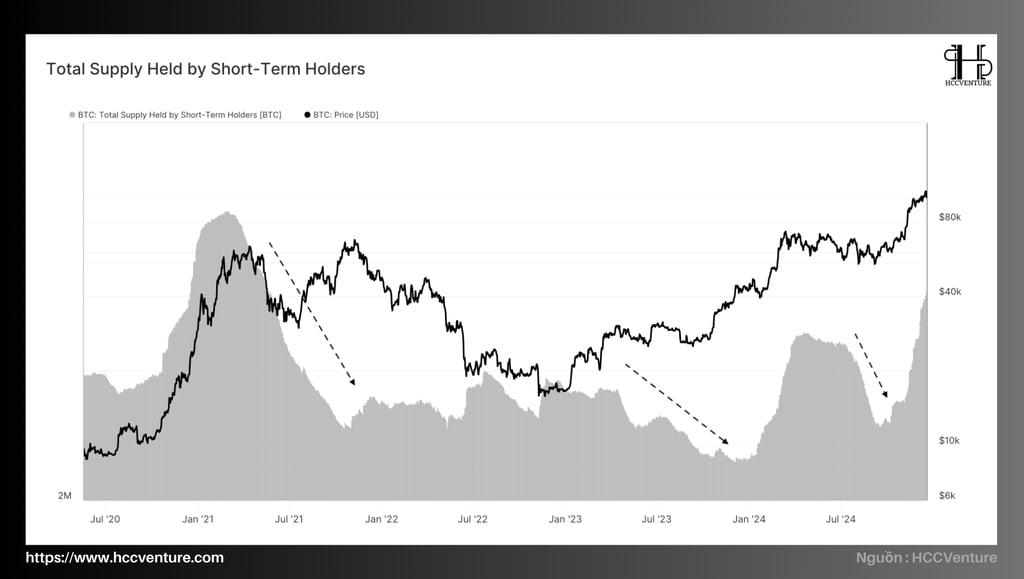
To better visualize this, we can use figures related to the Short-Term Holder (STH) group , which is often considered a proxy for new market demand. According to previous research on “Seller Exhaustion”, the STH group is often the main source of realized losses during bull phases, providing information about the market’s risk concentration (top-heaviness).
August 2023 :
This period saw a sharp decline in price, with a large proportion of STHs facing unrealized losses. This created strong selling pressure, threatening to push the price further down.
However, the market has demonstrated resilience, with supporting factors such as strong supply absorption from Long-Term Holders (LTH).
September 2024 :
Once again, the market faced similar pressure, as the majority of the STH supply fell into a loss-making state.
The notable difference is that the intervention from spot ETFs and the strong participation of large institutions have helped to minimize the impact of selling pressure, strengthening market confidence.
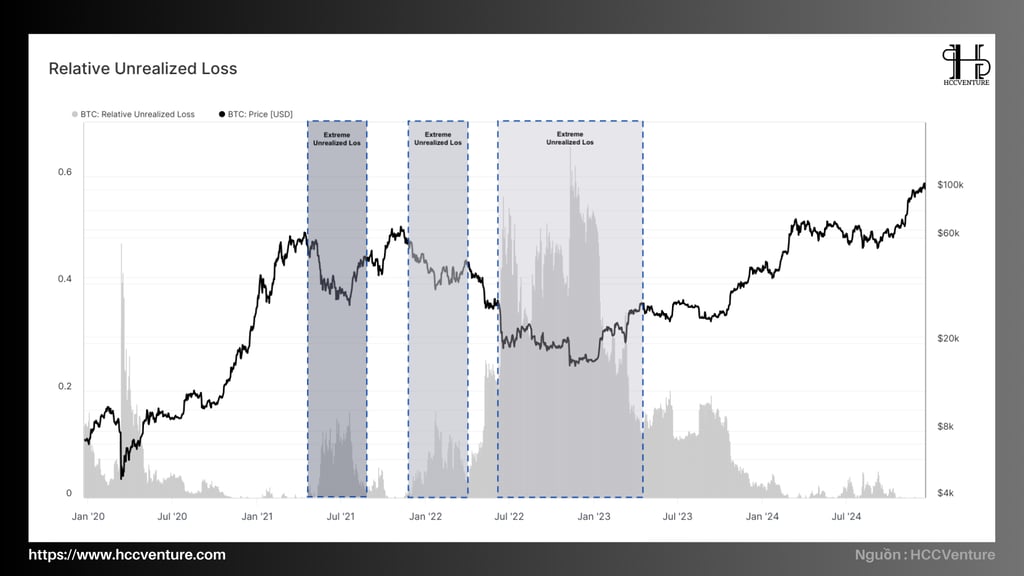
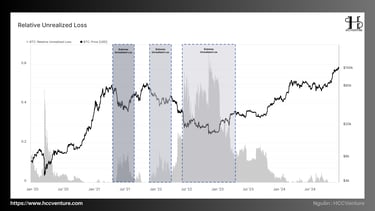
However, when measuring unrealized losses — that is, the paper value of losses rather than the number of coins in a loss — we see a different picture.
Although the majority of supply held by Short-Term Holders (STHs) is “underwater” relative to their cost price, these unrealized losses have not reached the extreme levels typically seen in bear markets.
The data shows that although many coins in the STH group are in a loss state, the total unrealized loss value is relatively low.
This may stem from the fact that the cost basis of the STH group is not too high compared to the current market price. When the price falls, the unrealized loss value is not too large to cause widespread panic.
During deep downturns, such as the 2018 or 2022 bear markets, the unrealized losses of the STH group often reach very large levels, making them the main selling force, contributing to pushing prices lower.
Conversely, in the current bull cycle, despite selling pressure, unrealized losses are not large enough to cause widespread panic in the market.
As more investors hold Bitcoin despite the nominal value falling (in a loss state), this could be an accumulation signal preparing for the next bull cycle.
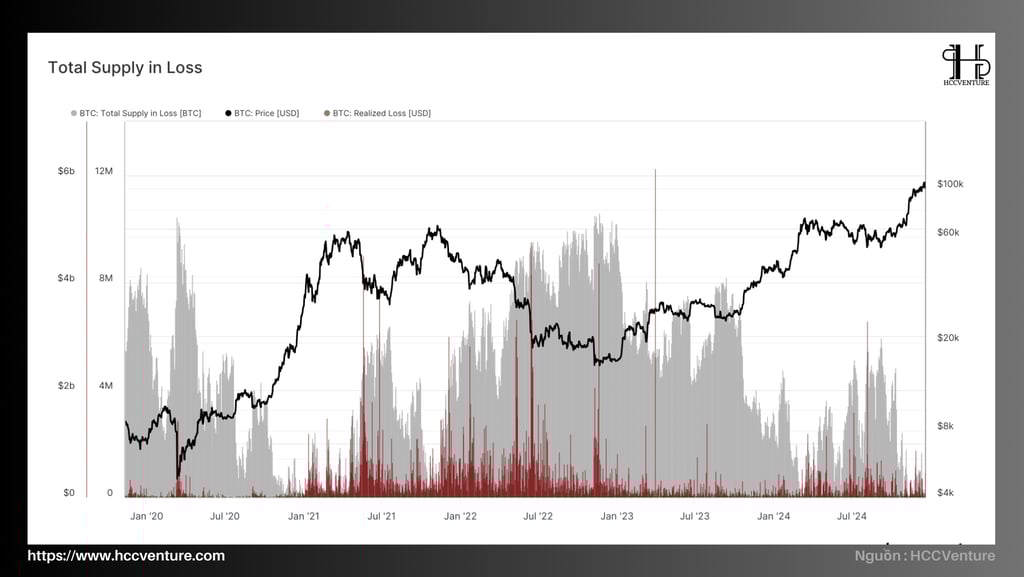
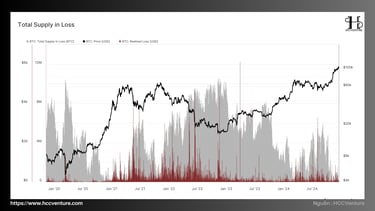
Bear Market Phase (2022)
At the end of 2022, when Bitcoin bottomed near $15,500, Total Supply in Loss reached its highest level (~55-60% of supply), reflecting widespread anxiety and fear in the market.
This ratio is similar to previous cycles, for example:
2018: Total Supply in Loss peak ~60% during big sell-off.
2015: Similar high (~65%) as price bottomed.
Market recovery and 2024
During the 2023-2024 bull cycle, Total Supply in Loss drops significantly, now accounting for only about 10-15% of total supply (depending on price).
This decline shows:
Many investors are back in profit mode as Bitcoin price surpasses average buying threshold.
Market cleansing , when weak investors sell at a loss during low price periods.
Low Total Supply in Loss : Reflects a strong recovery and the market is in a bull market phase. This means that current investors have a more positive sentiment, reducing the possibility of a sell-off.
The LTH group distributed a large amount of supply during the rally to and above the $100k mark. The selling pressure from this group even surpassed what the market experienced in March, when Bitcoin set its previous high at $73k.
Data shows that the volume of Bitcoin sold by LTH during this period was very large, increasing the supply pressure on the market. This is not surprising because long-term holders often realize profits during high price periods to balance their portfolios.
However, this distribution remains within the typical market dynamics of the late stages of a Bitcoin bull cycle, where selling pressure typically increases as long-term investors find prices attractive.
In previous cycles, such as in 2017 and 2021, the LTH group played a similar role, creating massive selling pressure as the market approached cycle peaks.
The difference in the current cycle is that there is strong counter-demand from new investors, especially from large financial institutions, helping the market absorb supply without leading to major price drops.
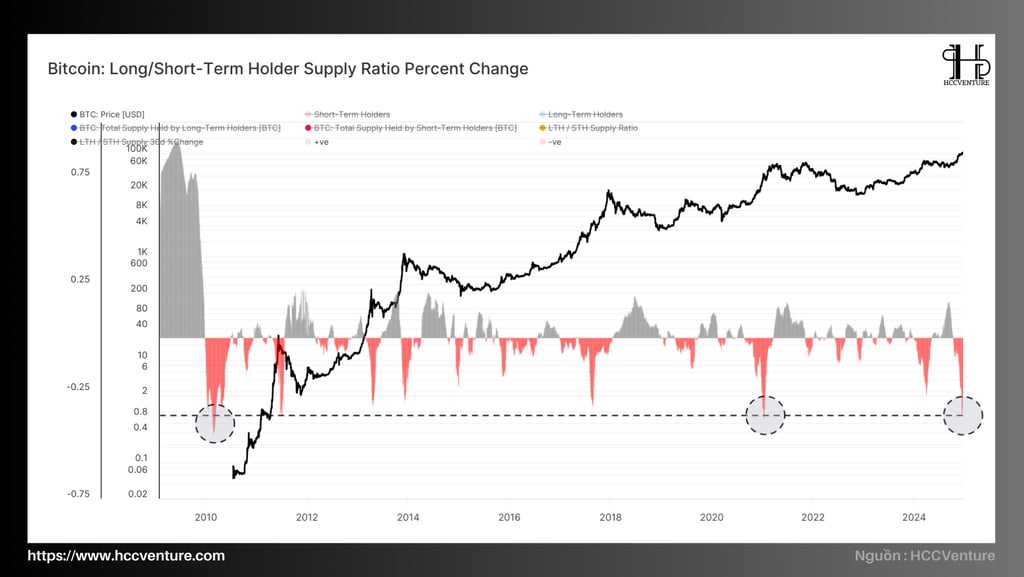
This happens when coins held by Long-Term Holders (LTHs) are distributed to new investors, reflecting a sharp increase in demand activity from buyers.
However, the proportion of assets held by new investors has not yet reached the levels seen in previous ATH cycle peaks. The understanding here is that the market may not have reached the level of “mania” as in previous cycles, where the participation of speculative investors, or “spéculateurs”, caused saturation and even over-fever.
This indicates that the market has not yet reached an overheated state, without strong speculation from investors looking only for short-term profits, which we saw in the cyclical peaks of 2017 or 2021.
Past ATH peaks have often been accompanied by a saturation of speculators , leading to extremely high levels of volatility.
However, in the current cycle, the market appears to be more mature , with participation mainly from long-term and institutional investors, rather than short-term speculative waves.
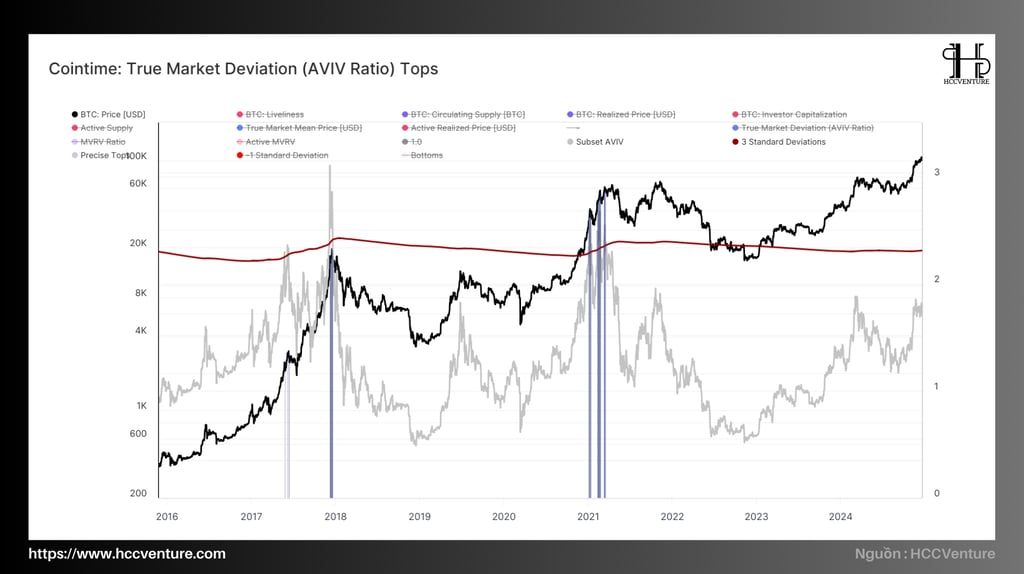
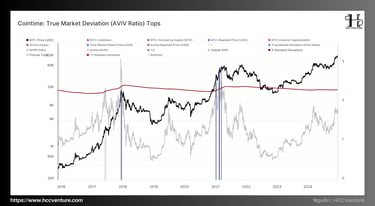
Currently, the AVIV Ratio has not reached its peak of +3σ, which means that the market has not reached an overheated state where the majority of investors are holding very large profits.
When AVIV reaches its peak, the market will often face a strong sell-off from investors , when their profits are too attractive to continue holding, thereby pushing the price down.
Although the Bitcoin market has reached record prices and there has been a large distribution of assets from long-term investors (LTH), the unrealized profits of average investors are not yet large enough to create strong selling pressure. This suggests that there may be room for the market to continue growing before investors start to realize their profits in large numbers.
However, as the AVIV Ratio approaches +3σ, a major correction may occur due to the sharp increase in unrealized profits, creating strong selling pressure.
With the current AVIV Ratio not yet at its peak, we can expect the market to continue to have room to grow further before unrealized profits become too attractive for current investors, leading to strong selling pressure.
Evaluation and Conclusion
Supply-side forces are becoming increasingly evident as Long-Term Holders (LTHs) continue to aggressively distribute coins, resulting in realized profits of up to $2.1 billion. However, a strong demand-side is also evident, significantly reducing selling pressure from existing investors.
Additionally, the proportion of network assets held by new investors has increased sharply, reinforcing the notion of a strong demand profile. This also suggests a shift in asset distribution , with assets gradually moving from long-term investors to new investors, a characteristic often seen in the late stages of a bull market .
Join the HCCVenture community to get the latest market information. Once again, we give our opinion on potential projects in the crypto market. This is not investment advice, consider your portfolio. Disclaimer: The views expressed in this article are solely those of the author and do not represent the platform in any way. This article is not intended to be a guide to making investment decisions.
API & Data : Glassnode
Compiled and analyzed by HCCVenture
Join our telegram community: HCCVenture
Explore HCCVenture group
HCCVenture © 2023. All rights reserved.


Connect with us
Popular content
Contact to us
E-mail : sp_contact@hccventure.com
Register : https://linktr.ee/holdcoincventure
Disclaimer: The information on this website is for informational purposes only and should not be considered investment advice. We are not responsible for any risks or losses arising from investment decisions based on the content here.
TERMS AND CONDITIONS • CUSTOMER PROTECTION POLICY
ANALYTICAL AND NEWS CONTENT IS COMPILED AND PROVIDED BY EXPERTS IN THE FIELD OF DIGITAL FINANCE AND BLOCKCHAIN BELONGING TO HCCVENTURE ORGANIZATION, INCLUDING OWNERSHIP OF THE CONTENT.
RESPONSIBLE FOR MANAGING ALL CONTENT AND ANALYSIS: HCCVENTURE FOUNDER - TRUONG MINH HUY
Read warnings about scams and phishing emails — REPORT A PROBLEM WITH OUR SITE.