


On-chain analysis week 50/2025: Negative impact or short selling?
Bitcoin is entering a particularly rare phase in its cycle history: on-chain selling pressure is reaching record levels, while the price structure remains stable at high levels, and new capital is gradually absorbing distributions from other groups.
12/14/202510 min read
Market Summary
The market is anchored in a fragile equilibrium zone, where time becomes a greater driving force than price volatility . Investors with a high cost basis are gradually capitulating, while new buyers with a long-term outlook patiently absorb the supply—a typical characteristic of the transitional phase between growth and re-accumulation in a major bull cycle .
Financial pressure on the supply chain is at its highest level in history , evidenced by Realized Loss exceeding $3 billion per day and Relative Unrealized Loss increasing sharply after a long period of suppression. This confirms that the market is undergoing a deep cleansing phase, but it is psychological and time- sensitive , not a structural collapse.
Long-Term Holders' profit-taking activity was strong but orderly , with Realized Profits remaining at record highs without breaking the price structure. This indicates sufficient demand to absorb the distribution , a fundamental difference from the 2017 or 2021 cycle peaks.
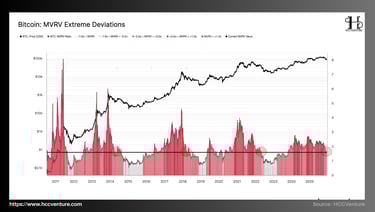
MVRV and Extreme Deviation Bands indicate that the price has moved away from the overvalued zone, returning to equilibrium around core holding cost thresholds. This is a necessary condition for the market to build a foundation for the next upward phase, provided liquidity improves.
Analyzing on-chain metrics

MVRV (Market Value to Realized Value) is one of the most crucial metrics in on-chain Bitcoin analysis, reflecting the relationship between the current market value (Market Cap) and the actual value recorded on the chain (Realized Cap) . When MVRV deviates significantly from the historical average, the market is often in extreme valuation states – either undervalued or overvalued.
Currently, Bitcoin is trading around $92,000–$95,000 , with the MVRV Ratio fluctuating in the +0.5σ to +1.0σ range , which is higher than the historical average but not yet at the extreme levels of previous cyclical peaks.
The MVRV is currently in the +0.5σ to +1.0σ range . It's higher than the Cumulative Mean , but hasn't sustainably surpassed the +1.0σ threshold. Bitcoin is no longer undervalued like it was in 2022–2023. However, it hasn't yet entered a price bubble like its historical cyclical peaks.
The fact that MVRV has remained around +0.7σ–+0.9σ for an extended period indicates that:
Profit-taking pressure exists, but there's no need to panic .
Long-term investors (LTH) are distributing their holdings in a controlled manner , not dumping them en masse.
Bitcoin is currently trading in a transitional high valuation state, with MVRV above historical averages but not yet reaching the extreme peaks of previous cycles. The long-term bull cycle has begun, and most of the gains have been recorded. The market is in a structural distribution phase , no longer in an accumulation phase. However, there are no strong enough bubble valuation signals to confirm that the final cycle peak has been completed.
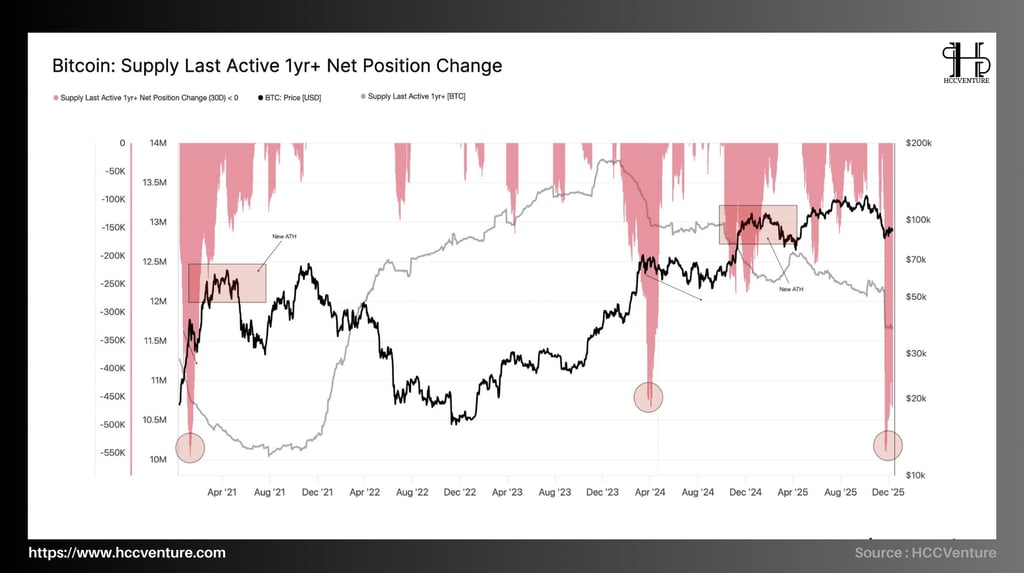

Supply Last Active 1yr+ – Net Position Change reflects the net change in the amount of Bitcoin that has not moved for at least one year , representing the behavior of long-term holders (LTHs) . Current data shows a strong and sustained distribution flow from the LTH group , with a consistently negative 30-day Net Position Change and a large amplitude, equivalent to or even exceeding strong distribution phases in previous cycles.
With Bitcoin trading around $90,000–$95,000 , the supply of coins older than one year is rapidly decreasing , reflecting long-term holders actively selling their coins while the price remains at historical highs.
During the 2020–2021 cycle , as Bitcoin entered new all-time highs (ATHs), the Net Position Change of supply >1 year consistently shifted into negative territory. At its peak in early 2021, the distribution rate of LTH reached -300,000 to -400,000 BTC/30 days , coinciding with the time when the price formed a local peak and then entered a sharp correction phase.
Conversely, during the bottoming phase of 2022 , the index reversed sharply to positive territory, as LTH resumed accumulation amidst low prices, depleted liquidity, and extremely pessimistic market sentiment. This formed the foundation for the 2023–2024 growth cycle.
It's noteworthy that this distribution process occurred while Bitcoin's price remained near its historical peak , rather than during a panic-driven sharp decline.
LTH proactively took profits according to its strategy , and was not forced to sell.
The selling pressure is sustained over time , not sudden and explosive.
The market is absorbing the large supply from the group with the longest-term confidence.
Compared to the 2021 distribution peak , the scale and duration of the current distribution phase are no smaller , while the nominal price is significantly higher. This suggests that the actual supply pressure of this cycle is even greater , as the USD value of the distributed coins has increased considerably.
Although Bitcoin hasn't crashed sharply yet, it's stuck within a weak range , with every attempt to rise quickly met with selling pressure from LTH. This is the mechanism that causes the market to fall into a prolonged sideways-to-down state , instead of continuing its upward trend.
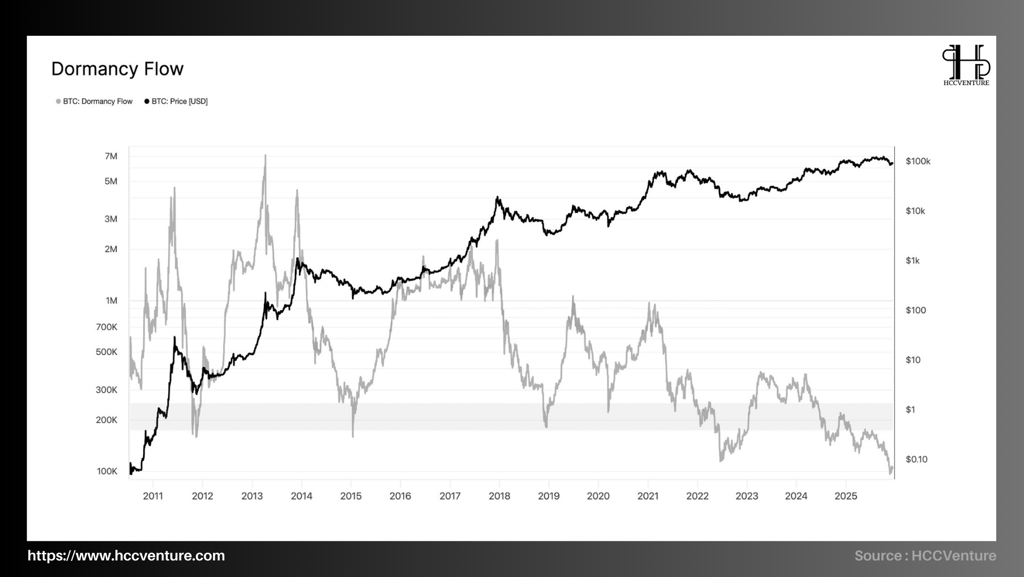
Dormancy Flow measures the relationship between Bitcoin's price and the average lifespan of the coins being spent , reflecting the willingness of long-term supply to sell relative to current valuations. Currently, Bitcoin's Dormancy Flow has fallen sharply to historically low levels , approaching areas previously associated with major cyclical bottoms .
Dormancy Flow is built on the ratio between Bitcoin price and Dormancy , where Dormancy represents the average number of “coin-days destroyed” per coin when spent. In other words, this indicator answers the question: at the current price, are the coins being sold considered “old” or not?
In previous bull cycles, including 2013, 2017, and 2021 , Dormancy Flow surged to very high levels. This reflects that when Bitcoin reached prices considered attractive for profit-taking, coins that had been dormant for a long time began to activate , creating decisive selling pressure and marking long-term cycle peaks .
Currently, Dormancy Flow is at historically low levels despite high prices. The unique and structural aspect of the current cycle is that Dormancy Flow has fallen sharply to historically low levels , equivalent to or even lower than previous cycle lows, while Bitcoin's price is still trading near its historical peak .
Dormancy Flow is currently hovering around ~0.1–0.2 , approaching the lows previously recorded in 2015 and 2019.
In the past, these levels typically only appeared when Bitcoin's price was in extremely low valuation zones , not in the high price range it is at now.
The Bitcoin market is currently in a long-term post-distribution state, where the supply of long-standing coins has almost been exhausted in terms of selling behavior, as evidenced by Dormancy Flow remaining at historically low levels despite very high prices. In this context, the dominant market trend is accumulation – rebalancing over the long term , rather than explosive growth or deep collapse.
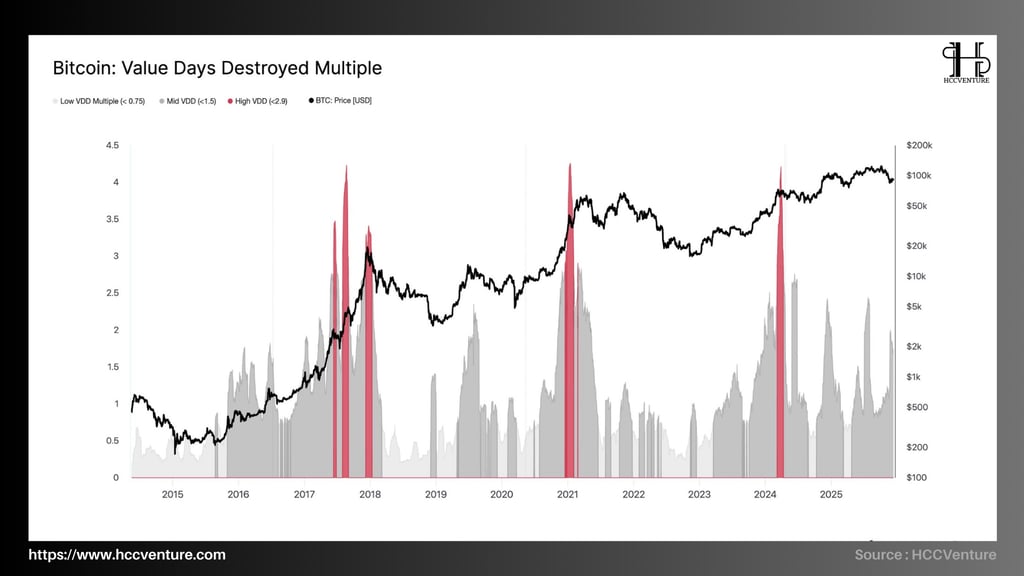
Value Days Destroyed (VDD) Multiple is a core metric used to assess the spending intensity of long-standing cryptocurrencies against historical averages, thereby reflecting the distribution behavior of long-term investors in each cycle phase.
The stark separation between high nominal valuations and low intensity of value destruction over time suggests that the current market is not in the extreme distribution phase of long-term holders , in contrast to typical cyclical peaks of the past.
The most striking feature of the current cycle is the absence of a high VDD Multiple signal , despite Bitcoin trading around its all-time high price.
The VDD Multiple currently fluctuates mostly below ~1.5 , even approaching <0.75 at many times , which is considered a weak spending zone according to historical standards.
The short-term peaks of the VDD Multiple during the 2024–2025 period are only localized and transient , not forming sustained distribution clusters like in 2017 or 2021.
The current situation shows many similarities in supply behavior , despite significant differences in price levels . This suggests that the current cycle is entering a new phase where high nominal valuations no longer equate to strong distribution, and the market structure has changed due to the participation of institutional capital and ETF products.
A low VDD Multiple in the context of high prices reflects a more "mature" market structure compared to previous cycles. The absence of a high VDD Multiple also suggests that the market has not yet entered the euphoric phase at the end of the cycle , where herd-like profit-taking behavior often occurs.
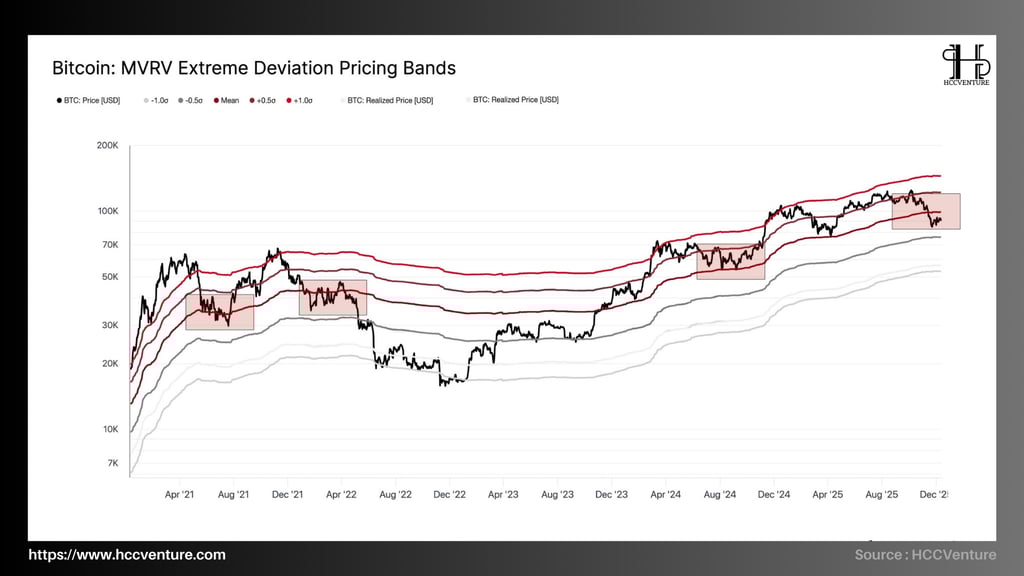
MVRV Extreme Deviation Pricing Bands provide a structural pricing framework for Bitcoin, based on the standard deviation of the market price from the Realized Price . Current data shows Bitcoin trading within the +0.5σ to +1.0σ range , significantly lower than historical extremes, and no longer maintaining the price expansion seen in the early stages of the bull cycle.
This structure reflects a market that has moved out of the valuation euphoria phase and entered a rebalancing state around core holding cost thresholds , where profit-taking pressure and demand to absorb supply are in strong conflict.
Bitcoin is trading around the $90,000–$105,000 range , corresponding to the +0.5σ to +1.0σ band on the MVRV Extreme Deviation chart. The price is no longer stabilizing above +1.0σ ; attempts to extend the valuation to higher levels are quickly rejected, and the market is forming sideways consolidation zones right near the +0.5σ band.
The current structure has many similarities to:
During the Q2–Q3 period of 2021 , Bitcoin underwent a sharp correction but still remained above the Realized Price and the Mean zone.
The mid-cycle period of 2016–2017 saw prices fluctuating within the +0.5σ range before renewed valuation expansion.
In both cases, the fact that the price did not fall to the Mean or -0.5σ zone indicates that long-term confidence remains strong , selling pressure mainly comes from short-term and medium-term investors, and long-term holders are not forced to capitulate.
Bitcoin is currently trading within a moderately widening valuation range (+0.5σ to +1.0σ), reflecting a market that has exited the euphoric phase but has not yet entered an extreme valuation or cyclical distribution phase.

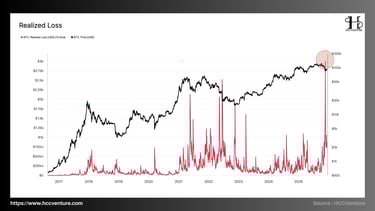
This breakout of losses occurred while Bitcoin's price remained anchored near the $90,000–$100,000 range , rather than at the cycle bottom. This reflects a particularly tense market structure, where time-sensitive and psychological selling pressure is dominating investor behavior, rather than panic caused by a price crash.
Realized Loss (7D EMA) has surpassed $3 billion/day , the highest in Bitcoin history. Meanwhile, the price of Bitcoin is still trading around $90,000–100,000 , only a moderate correction from its recent peak.
Most of the losses came from investors who bought at the local peak of $100,000+ . This wasn't a sell-off due to a structural collapse, but rather a temporary capitulation where investors no longer had the patience to hold on.
The sharp increase in Realized Loss amidst still-high prices reflects a chain reaction where the previous strong growth phase had driven up the cost basis of Short-Term Holders significantly. When prices failed to expand further and instead moved sideways for an extended period, unrealized losses gradually accumulated .
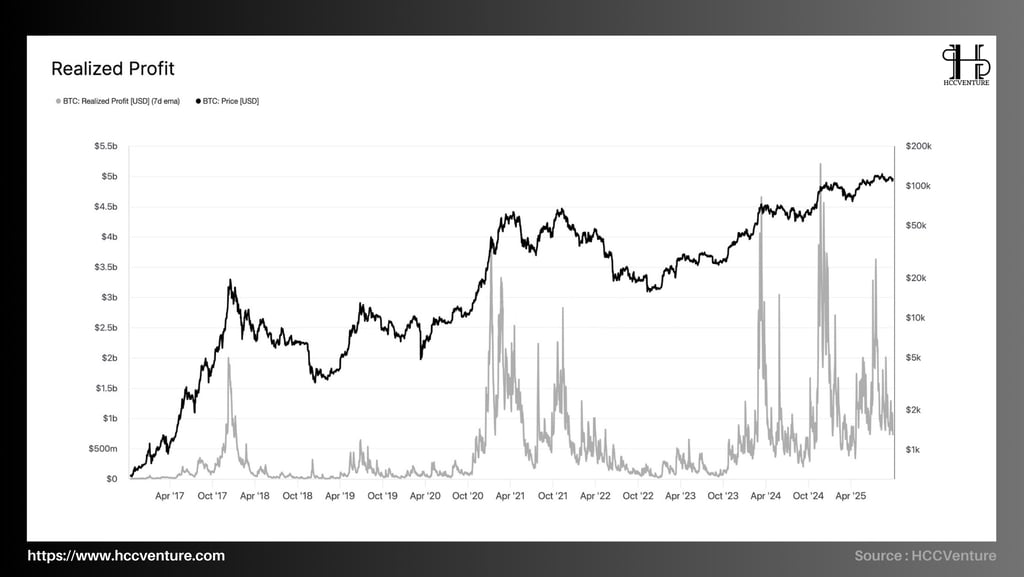

Realized Profit measures the total actual profit recorded when Bitcoin is spent at a price higher than its cost price. The latest data shows that Realized Profit (7D EMA) is maintaining a very high level, fluctuating around $1.5–$2.5 billion per day , with many sessions surging past the $3–$5 billion mark , approaching and at times surpassing the 2021 cycle peak .
Realized Profit (7D EMA) has consistently remained in the high zone , surpassing the 2021 peak at many points . However, Bitcoin's price has not formed a traditional top-bottom distribution pattern , but instead a sideways structure – a shallow correction around the high zone.
The majority of current realized profits come from Long-Term Holders (LTH) , investors who accumulated Bitcoin at much lower prices during 2022–2023. A portion also comes from Short-Term Holders who bought early during the 2024 bull run and realized profits when the market stalled.
Realized profit is high , but demand remains strong , as evidenced by the price holding steady above key structural levels such as Realized Price and True Market Mean. Realized profit is sustained over time , reflecting a controlled redistribution process. Only when Realized profit remains high and the price begins to break through key holding cost thresholds does the market truly enter the final distribution phase.
Assessment and Conclusion
Bitcoin is currently trading around $92,000. Key on-chain indicators paint a consistent picture: unrealized losses are increasing, realized losses (30 days, entity-adjusted) are soaring and have reached a high of $555 million/day, and realized profits for holders over a year have peaked at historical highs (total 30-day realized profits - LTH SMA - once exceeded $1.3 billion/day).
Simultaneously, the supply of losing tokens is increasing to millions of BTC in the loss zone, and balances on exchanges have fallen to historically low levels (< 2.95 million BTC). These factors combined create a structurally vulnerable market structure with significant selling pressure, low trading liquidity, and weak intrinsic bullish momentum. However, patient demand remains sufficient to keep the price above the True Market Average — which explains why the price hasn't immediately collapsed to a deep bottom.
Realized losses are currently near historical highs (~555 million/day compared to a peak of ~900 million/day during the FTX period); the supply of unrealized losses and outstanding losses is relatively approaching the levels seen in the early 2022 surrender phase. Although not yet reaching the 2022 peak, the current rate of increase of these indicators is very rapid and follows a similar mechanism (driven by the surrender phase).
If seller supply exhaustion (tiredness from sell-offs, quantified by a sigh of relief as realized/long-term gains decrease and realized losses decrease) occurs, existing patient demand could push prices up to test the 0.75th percentile (~95k) and even retest the short-term base price (the price range for short-term holders). However, this is only possible if there is a significant decrease in the realized loss ratio and signs of net buying by institutions (ETF inflows turn positive) and a recovery in open interest for futures contracts.
Disclaimer: The information presented in this article is the author's personal opinion in the field of cryptocurrency. This is not financial or investment advice. All investment decisions should be based on careful consideration of your personal portfolio and risk tolerance. The views expressed in this article do not represent the official stance of the platform. We recommend that readers conduct their own research and consult with experts before making any investment decisions.
API & Data : Glassnode
Compiled and analyzed by WHAT Exchange and HCCVenture
Join the HCCVenture organization here: https://link3.to/holdcoincventure
Explore HCCVenture group
HCCVenture © 2023. All rights reserved.


Connect with us
Popular content
Contact to us
E-mail : sp_contact@hccventure.com
Register : https://linktr.ee/holdcoincventure
Disclaimer: The information on this website is for informational purposes only and should not be considered investment advice. We are not responsible for any risks or losses arising from investment decisions based on the content here.
TERMS AND CONDITIONS • CUSTOMER PROTECTION POLICY
ANALYTICAL AND NEWS CONTENT IS COMPILED AND PROVIDED BY EXPERTS IN THE FIELD OF DIGITAL FINANCE AND BLOCKCHAIN BELONGING TO HCCVENTURE ORGANIZATION, INCLUDING OWNERSHIP OF THE CONTENT.
RESPONSIBLE FOR MANAGING ALL CONTENT AND ANALYSIS: HCCVENTURE FOUNDER - TRUONG MINH HUY
Read warnings about scams and phishing emails — REPORT A PROBLEM WITH OUR SITE.