


On-chain analysis week 5 / 2025 : Market saturation
The current bull run shows notable structural similarities to the 2015–2018 market cycle. This analysis delves into those similarities by examining the decline, price action, and changes in Realized Cap. Additionally, we debunk common misconceptions about exchange reserves and ETF holdings.
2/4/20257 min read
Summary
Market Cyclical Growth : Bitcoin’s price growth has slowed down over each cycle, reflecting the maturity of the market. The price correction pattern in the current cycle has many similarities to the 2015–2017 cycle , suggesting that an acceleration phase of the bull market may be imminent, based on historical trends at similar times in previous cycles.
Realized Cap Expansion : Bitcoin's Realized Cap has increased 2.1x this cycle, significantly lower than the previous cycle's peak of 5.7x but in line with the 2015–2018 cycle at this point. Notably, the euphoria phase has yet to have a significant impact on the Realized Cap, suggesting that the market may still have room to expand.
Exchange Balances vs. ETF Wallets : The drop in Bitcoin balances on exchanges to 2.7 million BTC was largely due to a shift in supply to ETF wallets , which are typically managed by custodians like Coinbase . However, the total amount of BTC in both exchanges and ETF wallets remained stable at around 3 million BTC , reflecting a change in market structure rather than a supply shock.
Capital Flows and Rotation : During bull markets, long-term investors (LTHs) gradually distribute their Bitcoin to new investors. Recent capital rotation trends have helped Bitcoin maintain its price above $100k , emphasizing the important role of new buyer inflows in supporting market momentum.
On-chain metrics analysis
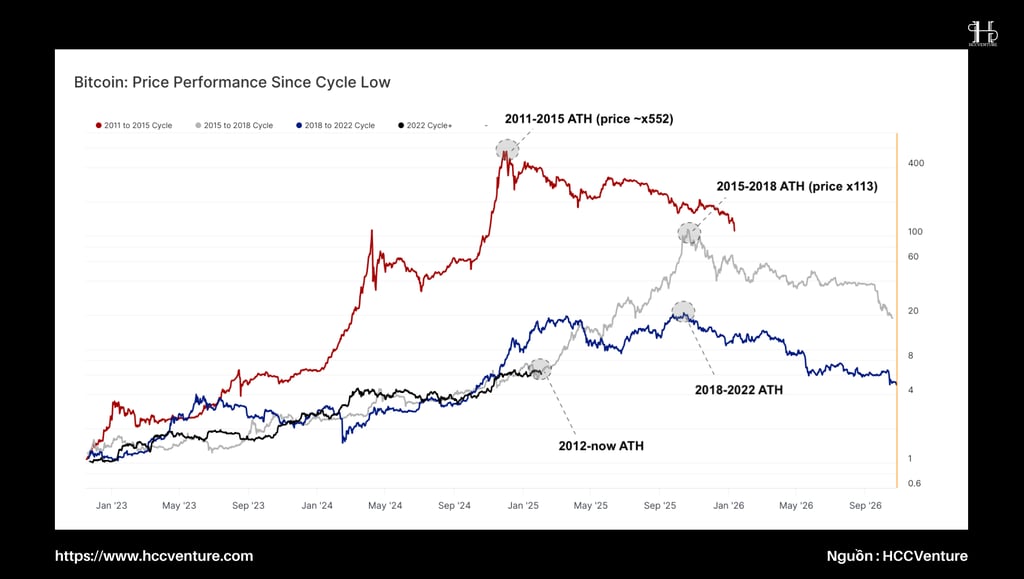
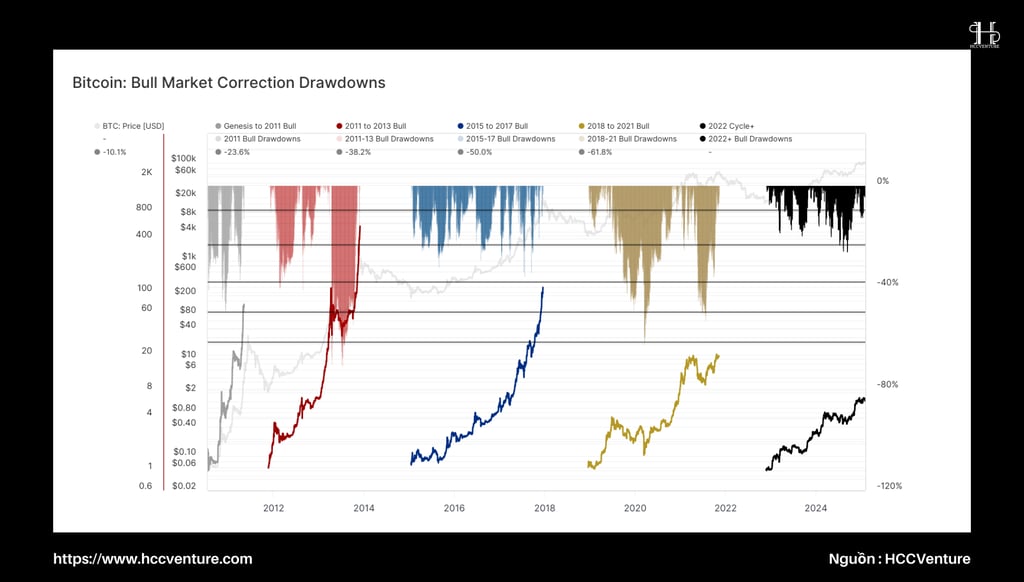
Based on two key charts – price performance index vs. cycle bottom and price correction pattern in bull market – some prominent trends emerge:
Growth Cycle Decline :
Bitcoin's rate of increase (slope) has been decreasing over each cycle.
This reflects the maturity of the market and the growing need for capital to drive an asset class from billions to trillions of dollars .
Price adjustment scale (Drawdown Size) :
Price corrections in the current cycle fluctuate within the Fibonacci range of 10.1% - 23.6% .
This pattern is very similar to the 2015–2017 cycle , when Bitcoin went through multiple mean corrections but maintained an uptrend.
Phases of a Bullish Market :
Bull markets typically begin with a slow growth phase ( early bull ), then enter a strong price expansion phase ( euphoric bull ).
The current position of the 2023-2025 cycle relative to the bottom set in late 2022 suggests a high probability that Bitcoin is about to enter a second explosive growth phase .
Previous cycles have also seen strong price acceleration around this time, largely due to new money inflows and increased interest in Bitcoin.
Overall, historical data suggests that Bitcoin may be approaching a price explosion phase , similar to what has happened in previous cycles.
The current Bitcoin cycle has many similarities to the 2015–2018 cycle , when the market was primarily driven by spot trading , due to the lack of derivatives and stablecoin infrastructure. However, there is a notable difference: in the 2015–2018 cycle, the overall market performance achieved a return of over 100x from bottom to top.
This is unlikely to happen in the current cycle, as Bitcoin started at around $15,600 and is currently trading around $100,000 , suggesting a growth rate that cannot be achieved at the same rate as the previous cycle.
However, we can build an analysis based on the price correction model (drawdown profile) during the growth phase . It is worth noting that the corrections in the current cycle are very similar to the correction model after the FTX collapse , when Bitcoin reached a new low in late 2022.
Although Bitcoin's market capitalization has increased by many orders of magnitude compared to before, the current cycle's peak-to-trough price corrections have rarely exceeded -25% . This is a big difference from previous cycles, when Bitcoin saw stronger corrections, sometimes reaching over 50%.
These factors suggest that strong demand structure and market maturity have helped Bitcoin avoid deep corrections, while maintaining higher prices than in previous cycles.
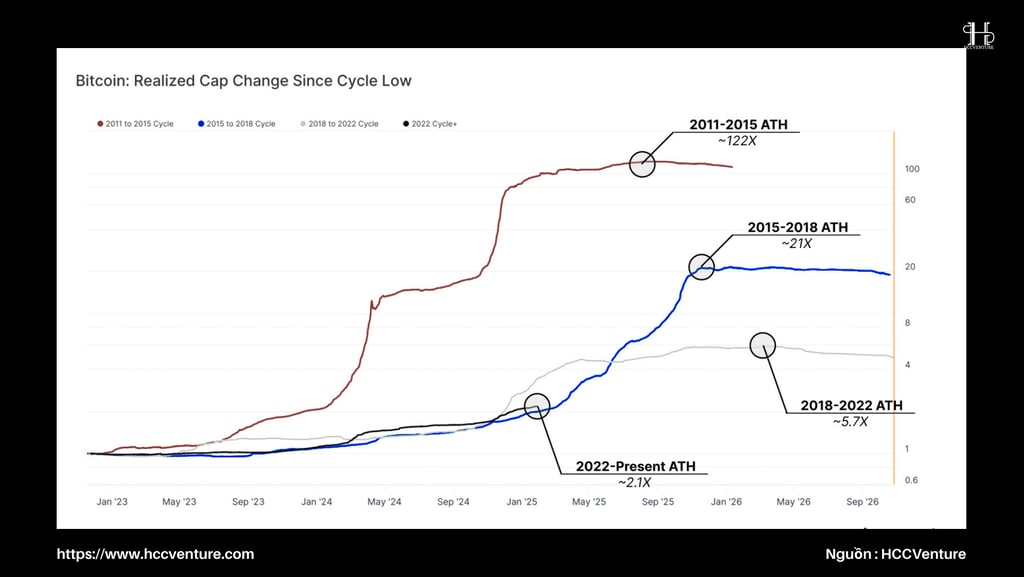
During the 2011–2015 cycle, Cap actually grew an impressive ~122x, a product of early exponential Bitcoin adoption. However, as the market matured, the growth rate declined in each subsequent cycle, demonstrating Bitcoin’s transition into a highly capitalized and structurally robust market.
In the current cycle, Real Cap has grown 2.1x so far—well below the previous cycle’s peak of 5.7x, but similar to the 2015–2018 cycle. We can also see a clear change in slope as each cycle enters the euphoric phase of the bull market, where Real Cap has clearly spiked (in logarithmic space).
With this metric, the current market has not yet fully entered the exponential real Cap growth phase, which suggests that there is still room for expansion if demand increases significantly from here. However, this idea may be limited by the much larger scale of Bitcoin today, which requires a much larger amount of capital to continue on a similar path.
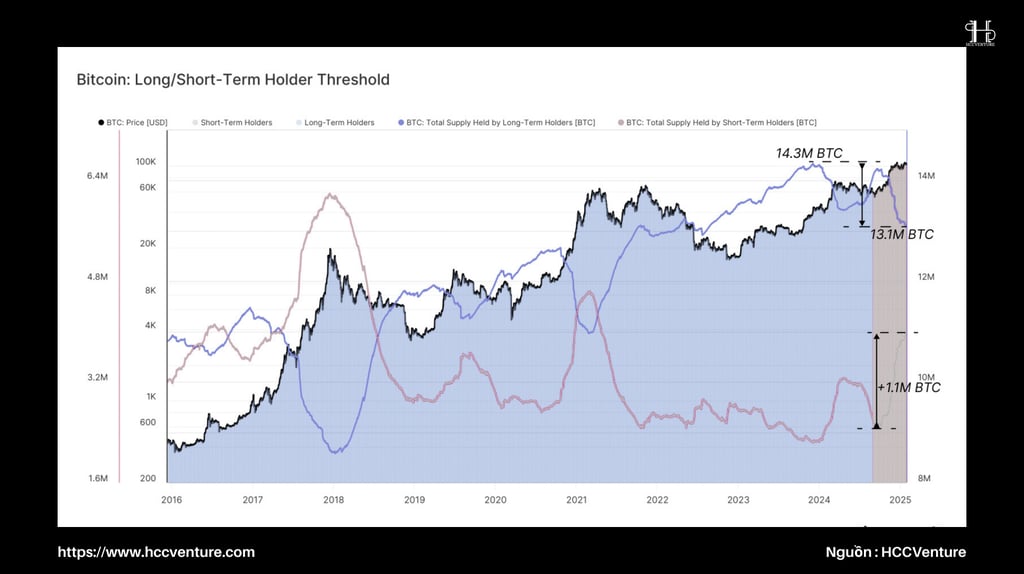
The main factor driving the growth of Cap is actually profit taking by long-term investors. We introduce a framework to track the rotation of capital from long-term investors to new buyers, thereby providing a clearer view of supply and demand dynamics in bull markets.
In bull markets, long-term investors will spend coins that have been dormant for a long time to take profits, while new buyers will absorb this supply at higher prices. The sustainability of a bull market depends heavily on the strength of demand, which drives the increase in value and maintains momentum.
The chart below illustrates capital turnover in previous bull markets, with 1.2 million coins changing hands since the supply of long-term investors peaked at 14.3 million BTC in December 2023. During the recent rally above $100K, 1.1 million BTC moved from long-term investors to short-term investors, indicating a large inflow of capital into the market to absorb this supply at prices above $90K.
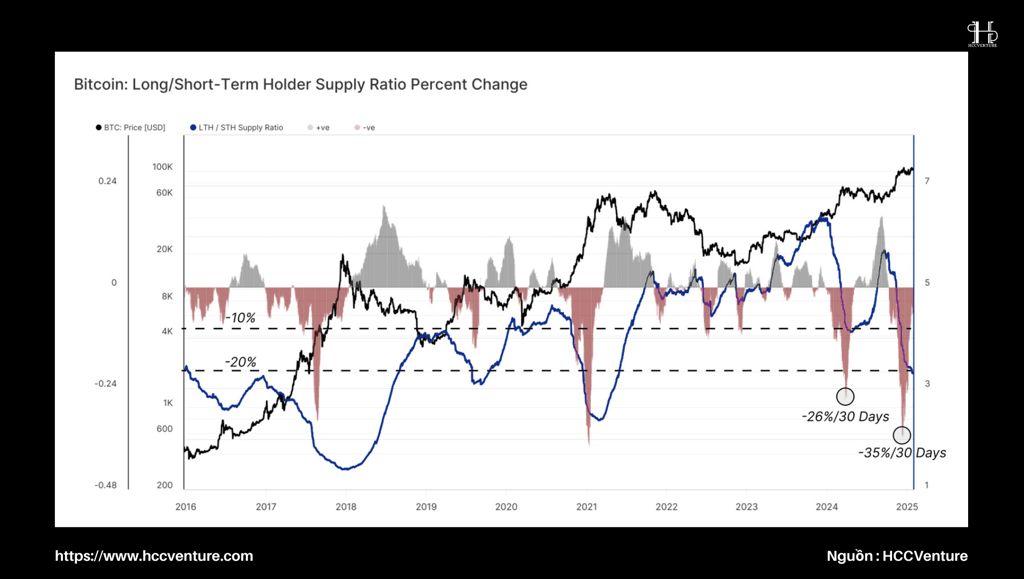
The distribution ratio provides additional insights into investor behavior and can be interpreted as short-term selling pressure being created.
The chart below shows the ratio of supply from long-term to short-term investors, reflecting this distribution change over time. An uptrend indicates a predominance of accumulation and HODLing behavior, as fewer old coins are spent and more coins move into Long-Term Investor status. Conversely, a decline in this metric indicates a strong distribution of long-term investors at the moment.
The monthly rate of change in this index highlights two major distributions that have occurred in the 2023-2025 cycle, which are comparable in size to the distributions in early 2021 and late 2017.
In each case, the market rallied for more than a month after the selling peak, suggesting that the reduction in selling pressure created space for demand to push prices higher. However, each time the market also gradually exhausted demand, and began to transition into a HODLing-dominated phase in the subsequent bear market.

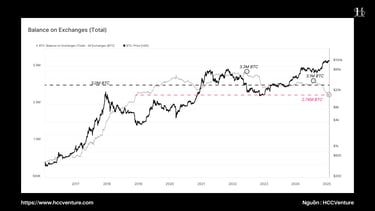
There is a common misconception regarding the decline in Bitcoin balances on exchanges during this cycle and the potential implications for market structure.
Bitcoin balances on centralized exchanges have dropped to 2.7 million BTC , down from 3.1 million BTC in July 2024. Many have interpreted this drop as a supply shock due to a large amount of Bitcoin being withdrawn from retail investors—and this could create upward pressure on prices .
This shift is not a supply shock in the conventional sense, but rather a diversion of Bitcoin flows from traditional exchanges to ETF wallets .
These adjustments in the supply-demand structure may mislead many into thinking that Bitcoin supply is limited, leading to the misconception that the market is facing a supply shock .
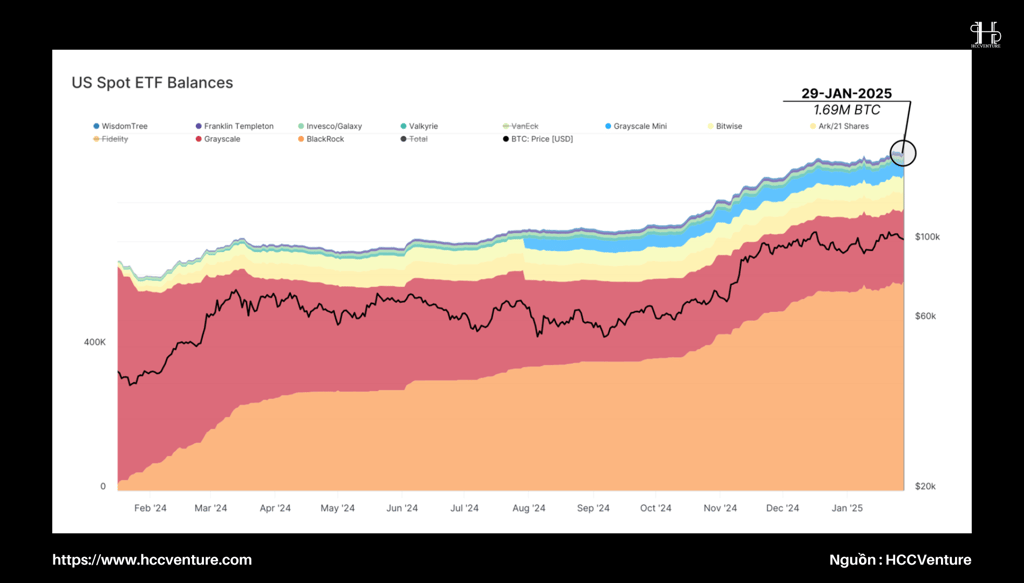
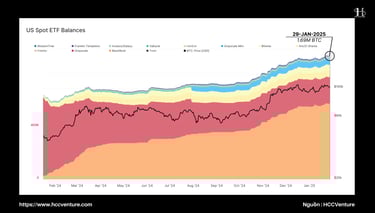
After the SEC approved Bitcoin Spot ETFs in January 2024, eight of the eleven ETFs selected Coinbase as their custodian. The surge in demand for ETF products has led to a significant migration of Bitcoins from exchange wallets to Coinbase ’s institutional custodian wallets .
Conclusion and evaluation
Bitcoin’s growth reflects a maturing market with overall cycle growth declining, measured bull market pullbacks, and adjusted Real Cap expansion. While lower than previous peaks, the 2.1x Real Cap growth in the current cycle is similar to the 2015–2018 cycle, leaving room for long-term euphoria-driven expansion.
We also clarify that the widely discussed exchange balance decline does not signal a strong depletion when accounting for supply migration to ETF wallets. Therefore, the notion of an impending supply shock due to exchange balance declines is incorrect.
Instead, the rotation of capital from long-term investors to new investors remains the main driver of market cycles. After two distributions, the size and rate of rotation of assets in the current cycle mirrors the bull markets of late 2017 and early 2021. This suggests that there may be a period of short-term demand exhaustion, leading to a dominant HODLing sentiment in the market.
Join the HCCVenture community to get the latest market information. Once again, we give our opinion on potential projects in the crypto market. This is not investment advice, consider your portfolio. Disclaimer: The views expressed in this article are solely those of the author and do not represent the platform in any way. This article is not intended to be a guide to making investment decisions.
API & Data : Glassnode
Compiled and analyzed by HCCVenture
Join our telegram community: HCCVenture
Explore HCCVenture group
HCCVenture © 2023. All rights reserved.


Connect with us
Popular content
Contact to us
E-mail : sp_contact@hccventure.com
Register : https://linktr.ee/holdcoincventure
Disclaimer: The information on this website is for informational purposes only and should not be considered investment advice. We are not responsible for any risks or losses arising from investment decisions based on the content here.
TERMS AND CONDITIONS • CUSTOMER PROTECTION POLICY
ANALYTICAL AND NEWS CONTENT IS COMPILED AND PROVIDED BY EXPERTS IN THE FIELD OF DIGITAL FINANCE AND BLOCKCHAIN BELONGING TO HCCVENTURE ORGANIZATION, INCLUDING OWNERSHIP OF THE CONTENT.
RESPONSIBLE FOR MANAGING ALL CONTENT AND ANALYSIS: HCCVENTURE FOUNDER - TRUONG MINH HUY
Read warnings about scams and phishing emails — REPORT A PROBLEM WITH OUR SITE.