


On-chain analysis week 49 / 2024 : High profit
Bitcoin’s rally to a high of $99.4k has pushed investor holdings into extreme profit territory, leading to a sharp redistribution of supply. Many risk indicators are high and signaling caution, while realized profits and funding rates have begun to cool, suggesting a potential accumulation phase.
12/5/20248 min read

Summary
Bitcoin has hit a new high of $99.4k after a long period of trading in the $54k to $74k range.
Several risk indicators have entered the Very High Risk zone, reflecting a sharp increase in unrealized profits and investor sentiment that is vulnerable to corrections.
The Realized Profit/Loss Ratio shows strong profit taking, suggesting the market may face a period of short-term demand decline.
Realized profit volume is down 76% from its peak, and funding rates on perpetual futures contracts are also falling, suggesting the market is rapidly cooling.
Initial supply redistribution models show major demand clusters between $87k and $98k, while very little supply changed during the rally from $74k to $87k.
So last week, short-term investors received huge profits when Bitcoin reached the 100k USD hook, but there are still many challenges for investor psychology. Is this the time to take profits or continue to wait for higher positions? Let's take a look at some on-chain indicators that marked high profits last week.
On-chain metrics analysis
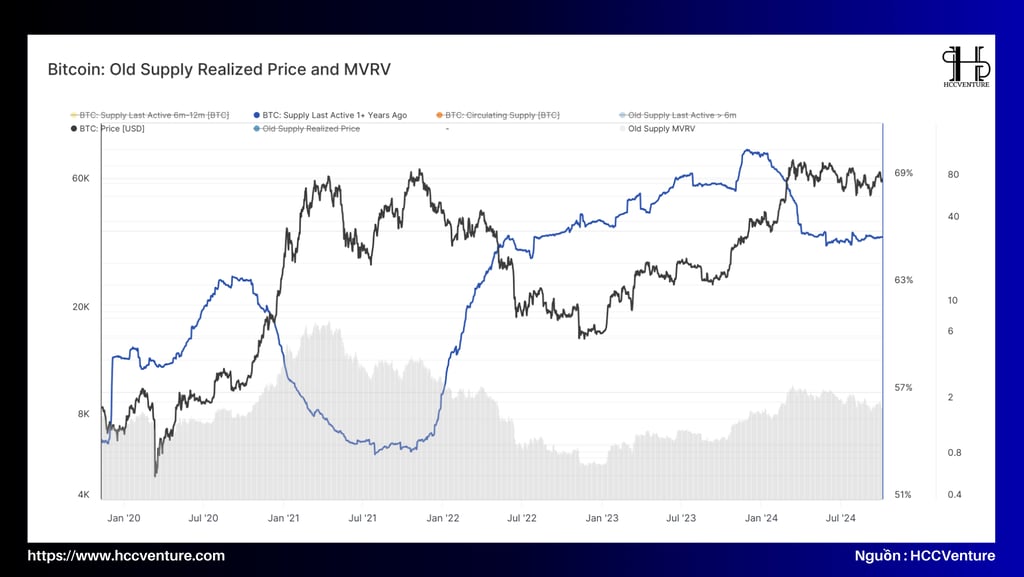
Bitcoin Supply Active 1+ Years Ago
This index measures the percentage of Bitcoin supply that has been inactive for more than a year, reflecting the accumulation or distribution trend of long-term investors.
2020-2021: During this period, the ratio of inactive supply over a year increased steadily, indicating that long-term investors accumulated Bitcoin as the price rose from around $7,000 to nearly $64,000 in April 2021.
2022: After the peak, the ratio fell slightly as some long-term investors took profits during the price correction, with the price falling to around $30,000 by mid-year.
2023-2024: The ratio of inactive supply over one year increases again, reaching a new high, indicating strong accumulation as Bitcoin price recovers and reaches a new peak at $99,400 by the end of 2024.
Old Supply MVRV:
MVRV (Market Value to Realized Value) measures the amount of unrealized profit or loss an investor has. “Old Supply MVRV” focuses on coins that have been inactive for a long period of time, typically a year or more.
2020-2021: Old Supply MVRV surges, indicating high unrealized profits for long-term investors as Bitcoin price rises.
2022: This index falls as prices correct, indicating a decline in unrealized profits for long-term investors.
2023-2024: Old Supply MVRV rebounds, reflecting high unrealized profits as Bitcoin price hits new highs.
The increase in the ratio of supply that has been inactive for over a year along with a high Old Supply MVRV indicates that long-term investors have strong confidence in Bitcoin's upside potential. However, when Old Supply MVRV reaches a high level, the market may face profit-taking pressure, leading to a price correction. Therefore, monitoring these indicators helps investors better understand market sentiment and make rational investment decisions.

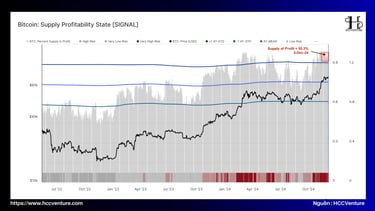
Percent of Supply in Interest (PSIP) Index and Bitcoin Market Risk
The Percent of Supply in Profit (PSIP) metric measures the percentage of Bitcoin supply that is held in unrealized profit. It is an important tool for assessing market cycles and identifying potential selling pressure, as investors tend to take profits during periods of large gains.
PSIP Risk Level Classification:
🔴 Very High Risk (PSIP > 90%) : More than 1 standard deviation above the historical average.
High Risk (75% < PSIP ≤ 90%) : Higher than historical average but not too extreme.
Low Risk (58% < PSIP ≤ 75%) : Below average but still above the lower bound.
⚫️ Very Low Risk (PSIP < 58%) : More than 1 standard deviation below historical average.
During the recent rally, the PSIP index exceeded 90%, putting the market in the Very High Risk zone ( 🔴 ) . This phase often coincides with the “euphoria phase” of a bull market. However, historically, this is also a time when large corrections are likely to occur due to increased profit-taking pressure.
Current PSIP: 92%, significantly higher than historical average (~72%). In previous cycles, PSIP levels > 90% typically lasted an average of 4-6 weeks before correcting, with an average 20% to 30% price drop thereafter.
Investors should be cautious as selling pressure may increase as more people seek to realize profits. Breaking above the high-risk zone does not necessarily signal an immediate reversal, but history shows that this is a time when sharp corrections are likely to occur.
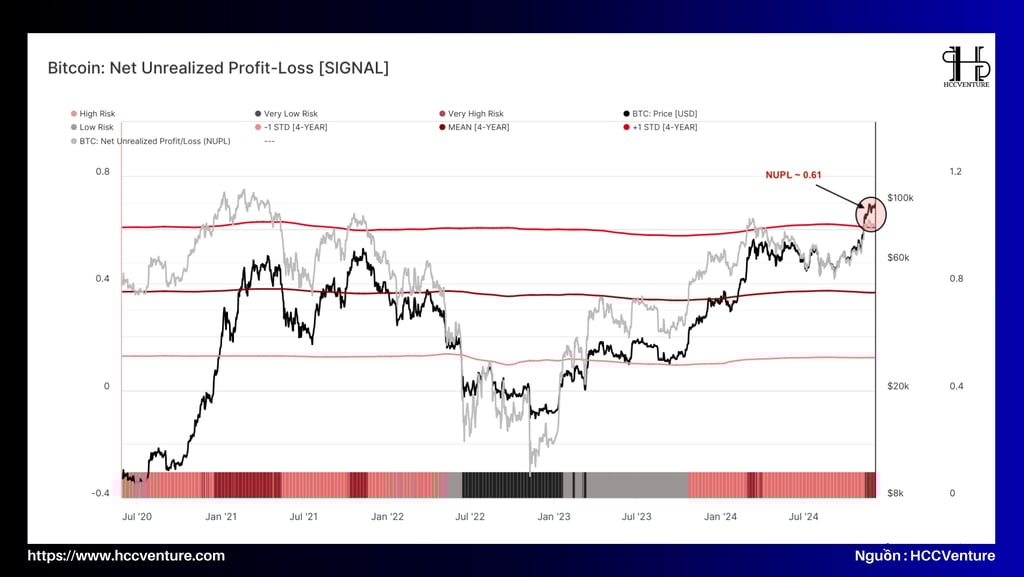
Analyzing NUPL (Net Unrealized Profit/Loss) Index and Bitcoin Market Sentiment
The NUPL (Net Unrealized Profit/Loss) index measures the total unrealized profit or loss of the market as a percentage of market capitalization. It is an important indicator that reflects the psychological state of investors, ranging from optimism, excitement to fear, depending on the level of unrealized profit.
Risk Classification according to NUPL
Very High Risk (NUPL > 0.59): Extremely large unrealized profits, exceeding 1 standard deviation above the 4-year average. Often accompanied by euphoria and risk of sharp correction.
High Risk (0.35 < NUPL ≤ 0.59): The market is profitable but has not reached euphoria.
Low Risk (0.12 < NUPL ≤ 0.35) : Moderate returns, often seen in stable or early recovery phases.
Very Low Risk (NUPL < 0.12): Capitulation phase, often occurring at the bottom of a bear market.
When Bitcoin price crossed $88k, the NUPL index entered the Very High Risk zone ( 🟥 ) , reaching 0.61. This period reflects large unrealized profits, with market sentiment in a euphoric state. However, this is also a time when the risk of price correction increases due to strong profit-taking pressure.
The NUPL average for the past 4 years has been consistently around 0.42. In previous cycles, when NUPL crossed 0.59, the market typically experienced a 15% to 25% correction within 3-5 weeks. If profit-taking spreads, Bitcoin price could retrace to the $74k - $80k area , where there is a strong cluster of support demand.
The NUPL index currently shows that the market is vulnerable to selling pressure from profit-taking investors. This is an important warning signal, although prices may still increase in the short term, the risk of a major correction is present. Investors should consider carefully managing risks during this period.
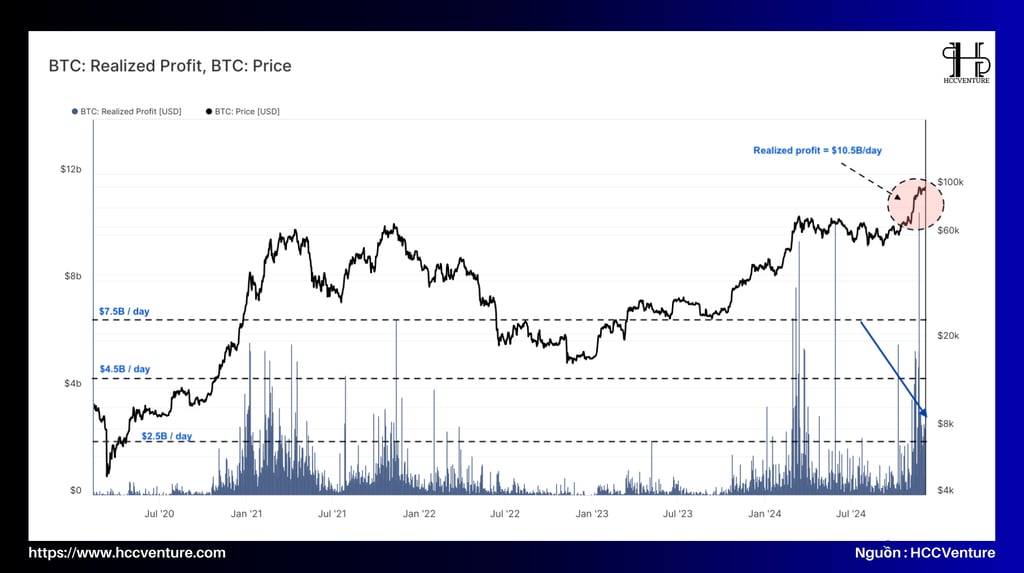
Realized Profit và Futures Funding Rates
Realized Profit:
Peak: Hit $10.5 billion per day during the period of price approaching $100k.
Current: Down to about $2.5 billion/day, a 76% drop .
Comment: This sharp decline shows that the initial profit-taking pressure was spontaneous and not sustained. This may facilitate short-term stability as a large number of investors have realized profits.
Futures Funding Rates:
This index measures the degree of leverage in the market.
Current: Decreasing, indicating less extreme need for leverage.
Comment: The cooling of Funding Rates signals a more balanced market, reducing the risk of excessive demand.
The rapid decline in Realized Profit and Funding Rates indicates that selling pressure and the need for leverage are easing. This is a positive sign for short-term price consolidation, although the market still faces risks from large unrealized profit areas. Investors should continue to monitor the developments of these indicators to assess the strength of the next trend.
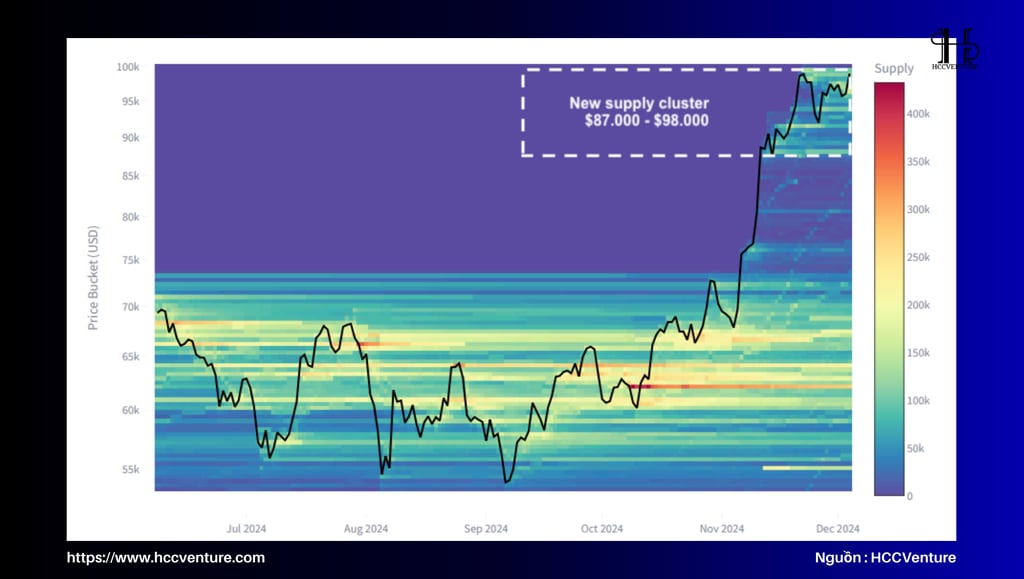
Bitcoin Cost Basis Distribution (CBD) and Supply-Demand Dynamics in Price Discovery Phase
Bitcoin Cost Basis Distribution (CBD) is a new metric that tracks the concentration of supply at different price points in a heat map format. This metric provides insight into how supply is redistributed over time, identifying key areas of demand and investor interest.
A large supply cluster is forming around $87k - $98k , indicating strong trading concentration at this price level. Very little supply changed during the rally to $87k, indicating a strong rally without large distribution from sellers.
Equilibrium phase:
Currently, the market is still finding a balance between buyers and sellers in the $87k - $98k range . This reflects the uncertainty in market sentiment as prices approach new highs.
"Air-pocket" risks:
Below $87k , there is very little supply moving, creating an “air-pocket” of support. If the price falls below this zone, strong selling pressure could emerge due to the lack of supporting demand clusters.
The $87k area is now acting as an important short-term support level. If this area is broken, the price could quickly test the lower levels (around $74k - $80k ) where the previous demand cluster was located. Watching the change in the supply cluster at these price levels will help to better assess whether the market will continue its upward momentum, or start a deeper correction.
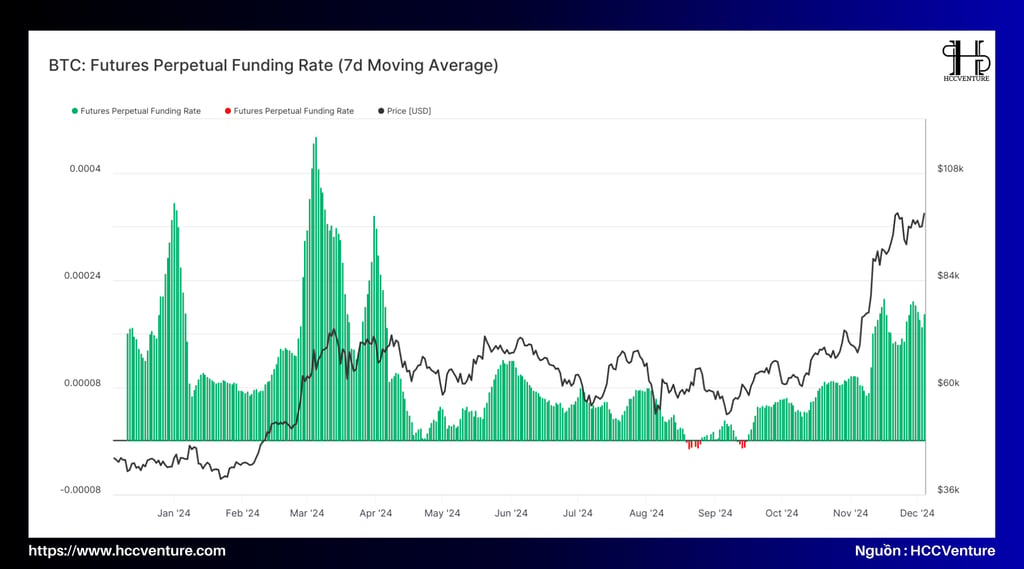
Funding Rates and Perpetual Futures Market Dynamics
Funding Rates measure the interest cost of holding perpetual futures contracts and are often used to gauge speculative demand and leverage pressures. In the current context, the metric provides insight into the balance between longs and shorts.
During the recent bull run, Funding Rates increased sharply, but the increase did not reach the extreme levels as in March this year. This shows that the market has increased speculation, but has not reached alarming levels.
March 2023: Funding Rates spike above 0.25% every 8 hours, leading to a major correction after liquidation pressure from long positions spiked.
Currently: Funding Rates hover around 0.10% every 8 hours, significantly lower than previous high-risk periods.
The slowdown in Funding Rates is a positive sign for short-term stability, minimizing the risk of selling pressure. However, be wary of sudden increases in Funding Rates, which could signal the return of high leverage risks.
Evaluation and Conclusion
Indicators such as Net Unrealized Profit/Loss (NUPL) and Percent of Supply in Profit (PSIP) show that the majority of supply is in profit, increasing the possibility of profit-taking from investors. When the market enters the “euphoric” zone, the possibility of a correction becomes higher, especially when new supply increases from selling pressure.
Realized profits fell from a peak of $10.5 billion/day to around $2.5 billion/day (-76%). This sharp decline suggests that initial selling pressure has eased, which could help stabilize the market. Funding Rates are also stabilizing, reflecting a decrease in leverage demand, helping to balance the market.
$88k level, this is the base of the most important supply cluster right now. The supply cluster in the $88k - $98k area represents a large concentration of trading, creating an important support base if the price corrects.
If the price drops below $88k, the market could face the risk of losing strong support due to low trading volume below this level. This could lead to a correction towards deeper support zones like $74k - $80k.
Bitcoin is in a crucial phase as it breaks past its previous highs and enters price discovery territory. Despite signs of cooling off, correction risks remain. Investors should closely monitor market indicators and key price zones to make appropriate decisions.
Join the HCCVenture community to get the latest market information. Once again, we give our opinion on potential projects in the crypto market. This is not investment advice, consider your portfolio. Disclaimer: The views expressed in this article are solely those of the author and do not represent the platform in any way. This article is not intended to be a guide to making investment decisions.
API & Data : Glassnode
Compiled and analyzed by HCCVenture
Join our telegram community: HCCVenture
Explore HCCVenture group
HCCVenture © 2023. All rights reserved.


Connect with us
Popular content
Contact to us
E-mail : sp_contact@hccventure.com
Register : https://linktr.ee/holdcoincventure
Disclaimer: The information on this website is for informational purposes only and should not be considered investment advice. We are not responsible for any risks or losses arising from investment decisions based on the content here.
TERMS AND CONDITIONS • CUSTOMER PROTECTION POLICY
ANALYTICAL AND NEWS CONTENT IS COMPILED AND PROVIDED BY EXPERTS IN THE FIELD OF DIGITAL FINANCE AND BLOCKCHAIN BELONGING TO HCCVENTURE ORGANIZATION, INCLUDING OWNERSHIP OF THE CONTENT.
RESPONSIBLE FOR MANAGING ALL CONTENT AND ANALYSIS: HCCVENTURE FOUNDER - TRUONG MINH HUY
Read warnings about scams and phishing emails — REPORT A PROBLEM WITH OUR SITE.