On-chain Analysis Week 48 / 2024: LTH Distribution Signs
After a series of consecutive All-Time Highs (ATHs), Bitcoin is now just inches away from hitting $100k per coin. Explosive price movements often result in investors’ unrealized profits rising sharply. In this context, Long-Term Holders are stepping up their Bitcoin allocations to capitalize on the trend.
11/30/20246 min read
Overview
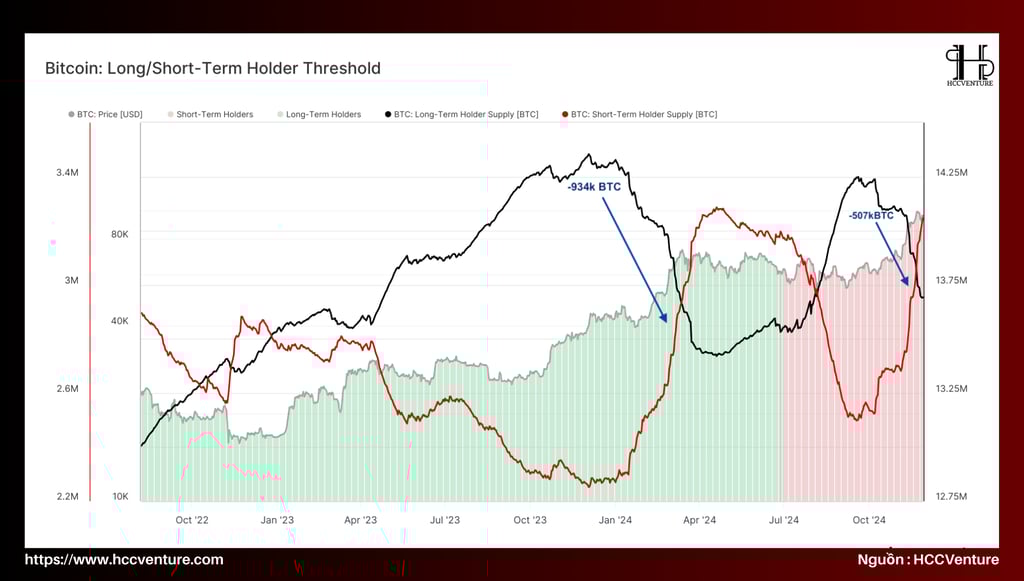
As Bitcoin neared $100k, long-term investors began selling more than 507k BTC. This is lower than the 934k BTC sold during the March bull run, but still a significant amount.
Long-term investors are taking profits in large volumes, setting a new all-time high (ATH) with $2.02 billion in realized profits per day.
When analyzing the composition of the entities that are selling, the majority of this selling pressure comes from Bitcoins that have been held for between 6 months and 1 year.
The total Bitcoin supply held by LTH remains high at around 14.4 million BTC, accounting for over 75% of the total circulating supply. This demonstrates that despite the distribution, the majority of LTH still maintains confidence in Bitcoin's long-term growth potential.
On the other hand, the Reserve Risk index – which measures investors' selling momentum relative to their holding confidence – remains in the "low" zone, indicating that many investors are still not under strong selling pressure despite high prices.
Join HCCVenture to review some on-chain indicators showing the distribution of LTH and signs of profit-taking from STHs increasing rapidly through the following analysis.
On-chain metrics
After a series of consecutive all-time highs (ATHs), Bitcoin price is now just inches away from the impressive $100k per coin milestone.
Like previous cycles, a group of Long-Term Holders (LTH) took advantage of the influx of liquidity and strong demand to begin redistributing their holdings on a large scale.
Since LTH’s Bitcoin supply peaked in September, the group has distributed a total of 507k BTC. While this is a significant number, it is still smaller than the 934k BTC sold during the ATH rally in March 2024.
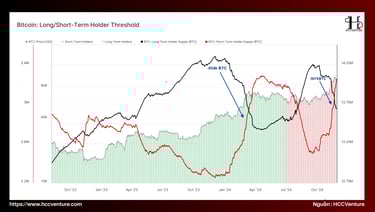
LTH-Held Supply: Currently at around 14.4 million BTC, representing over 75% of the total circulating supply. This shows that the majority of Bitcoin is still in the hands of long-term holders, despite the increase in distribution.
Supply held by STH: Accounts for around 3.6 million BTC, but shows signs of a slight increase as some of the BTC sold by LTH has been transferred to short-term investors.
Note: The Long/Short-Term Holder Threshold index (the threshold between long-term and short-term investors) plays an important role in analyzing investor behavior. Currently, this threshold is determined at 155 days (~ 5 months). By definition, coins held for more than 155 days will move from "short-term" (Short-Term Holder - STH) status to "long-term" (LTH) status.
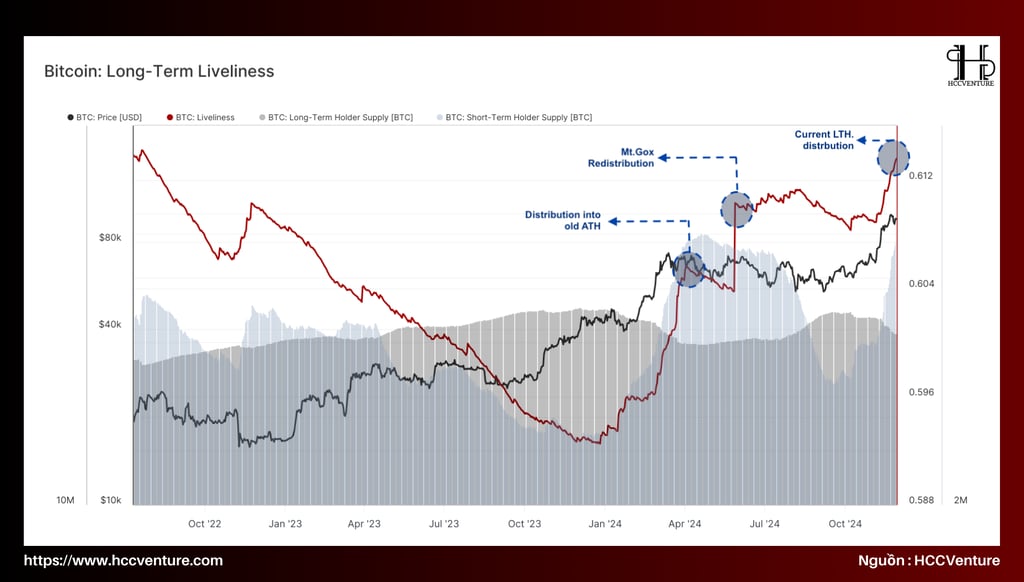
Liveliness is an on-chain metric that measures the balance between HODLing behavior and trading activity of investors.
If the Liveliness index increases: It shows increased trading activity, which means many old coins are being moved or sold.
If the Liveliness index decreases: Shows that coins are accumulating and trading less, reflecting the HODLing trend.
Distribution and profit taking phases in 2024:
-> March 2024: The period when Bitcoin reached its old ATH at 73k USD, LTH sold 934k BTC.
-> October 2024: Mt.Gox disintegration phase to dump 131k BTC.
-> Current stage: more than 507k BTC are being distributed.
Distribution Level (Low Coinday Destruction): This indicates that the majority of BTC is distributed by “younger” coins (average age around 6 months) rather than older coins (over 5 years).
The slight increase in LTL as 6-month old coins are traded reflects some profit-taking sentiment as prices approach $100k. However, this is not enough to erode the overall confidence of the LTH group.
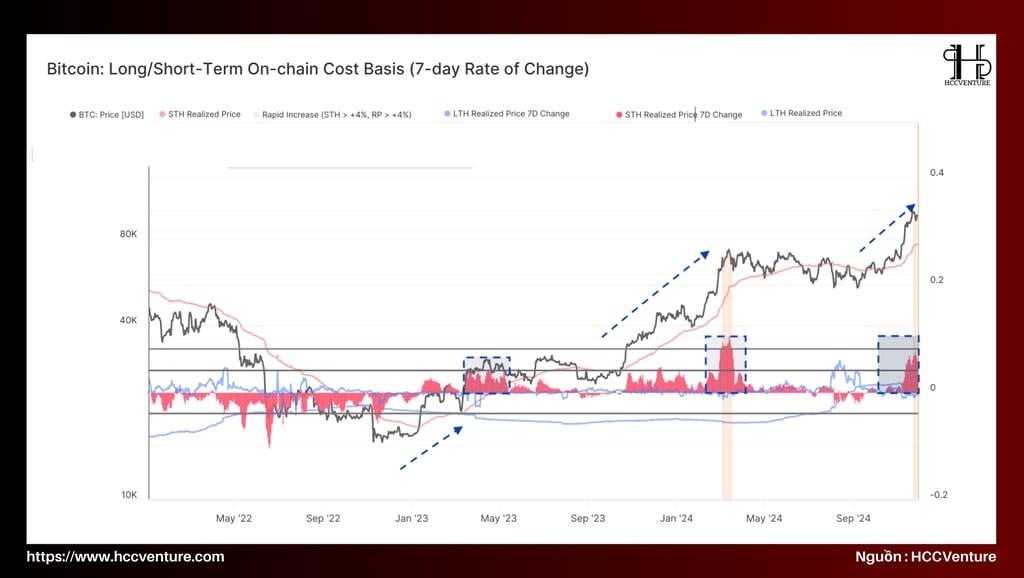
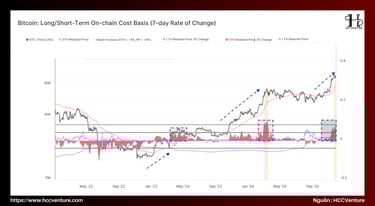
The Long/Short-Term Holder Cost Basis is the average on-chain cost of Bitcoin calculated separately for two groups of STH and LTH investors.
When the STH Cost Basis increases faster than the LTH, this usually signals new money from short-term investors, typically during early bull runs. When the two indicators converge, it usually indicates corrections or re-accumulation.
2022 (Bear Market):
STH's cost of capital has fallen rapidly, reflecting pressure from major events such as the collapse of Luna and FTX.
LTH cost price is more stable, but some LTH still distribute in the period of sharp decline.
2023 (Recovery from Bear Market):
Bitcoin price recovered strongly from ~$16k to ~$30k, increasing STH capital value rapidly.
LTH continues to HODLing, LTH capital price increases slower.
Major price corrections (August 2023) cause STH and LTH to converge.
2024 (Growth towards $100k):
The rate of change of STH and LTH is clearly different when the price increases sharply.
STH has a rapidly changing rate, reflecting short-term trading activity.
LTH recorded a change in the growth rate as some investors took profits, especially in the March and September 2024 periods.
This reflects
High rates of change in STH are often accompanied by spikes in trading activity, which can cause strong selling or buying pressure.
High change rate in LTH is an important signal that LTHs are distributing or adjusting their holding strategy.
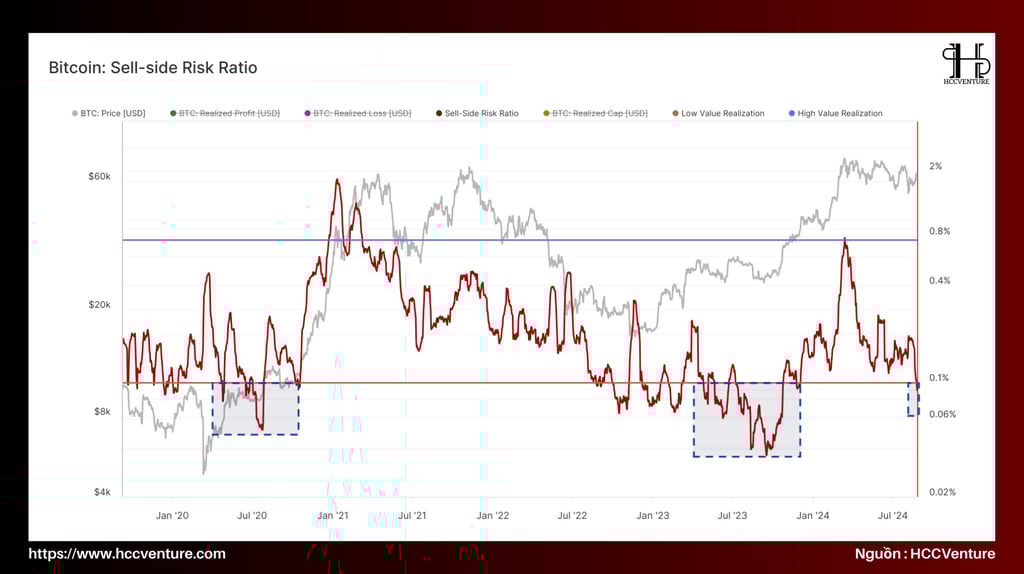

Sell-Side Risk Ratio is an index that measures the imbalance between selling supply and buying demand in the market. This index helps assess the level of risk from the sellers (holders) and the market's absorption capacity, reflecting the selling pressure in the market.
High Sell-Side Risk Ratio: Indicates high supply from sellers, which could create downward pressure on prices if there is not enough buying demand to absorb it.
Low Sell-Side Risk Ratio: Indicates that buying demand is strong enough to absorb supply, which can be a positive signal for price.
Key SSRR Phases:
2022 (Bear Market): Throughout 2022, Bitcoin price continuously decreased from ~$48k (January) to a bottom of ~$16k in November. Large selling volume from both LTH and STH amid the market crash (e.g. FTX and Luna).
2023 Phase (Bull Market): As Bitcoin begins to recover from the bottom of ~$16k to ~$30k in 2023, the SSRR index decreases, indicating a decrease in selling supply and strong buying demand.
2024 Phase (Towards $100K): As Bitcoin price continues to rise from ~$30k to near $100k, the SSRR reflects strong distribution from LTHs. However, demand is still strong enough to absorb the selling, keeping the SSRR from rising too high.
As Bitcoin approaches $100k, some selling pressure from LTH may increase, but with a large amount of demand from long and short term investors, SSRR still does not pose a major risk to the price.
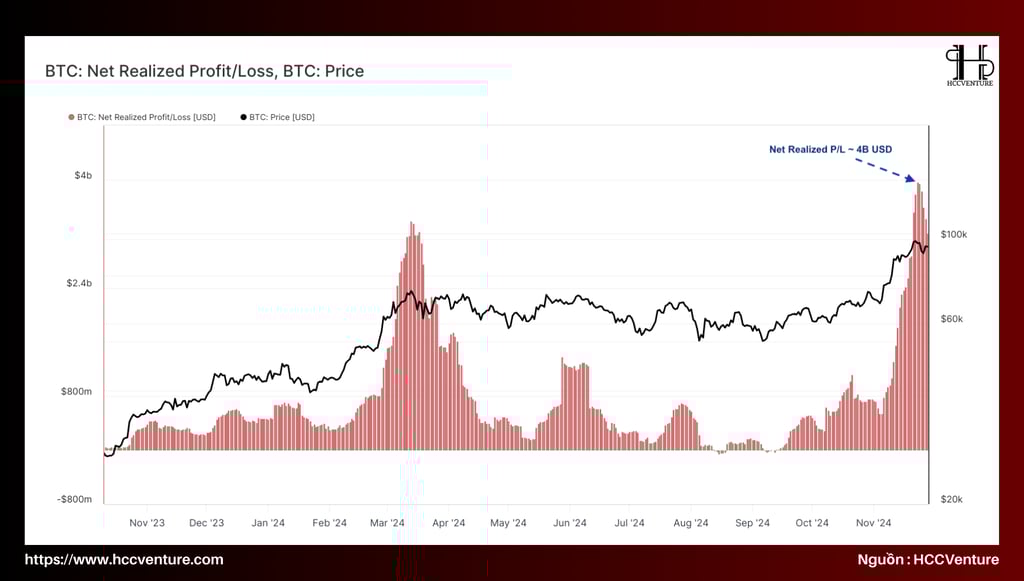
Net Realized Profit/Loss (NRPL) is the difference between total realized profits and total realized losses. This indicator provides insight into market performance, specifically investor strength and overall market sentiment.
As Bitcoin continued its meteoric rise from $30k to nearly $100k by early 2024, Net Realized Profit hit record highs.
Realized Profits Peak: This indicator shows that long-term investors (LTH) are realizing profits after years of HODLing, especially when prices surpass previous highs (ATHs).
LTH surge: LTHs sell part of their assets when prices are high, recording large realized profits, especially in March and September 2024.

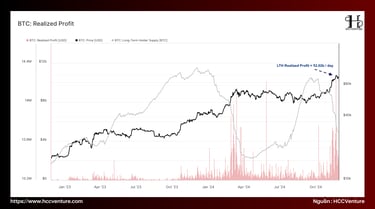
Realized Profit represents the selling behavior of Bitcoin investors, especially long-term (LTH) or short-term (STH) investors when Bitcoin price changes significantly.
Following Bitcoin's halving event in April 2024, the price has surged, leading to an increase in realized profits as long-term investors (LTH) and short-term investors (STH) have chosen to sell to realize profits.
With the sharp increase in Realized Profit, it can be seen that investors have taken profits after strong bullish periods. This may cause some selling pressure in the short term, but also shows that the market has high liquidity and solid investment behavior.
However, it is also necessary to pay attention to the risk of short-term price adjustment if the amount of realized profits is too high and investors take too many profits, creating selling pressure in the market.
Evaluation and Conclusion
The Bitcoin market has seen significant growth since early 2024, with prices surpassing nearly $100k, generating a large amount of Realized Profit . Long-term investors (LTH) have realized profits after years of accumulation, making the market highly liquid.
Selling pressure from LTH has adjusted reasonably, not creating too much disruption in the short term. The market is still strong enough to absorb supply from profit-taking investors.
Some selling pressure appears as investors take profits. This could lead to a short-term price correction, although not a major one.
However, with new money inflows and strong participation from large institutions, the Bitcoin market can continue to maintain a long-term growth trend. The high Net Realized Profit index and the stability of SSRR are positive signals for the ability to maintain high prices and sustainable development.
Join the HCCVenture community to get the latest market information. Once again, we give our opinion on potential projects in the crypto market. This is not investment advice, consider your portfolio. Disclaimer: The views expressed in this article are solely those of the author and do not represent the platform in any way. This article is not intended to be a guide to making investment decisions.
API & Data : Glassnode
Compiled and analyzed by HCCVenture
Join our telegram community: HCCVenture
Explore HCCVenture group
HCCVenture © 2023. All rights reserved.


Connect with us
Popular content
Contact to us
E-mail : sp_contact@hccventure.com
Register : https://linktr.ee/holdcoincventure
Disclaimer: The information on this website is for informational purposes only and should not be considered investment advice. We are not responsible for any risks or losses arising from investment decisions based on the content here.
TERMS AND CONDITIONS • CUSTOMER PROTECTION POLICY
ANALYTICAL AND NEWS CONTENT IS COMPILED AND PROVIDED BY EXPERTS IN THE FIELD OF DIGITAL FINANCE AND BLOCKCHAIN BELONGING TO HCCVENTURE ORGANIZATION, INCLUDING OWNERSHIP OF THE CONTENT.
RESPONSIBLE FOR MANAGING ALL CONTENT AND ANALYSIS: HCCVENTURE FOUNDER - TRUONG MINH HUY
Read warnings about scams and phishing emails — REPORT A PROBLEM WITH OUR SITE.