On-chain analysis week 47/2025: Capital flow declines - LTH simultaneously takes profits
Bitcoin continues to weaken as spot demand slows, ETFs turn to net outflows and the market structure tilts heavily toward the defensive, slipping below “cost of capital” models.
11/23/202510 min read
Market Summary
Bitcoin has fallen below the Short-Term Holder Cost Basis (STH CB) and even below the -1 standard deviation band. History has shown that this area is associated with a sharp increase in selling pressure when short-term sentiment weakens and market confidence is tested.
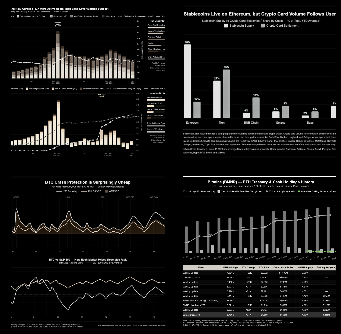
US spot ETF data continues to show steady net outflows, with no new inflows from traditional institutions. Many sessions saw outflows of between -$300 million and -$500 million , with no inflows large enough to offset the losses. ETF trading volumes also fell to their lowest in about three months.
The DVOL volatility index has rebounded to its highest level in a month, reflecting expectations of continued volatility expansion. Put options are now trading at a premium, suggesting investors are willing to pay more to buy downside protection – a clear sign that the market is re-pricing tail-risk.
With supply and demand imbalances and institutional caution, the market is likely to remain volatile but lacking in growth momentum. Until conditions improve, Bitcoin will continue to operate in a defensive environment with the possibility of more volatility.
Analyzing on-chain metrics
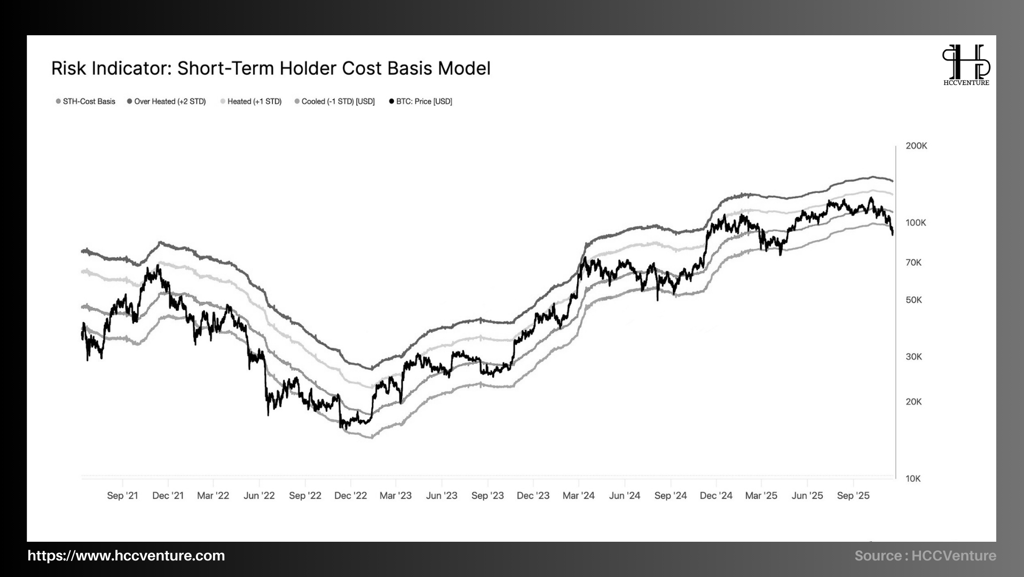
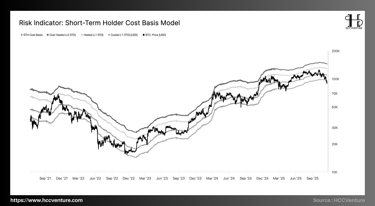
Bitcoin has fallen across the entire Short-Term Holder (STH) cost model cluster, breaking the -1 standard deviation band as well, signaling that the market structure has shifted into a state of widespread realized loss pressure.
According to the STH Cost Basis model, the average cost of capital for the recent group of buyers is around ~$109.5k , while the market price has fallen as low as $82k . This creates a huge discount and takes BTC completely outside the -1 STD band—the weakest level since the August–September 2024 correction, and also the first time since early 2023 that Bitcoin has traded completely below the entire STH cost range.
History shows that whenever the price breaks through the −1 STD band (like the periods of May 2021 and June 2022), the market usually remains in a state of imbalance for a few weeks before forming a bottom.
The STH group's supply absorption capacity has dropped sharply as the entire group has been put in a loss-making position, causing demand to return to the market to almost paralyze.
Currently, 85–90% of the supply that has moved in the last 1–3 months is experiencing unrealized losses , reflecting a level of short-term stress similar to previous early-cycle corrections. When prices fall below -1 STD, the market typically takes 3–6 weeks to rebalance before recovering.
Spot demand on Coinbase, Kraken, and Bitstamp has also weakened significantly, as seen by spot volumes dropping 20–30% from their 90-day average . There has been no new institutional inflows coming in to support the market—which is what usually happens when STH is in a loss zone. This is what caused BTC to fail to maintain the 100K–105K range and quickly break through the 80K mark .

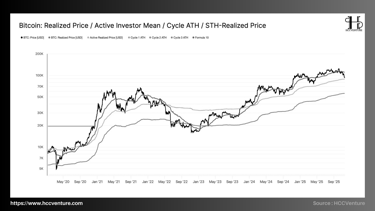
Bitcoin’s Realized Price is currently hovering around the ~$66,000 region , acting as the base price line for the entire long-term trend. Throughout the 2020–2025 cycle, the market price has only fallen below the Realized Price during the most stressful periods (March 2020, June 2022, November 2022). The fact that BTC is currently above the Realized Price line suggests that the long-term trend has not been broken. However, the gap between the market price and this line is narrowing significantly, reflecting the weakening of the buyer’s dominance and the market approaching a decisive intersection.
The key point is the Active Investor Realized Price , which is currently around ~$88,600 . This is the average cost of capital for the group of “active” investors, those who have been moving coins frequently in recent months. History shows that when the price adjusts to this group’s cost zone, the market often forms a balance zone before regaining upward momentum.
Meanwhile, the Short-Term Holder Realized Price (STH-RP) is around $109,500 – 20–25% higher than the current market price , indicating that the entire group of short-term investors are incurring losses. This is a typical signal of strong corrections. The price sliding deeply below the STH-RP and simultaneously breaking the “-1 STD band” confirms that the loss pressure has spread to the entire group of new investors.
However, the growth slope of the cycle has weakened significantly since mid-2025, coinciding with the slowdown of financial capital flows (ETFs, spot funds) and the slowdown of speculative activity. The correction of prices to the medium-term price lines shows that Bitcoin is entering a phase of "expectations rebalancing" - a period when the market needs to re-evaluate its capital base before forming a new trend.

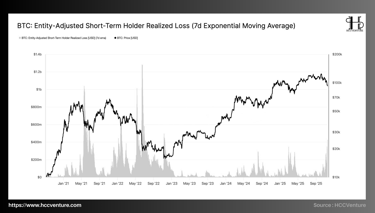
Bitcoin price has broken below the lower band of the STH Cost Basis model, while realized loss indicators recorded their highest levels since the FTX crash in late 2022. This shows that the market top structure forming around the $106,000–$118,000 region is putting heavy pressure on liquidity and confidence in the entire market.
The Entity-Adjusted STH Realized Loss (7-day EMA) indicator has spiked to $523 million per day , representing the largest realized loss since the FTX crisis in November 2022.
While the current loss is not as large as the “market capitulation” of a full bear market cycle, it is larger than the entire correction in the 2024–2025 period, reflecting a clear signal that the majority of FOMO investors at the top are falling into a state of abandonment.
During the corrections of 2024 and early 2025, STH losses were only in the range of $80–250 million/day . The current rhythm is far beyond normal levels, meaning that this is no longer a healthy correction but has turned into a period of structural pain. The market is experiencing a local panic, but not a capitulation of the entire cycle.
STH's loss is huge but has not yet surpassed its historical peak → this shows that the market is entering a "supply reset" phase. This is the most special FOMO zone of the entire cycle , where the market is forced to re-establish the supply-demand balance.
If there is no sign of a return of cash flow, the price will likely continue to slide deeper into the structural support zone of $82,000–$88,600 .
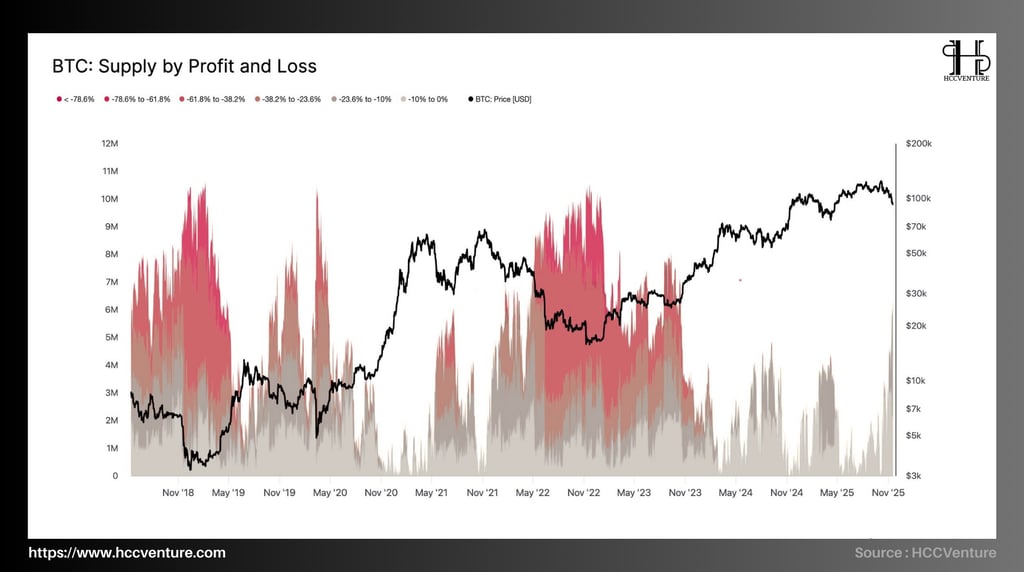
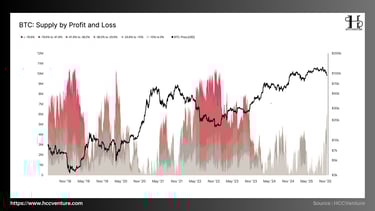
While prices have broken through a number of key short-term valuation patterns, the actual scale of losses in the market has yet to approach the extreme levels of the capitulation phase of 2022–2023, suggesting the market is in a “re-pricing” phase rather than a full-blown crash.
The latest data shows around 6.3 million BTC are in a loss — a large number, but still significantly lower than during previous severe downturns.
The current loss-making supply distribution structure is concentrated in the following groups:
The loss group from -10% to -23.6% accounts for the largest proportion.
The loss group from –23.6% to –61.8% has the smallest size.
The deeper loss supply –61.8% , which is a typical sign of capitulation, is almost absent.
Compared to Q2–Q3 2022 — when deep hole supply (>–38%) dominated and surpassed 10 million BTC — the current losses are significantly lower. This suggests that the market is under pressure, but has not yet entered a widespread panic.
The current loss distribution structure is quite similar to the early 2022 period — a period when the market fluctuated in a narrow range, lacking clear recovery signals, before entering a deep decline when macro support zones were broken. Prices moved in a “range-bound” state, showing hesitation and weak momentum.
The 88.6K – 82K zone currently acts as the “last line of defense” of the macro bullish structure. If this zone holds, the market is likely to remain in a mild downtrend before recovering. Conversely, if it is penetrated, the market structure will shift to a similar pattern to the 2022–2023 bear cycle, with wider risks and deeper losses. A drop below 82K would confirm a phase shift to a full-fledged bear market.


During the October-November period, Open Interest (OI) fell sharply from the peak of 44-45 billion USD to only about 31-32 billion USD , equivalent to a decline of more than 28% compared to the local peak. This is one of the strongest "deleveraging" phases since March 2024.
The chart shows BTC price sliding from above $120,000 to below $85,000 , while OI also plummeted. This development shows two important points:
There is no new speculative money entering the market to catch the bottom.
Existing investors close positions and reduce risk instead of adding to positions when prices fall.
In previous corrections — like August 2024 or March 2025 — OI typically drops sharply due to large-scale liquidations but quickly recovers as new speculative money emerges and leverage is re-used.
On the contrary, at present, OI has not recovered , the market has not increased reverse leverage , and there is no strong forced liquidation pressure . Instead, investors are actively withdrawing from the market. This situation shows that "low-risk bottom fishing" transactions are almost absent, and the main strategy in the market is "reducing position - reducing leverage" .
The market is operating in a defensive state, lacking all new buying power and will likely continue to fluctuate weakly until speculative money returns.

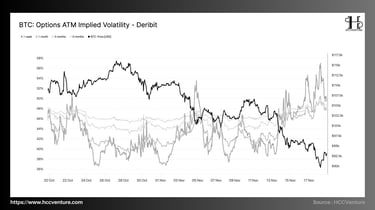
The derivatives market was the first and strongest to react to the weakening of spot prices. The continuous decline in spot prices caused a surge in demand for risk protection, forcing option pricing models to re-adjust the probabilities for tail-risk scenarios. The direct consequence was an increase in the Implied Volatility (IV) of ATM options across all maturities.
Short-term IV (1 week, 1 month) is the fastest-reacting group, jumping up sharply right after the price broke the $90,000 zone . The increase in the amplitude of IV 1W far exceeds the remaining terms, showing that the market is pricing high risks in the next few sessions.
The medium and long term (3-month, 6-month) IV also rose to new highs but in a parallel shift rather than a single spike. This reflects that the market is not only worried about the short-term shock, but is stretching the entire risk distribution over the longer term.
Level IV is now approaching — and in some short maturities has even reached — the peak recorded during the massive liquidation on October 10. This suggests that risk pricing has returned to “high alert” status, although it has not yet reached full panic.
Therefore, IV is not simply reflecting turbulence, but is indicating a systematic re-pricing of risk, where all maturities are adjusted to a new “high volatility regime”.
In the previous period, many liquidity desks and professional traders maintained short volatility/short gamma strategies (selling options to capture theta in low volatility environments). When spot prices fell rapidly, the delta of options changed dramatically, forcing them to buy back the options they had sold, or hedge inversely on spot/futures to neutralize gamma risk.
The “buying options to close positions” activity, while technical, creates an extremely strong demand force, causing short-term IV to increase faster than long-term ones — exactly the shape of the 1W and 1M IV lines on the chart.


In calm market conditions, the skew typically hovers around zero – reflecting a balance between bullish and bearish expectations. However, the fact that all four maturities recorded a deep negative skew suggests that the market is heavily biased toward defense, regardless of short-term volatility or long-term trends. At the shortest maturities:
The 25-delta put option is trading at a premium of up to 14% over the call .
This is a premium that only appears when the market is about to face adverse fluctuations or when liquidity is thin, causing defensive sentiment to increase sharply.
The increased demand for puts shows that traders are not only concerned about downside risk, but are also willing to pay very high premiums to protect their portfolios, especially when prices have penetrated many important STH cost basis zones.
Skew 1W and 1M reacted the most, suggesting concern is focused on the 7–30 day timeframe .
Longer term skew (3M–6M) is tilted down but not too negative → the market is not pricing in a deep bear market cycle like 2022, but only reflects very high short term risk.
Downside risk is fully priced in and no longer a matter of sentiment. Portfolio protection is high, reflecting the risk aversion of both traders and market makers. Dealer hedging strategies create mechanical selling pressure, making it easier for declines to be deeper and faster.
The not-so-negative long-term skew structure suggests that current risks are mainly short-term, with conditions not yet converging to form a similar deep bear market pattern in 2022.
Evaluation and Conclusion
Amidst the liquidity crunch and near-absence of spot demand, quantitative indicators related to realized loss volume, implied volatility, skew and futures position depth all point to the market moving into its most “risk-off” state since the beginning of the year.
Bitcoin’s break below the STH Cost Basis ( ~109.5K USD ) and through the –1 STD band (~95.4K USD) marked the first break point of the current bull cycle. As the price bottomed around $89K , the entire STH group fell into a loss zone — a structure that has historically been associated with waning momentum, panic, and widespread selling pressure.
The supply distribution data by loss/profit status shows that more than 6.3 million BTC are in loss status, mainly in the -10% to -23.6% group . This configuration is similar to the period in Q1 2022, when prices entered a mid-term correction zone but did not lead to a deep bear market-like decline.
The price structure weakened significantly when the STH Cost Basis was broken, spot money flow weakened sharply, while realized loss volume showed selling pressure coming from the top buying group. At the same time, the derivatives market simultaneously switched to a defensive state: implied volatility increased sharply, skew was tilted towards puts, and futures OI continuously narrowed.
Bitcoin is entering a challenging market phase as its short-term price structure weakens sharply, speculative money retreats, and the entire derivatives ecosystem shifts into defensive mode. These negative signals appear as the price breaks out of key STH cost basis models, forcing the market to reassess its entire risk structure from the ground up.
Disclaimer: The information presented in this article is the author's personal opinion in the cryptocurrency field. It is not intended to be financial or investment advice. Any investment decision should be based on careful consideration of your personal portfolio and risk tolerance. The views expressed in this article do not represent the official position of the platform. We recommend that readers conduct their own research and consult with a professional before making any investment decisions.
API & Data: Glassnode
Compiled and analyzed by HCCVenture
Join HCCVenture here: https://linktr.ee/holdcoincventure
Explore HCCVenture group
HCCVenture © 2023. All rights reserved.


Connect with us
Popular content
Contact to us
E-mail : sp_contact@hccventure.com
Register : https://linktr.ee/holdcoincventure
Disclaimer: The information on this website is for informational purposes only and should not be considered investment advice. We are not responsible for any risks or losses arising from investment decisions based on the content here.
TERMS AND CONDITIONS • CUSTOMER PROTECTION POLICY
ANALYTICAL AND NEWS CONTENT IS COMPILED AND PROVIDED BY EXPERTS IN THE FIELD OF DIGITAL FINANCE AND BLOCKCHAIN BELONGING TO HCCVENTURE ORGANIZATION, INCLUDING OWNERSHIP OF THE CONTENT.
RESPONSIBLE FOR MANAGING ALL CONTENT AND ANALYSIS: HCCVENTURE FOUNDER - TRUONG MINH HUY
Read warnings about scams and phishing emails — REPORT A PROBLEM WITH OUR SITE.