On-chain analysis week 47 / 2024: Bitcoin hits new high
Bitcoin continues to set new all-time highs (ATHs) without pause, fueled by strong inflows from both ETFs and the Spot Market. Over the past 30 days, over $62.9 billion has entered the market, demonstrating growing investor interest and confidence. This is a clear testament to Bitcoin’s maturity and appeal as a mainstream financial asset.
11/22/20248 min read
Market Summary
Bitcoin has made an impressive run to $93,000, fueled by strong inflows from ETFs and the spot market. In the past 30 days alone, the market has attracted over $62.9 billion, with Bitcoin accounting for the majority of the investment demand, affirming its growing position as a preferred investment asset amid the euphoric market.
Long-term investors also played a major role in the rally. High levels of unrealized profits prompted them to increase their selling, with around 128,000 BTC sold between October 8 and November 13. This is a common behavior when long-term investors realize profits during strong market periods.
Notably, US spot ETFs played a key role in absorbing about 90% of the selling pressure from long-term investors during this period, underscoring the growing role of ETFs not only in providing liquidity to the market but also in stabilizing prices.
The ability of ETFs to handle large Bitcoin selling volumes without causing significant volatility shows their importance as a pillar supporting Bitcoin's continued growth in financial markets.
Onchain metrics
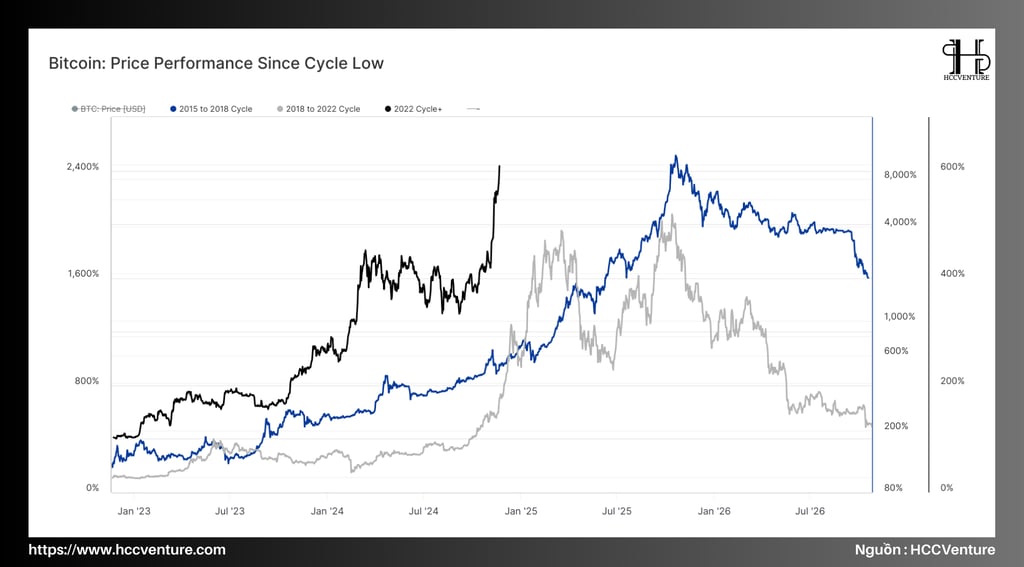
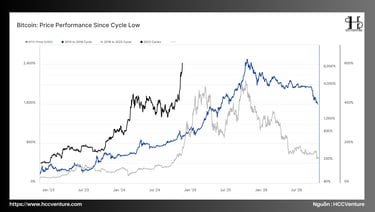
Since the beginning of November, Bitcoin prices have recorded remarkable growth, continuously setting new historical highs (ATHs) throughout the month. When comparing the price performance of the current cycle with previous cycles, namely 2015-2018 and 2018-2022, a striking similarity can be seen. Although market conditions in each cycle are significantly different, both the growth rate and the duration of the price increases have maintained remarkable stability.
This stability, spanning multiple cycles, is an interesting phenomenon that provides important insights into Bitcoin’s price behavior at the macro level and the cyclical structure of the market. This suggests that, despite short-term fluctuations due to changes in the regulatory, economic, or global environment, Bitcoin appears to follow a repeating cyclical pattern, helping investors better predict the next growth phases.
Historically, bull markets in previous cycles have typically lasted between 4 and 11 months from their current respective dates. For example, the 2015-2018 cycle lasted approximately 10 months, while the 2018-2022 cycle lasted over 8 months. This provides a useful frame of reference for assessing the momentum and potential duration of the current bull cycle, with the market likely to have room to continue its upward momentum for the foreseeable future.
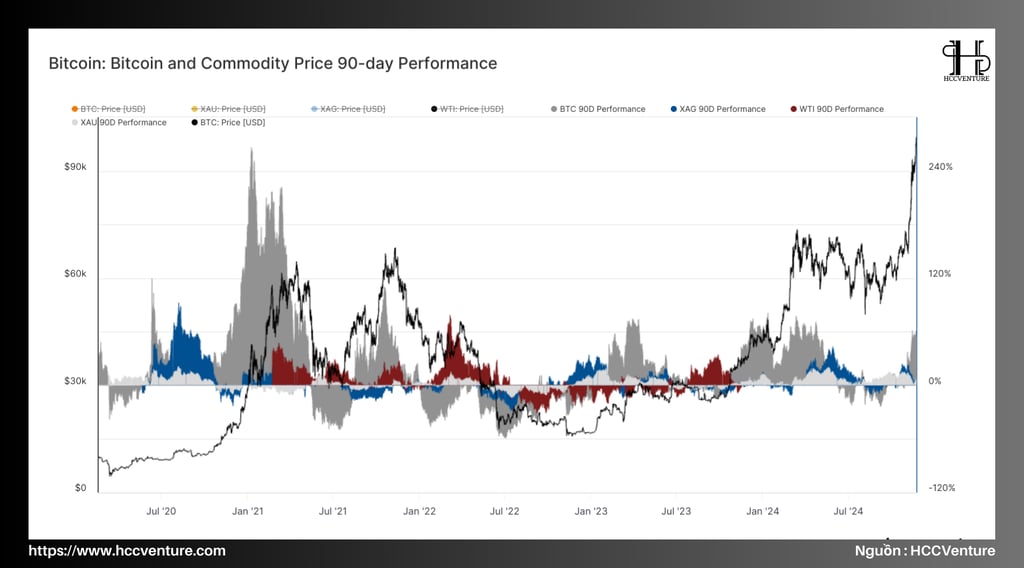
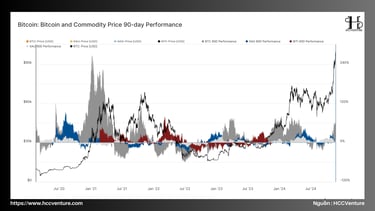
Bitcoin just set a new all-time high (ATH) this week at $93,200, bringing its quarterly performance to an impressive +61.3%. This is a gain that is several times greater than the performance of traditional stores of value such as gold (+5.3%) and silver (+8.0%) over the same period.
This apparent disparity suggests that there may be a shift in capital from traditional commodities to Bitcoin – a young asset class that has emerged as a new digital store of value. This reflects a shift in how investors view and allocate their assets, especially in a context where technology and digitization are increasingly dominant.
Bitcoin’s market capitalization has also expanded significantly, reaching a staggering $1.796 trillion, making it the 7th largest asset globally. This milestone has put Bitcoin ahead of two important iconic assets: silver, at $1.763 trillion, and oil giant Saudi Aramco, at $1.791 trillion.
Bitcoin is now just 20% behind Amazon in terms of market capitalization, making this the next major milestone on its journey to becoming the world’s most valuable asset. If it continues to grow at this rate, Bitcoin could potentially surpass Amazon in the near future, cementing its position as the leading digital asset.
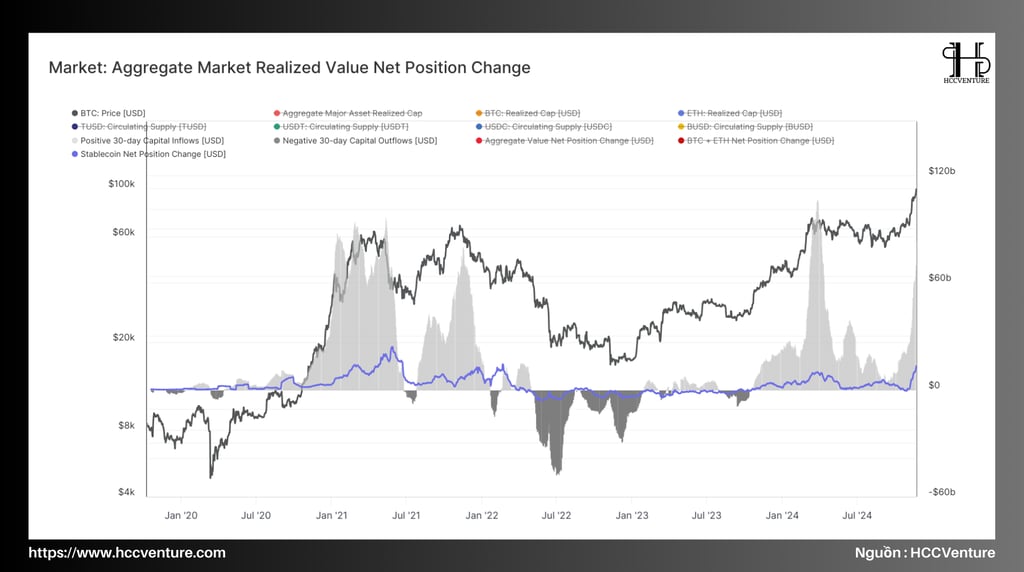
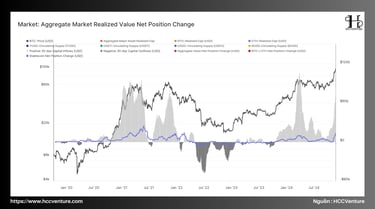
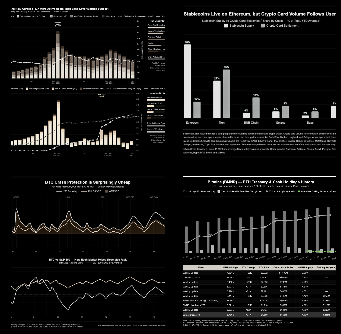
Following Bitcoin’s stellar performance over the past 90 days, the broader digital asset market is seeing significant capital inflows. Over the past 30 days, total capital inflows have reached an impressive $62.9 billion, with the Bitcoin and Ethereum networks attracting $53.3 billion, while the stablecoin supply has increased by $9.6 billion.
This growth marked the highest inflow since the March 2024 peak, reflecting renewed confidence and renewed demand following the U.S. presidential election. In particular, the concentration of capital in mainstream assets such as Bitcoin and Ethereum suggests that investors continue to view these as core platforms in their digital asset portfolios.
Additionally, the expansion of stablecoin supply with an increase of nearly $10 billion shows the increasing demand for stable digital assets, used as a means of transaction and value preservation.
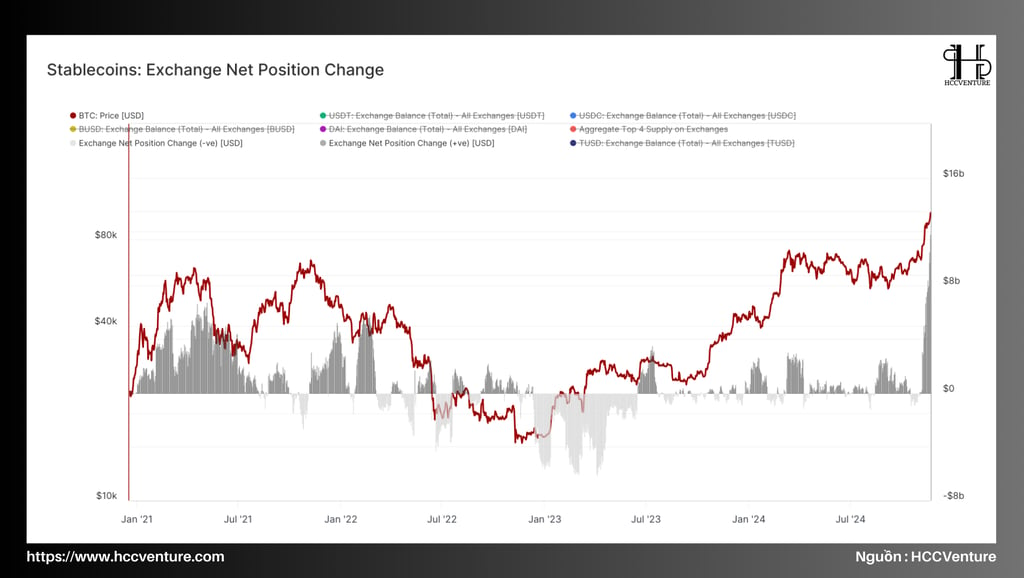
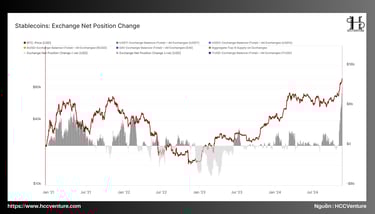
Expanding on the capital flows noted, the majority of the $9.7 billion in stablecoins issued over the past 30 days has gone directly to centralized exchanges (CEXs). This capital flow roughly matches the total amount of capital flowing into stablecoin assets over the same period, underscoring the important role of stablecoins in stimulating market activity.
The surge in stablecoins on exchanges indicates high speculative demand as investors position themselves to capitalize on current trends. This not only reinforces the bullish narrative but also reflects strong momentum following the US presidential election.
This large shift also shows that stablecoins are acting as an essential liquidity bridge, providing tools for both short-term trading and risk management in an increasingly complex digital asset market.
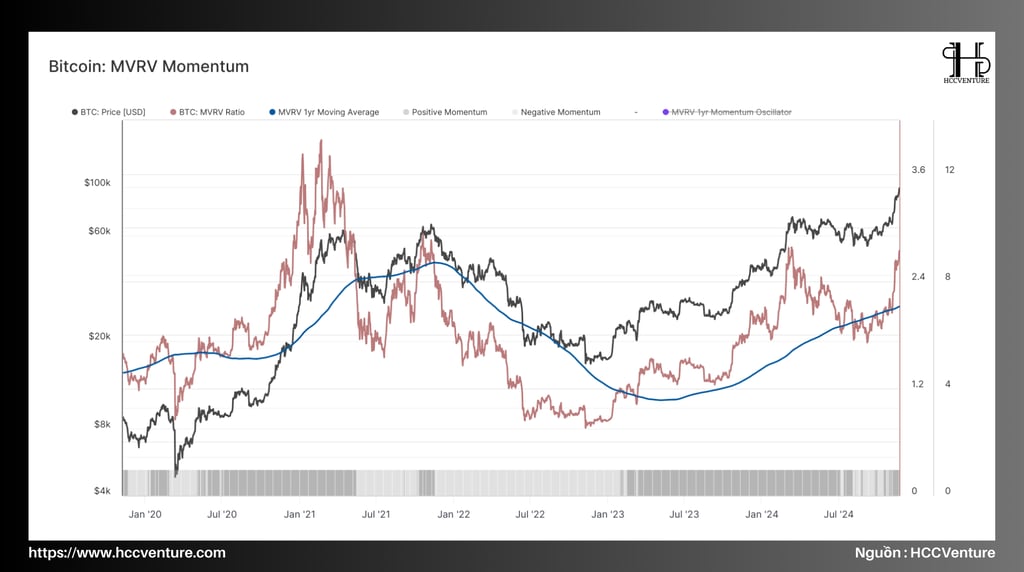
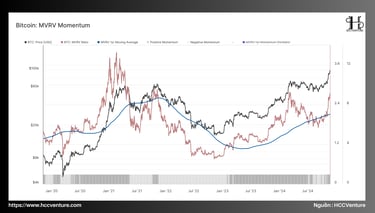
We have analyzed the increase in market liquidity, which has contributed to Bitcoin's outperformance. In the next section, we will evaluate how this price action affects investors' unrealized paper gains, using the MVRV Ratio.
When comparing the current value of the MVRV Ratio with its annual moving average, it can be seen that investor profits are increasing rapidly. This phenomenon often creates a favorable environment for maintaining the growth momentum of the market. However, it also creates conditions that make investors tend to take profits to realize unrealized profits.
This highlights an important aspect: while an increase in unrealized profits can boost bullish sentiment and capital inflows, it also carries the risk of increased selling pressure if a large number of investors decide to realize their profits.
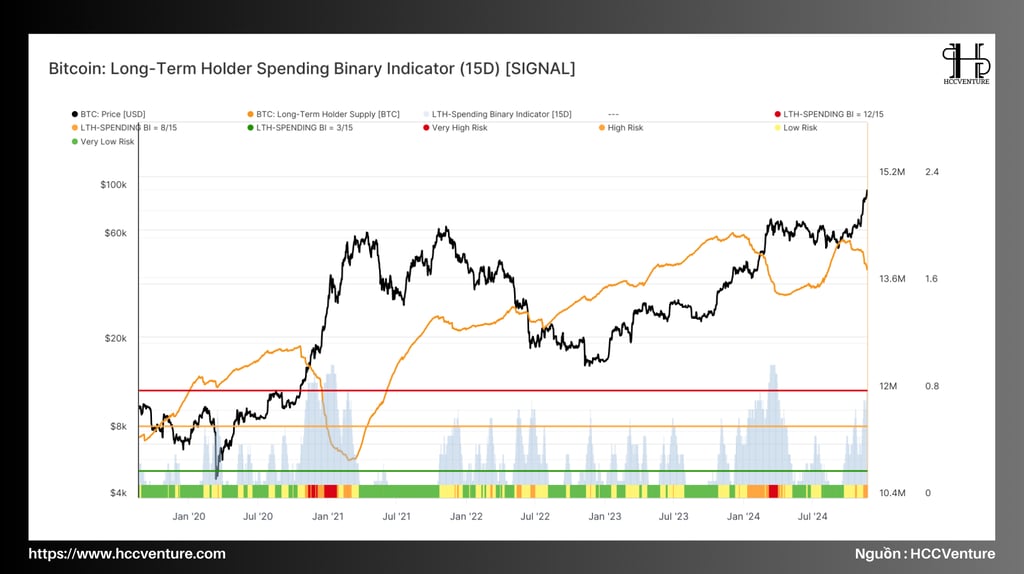

We can use the Long-Term Holder Spending Binary Indicator to gauge the intensity of selling pressure from long-term investors (LTH). This tool measures the percentage of days over the past two weeks that the spending of the group of long-term investors exceeded their accumulation, resulting in a decrease in their total holdings.
Since early September, when Bitcoin prices began to surge, spending by long-term investors has also been on the rise. With the recent rally to $93,000, the indicator reached a value that shows that LTH has sold 11 days in the past 15 days, leading to a decrease in their holdings.
This indicates an increase in distribution pressure from long-term investors, although it has not reached the intensity of the price peaks in March 2021 and March 2024. This distribution reflects long-term investors realizing profits as prices rise sharply, but is not a strong signal for a major sell-off.
Having identified the increased spending behavior of long-term investors, we can use the next tool to further analyze their activity around key market turning points. The relationship between profit taking and unrealized profits can help clarify their role in shaping the transitional phases of the market cycle.
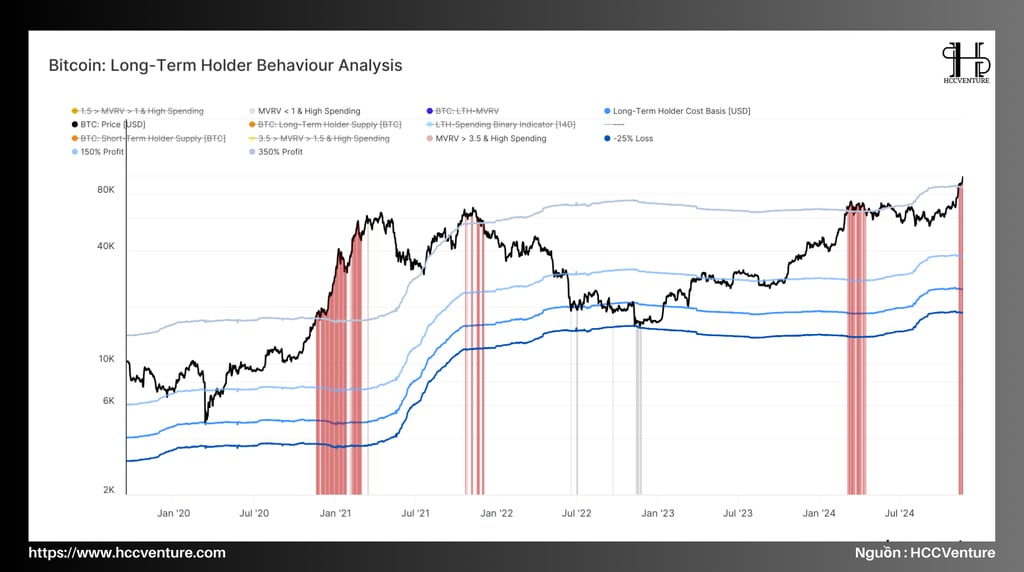
The diagram below illustrates the following factors:
LTH Strike Price : The average price at which long-term investors bought Bitcoin.
Profit/Loss Bands : Bands that represent extremely high profit levels (+150%, +350%) and loss levels (-25%) often trigger significant spending activities.
Take Profit : Stages when long term investors have profits above +350% and start increasing spending.
Capitulation : Periods of strong spending from long-term investors in a loss state above -25%.
Since Bitcoin price crossed the +350% gain level (equivalent to $87,000), we have seen significant profit-taking from this group of long-term investors. Distribution pressure from them is likely to increase as the market continues to grow, and unrealized profits continue to expand.
This reflects an important sign, as in previous bull cycles, this has often been the start of the strongest growth phase in bull markets, when unrealized profits for long-term investors can reach over 800% in the 2021 cycle.
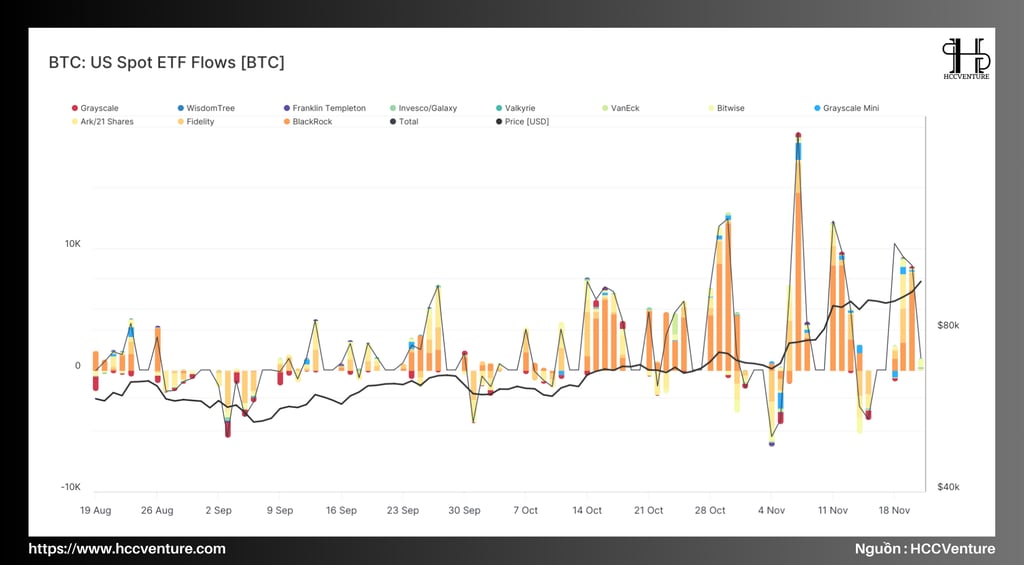
We now turn our attention to the role of institutional investors in the market, particularly through US Spot ETFs. These ETFs have become a major source of demand in recent weeks, absorbing much of the selling from long-term investors (LTHs). This relationship also highlights the growing influence of institutional demand in shaping the modern Bitcoin market structure.
As mentioned in the on-Chain Week 46 report, since mid-October, ETF inflows have surged, reaching between $1 billion and $2 billion per week. This is a significant increase in institutional demand, and one of the largest inflow periods to date.
This shows a strong shift in the Bitcoin market, as institutional investors, through ETFs, are playing an important role in providing liquidity and maintaining stability for the market.
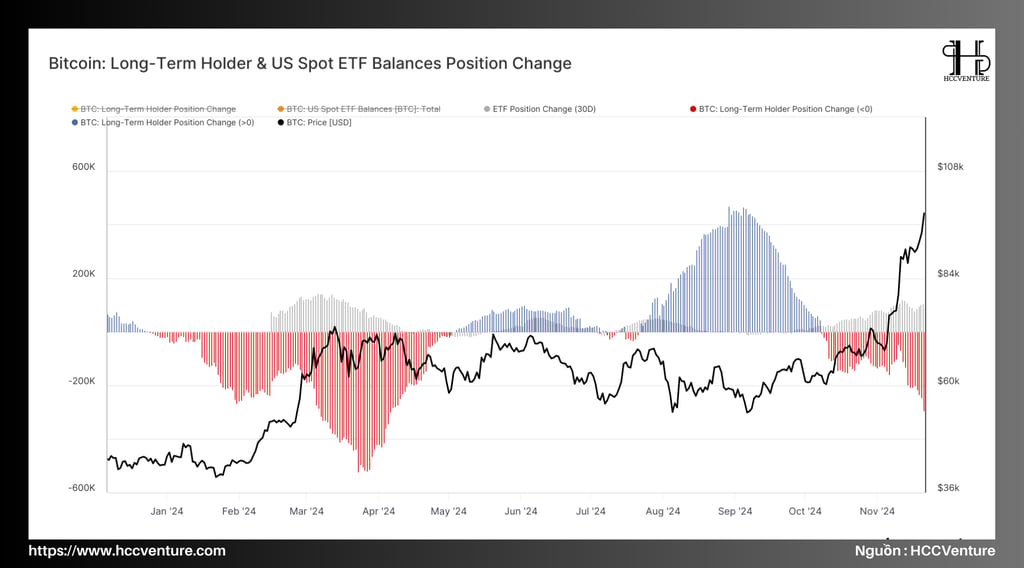
To visualize the counterbalancing forces between selling pressure from long-term investors (LTHs) and demand from ETFs, we can analyze the change in Bitcoin balances of each group over the past 30 days.
The chart below shows that between October 8 and November 13, ETFs absorbed about 128,000 BTC, accounting for about 93% of the total net selling pressure of 137,000 BTC from long-term investors. This highlights the important role that ETFs play in stabilizing the market during periods of strong sell-offs.
However, since November 13, selling pressure from long-term investors has begun to exceed net inflows from ETFs, reflecting a similar pattern to that seen in late February 2024. At that time, the imbalance between supply and demand led to increased market volatility and consolidation.
Evaluation and Conclusion
Bitcoin’s rally to $93,000 has attracted massive capital inflows into the digital asset market, with a total of $62.9 billion inflows over the past 30 days. This is an impressive figure, indicating a strong recovery in the Bitcoin market, especially as financial institutions through spot ETFs in the US have led the way in driving demand. A significant portion of this capital inflow may come from investors withdrawing capital from traditional assets such as gold and silver.
Spot ETFs have absorbed about 90% of the selling from long-term investors (LTH), helping to reduce selling pressure and maintain market stability. However, given the extremely high unrealized profits of LTH, it can be predicted that the spending trend of this group will increase.
Specifically, during the period from October 8 to November 13, LTH sold approximately 137,000 BTC, with 128,000 BTC of which were absorbed by ETFs, accounting for 93% of the total sales from LTH. This is a clear demonstration of the role of ETFs in stabilizing the market during a period of increased spending from LTH.
However, since November 13, selling pressure from LTHs has begun to exceed inflows from ETFs, which could lead to a short-term correction in the market, especially as the LTH spend ratio increases, reflecting a trend that could lead to a strong distribution in the short term.
While ETFs continue to play an important role, the increased outflow from LTH could be a sign of a distribution phase and price correction.
In summary, while Bitcoin is experiencing a strong period thanks to institutional demand and large inflows from ETFs, selling pressure from LTHs could create strong volatility if left unchecked. To maintain a sustainable growth momentum, the market needs a balance between inflows from institutions and spending actions from LTHs.
Join the HCCVenture community to get the latest market information. Once again, we give our opinion on potential projects in the crypto market. This is not investment advice, consider your portfolio. Disclaimer: The views expressed in this article are solely those of the author and do not represent the platform in any way. This article is not intended to be a guide to making investment decisions.
API & Data : Glassnode
Compiled and analyzed by HCCVenture
Join our telegram community: HCCVenture
Explore HCCVenture group
HCCVenture © 2023. All rights reserved.


Connect with us
Popular content
Contact to us
E-mail : sp_contact@hccventure.com
Register : https://linktr.ee/holdcoincventure
Disclaimer: The information on this website is for informational purposes only and should not be considered investment advice. We are not responsible for any risks or losses arising from investment decisions based on the content here.
TERMS AND CONDITIONS • CUSTOMER PROTECTION POLICY
ANALYTICAL AND NEWS CONTENT IS COMPILED AND PROVIDED BY EXPERTS IN THE FIELD OF DIGITAL FINANCE AND BLOCKCHAIN BELONGING TO HCCVENTURE ORGANIZATION, INCLUDING OWNERSHIP OF THE CONTENT.
RESPONSIBLE FOR MANAGING ALL CONTENT AND ANALYSIS: HCCVENTURE FOUNDER - TRUONG MINH HUY
Read warnings about scams and phishing emails — REPORT A PROBLEM WITH OUR SITE.