


On-chain analysis week 46/2025: Ethereum investors exit positions en masse
Ethereum is entering a market phase that requires extreme caution, with multiple key on-chain metrics signaling clear weakness and real returns shrinking.
11/17/202510 min read
Ethereum Situation Summary
Ethereum has corrected sharply from the highs above $4,800 to the $3,200–$3,400 region, reflecting a structural shift in money flows and investor sentiment. The AVIV Ratio and True Market Mean indicate that ETH is returning closer to its long-term intrinsic value, consistent with previous sharp corrections after acceleration cycles.
Net Realized Profit/Loss recorded many net loss sessions, with deep red liquidity clusters reproducing the distribution pattern as in the 2022 period. This shows that the pressure to cut losses from the group of investors who bought at the top is returning.
MVRV Ratio has dropped sharply from the 2.0 region to below 1.2, confirming that the majority of short-term investors are no longer in a position to take attractive profits. URPD shows that the dense UTXO distribution in the $3,400–$4,400 region is turning into resistance clusters as ETH loses key price levels.
Realized Cap HODL Waves shows a significant increase in short-term coins (1d–1w, 1w–1m), reflecting high coin turnover and no longer long-term holding sentiment.
Analyzing on-chain metrics
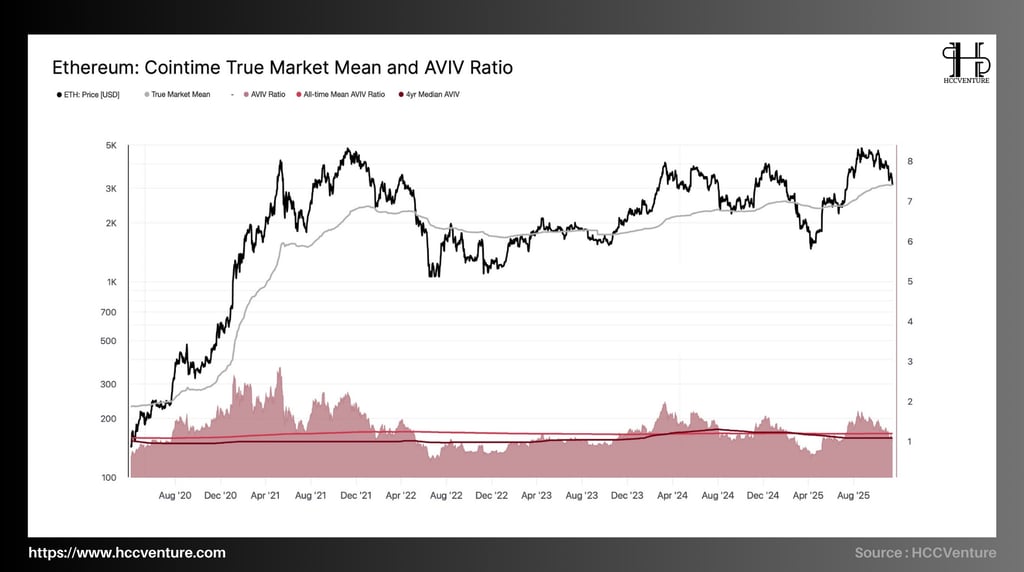

Ethereum is in a medium-term equilibrium phase, defined by the convergence between spot prices and long-term valuation benchmarks such as True Market Mean . At the same time, the AVIV Ratio remains low and stable, reflecting a sustained but declining level of on-chain activity consistent with a post-expansion re-accumulation phase.
True Market Mean is currently located near the $2,400 – $2,600 zone .
ETH price is currently at $3,200–$3,400 , ~ 30–35% above long-term valuation benchmark .
Historically, the current spread suggests that ETH is neither overvalued nor undervalued. The market is approaching a fair-value equilibrium – a sustainable equilibrium for a revaluation period.
2021 Peak: ETH trades 130–150% above True Market Mean before breaking bullish structure. AVIV rises to 3.5–4.0 range, reflecting on-chain activity bubble.
Bottom 2022: Price is -45% below the valuation standard, typical of the capitulation phase. AVIV drops to 0.8 – 1.0, representing a period of extreme liquidity decline.
If True Market Mean is a lagging fair-value measure, then AVIV Ratio is a driving force measure. While high AVIV indicates strong on-chain capital flows, the growth phase (2020–2021). Conversely, low AVIV indicates a slowdown in real transaction velocity, consistent with the accumulation phase.
Ethereum is operating in a sustainable expansion cycle, neither too hot nor too cold , lying between the “ overheated ” and “ undervalued ” extremes . The moderate gap between the spot price and True Market Mean suggests that the market is not overvalued, while the low but stable AVIV Ratio reflects the maturity of on-chain capital flows.
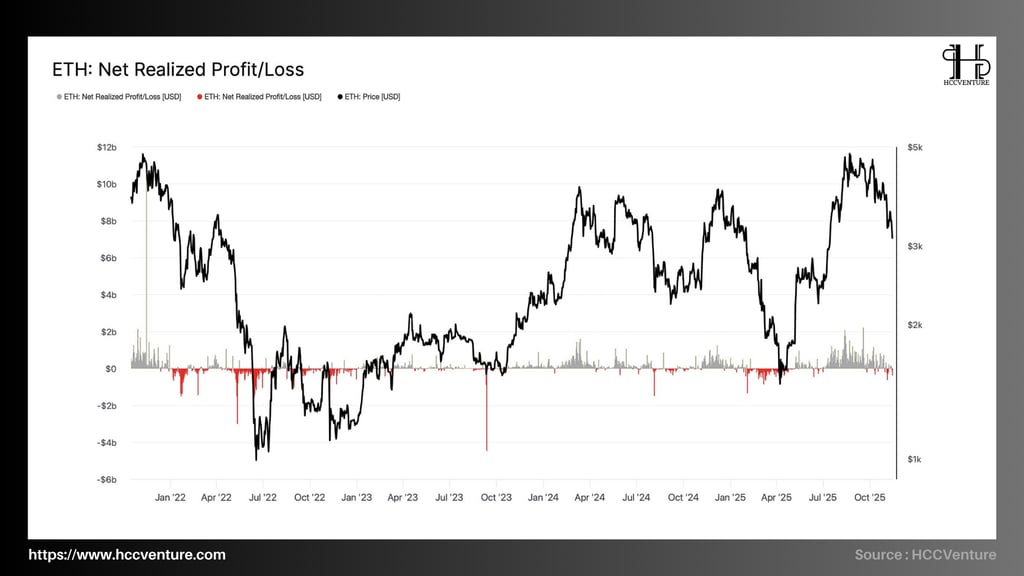
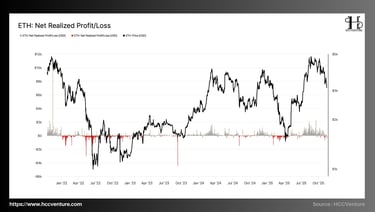
Ethereum’s Net Realized Profit/Loss (NRPL) shows that the market is undergoing a controlled correction, with realized losses starting to increase sharply as the price falls from the $4,000–$4,300 highs.
NRPL > 0 → market takes profit, usually coincides with the top or distribution phase.
NRPL < 0 → investors sell at a loss, usually reflecting panic, revaluation or long-term accumulation phase.
The current loss, while widening, is still significantly lower than the major capitulations of 2022 and October 2023, reflecting a medium-term correction rather than panic selling.
Historical comparison shows that real deep ETH declines have always been accompanied by realized losses of over -4.5 to -6 billion USD , which has not appeared in the current cycle.
In June 2022 , when ETH plunged to the $880–$1,000 range, NRPL hit - $5.5 billion , marking one of the largest capitulations in history.
In April 2025 , before the recovery to $4,000, NRPL fell to - $2.5 to -$3 billion , but significantly lower than 2022 – confirming a much lower level of panic.
NRPL is currently negative but only at -800M to -1.2B USD , which is nearly 80% lower than the major capitulation phases. The selling pressure is mainly from the short-term peak buying group, long-term investors are not selling off and still maintaining their positions. However, the "panic sell" zones have not been activated.
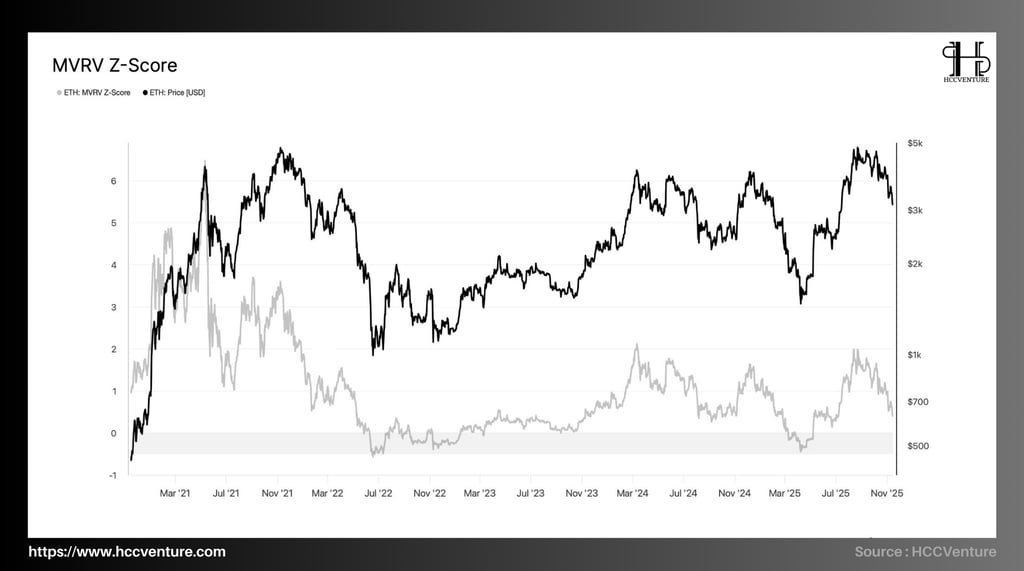
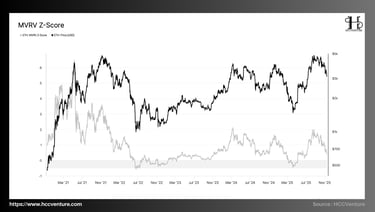
Ethereum's MVRV Z-Score is falling into neutral territory after hitting a cycle high near 2.0–2.2, reflecting a cooling in unrealized market profits . The MVRV Z-Score measures the difference between:
High Z-Score → ETH is overvalued, investors make big profits → distribution potential.
Low Z-Score (≈0 or <0) → Investor breaks even/negative → long-term accumulation zone.
During the recent period when ETH reached ~$4,300, the MVRV Z-Score rose back to the 2.0 region , corresponding to increased unrealized profits across the entire ecosystem.
Now, as ETH continues to trend lower, the Z-Score has dropped to around 1.0–1.2 , indicating that most of the profit-taking pressure has been absorbed. The pricing structure has returned to a neutral state, with no signs of overheating.
This may come from Unrealized Profit being adjusted to a reasonable level. Investors take profits at a controlled level, not creating a strong sell-off in the whole market. Realized Cap continues to increase steadily, proving that long-term cash flow is still accumulating ETH.
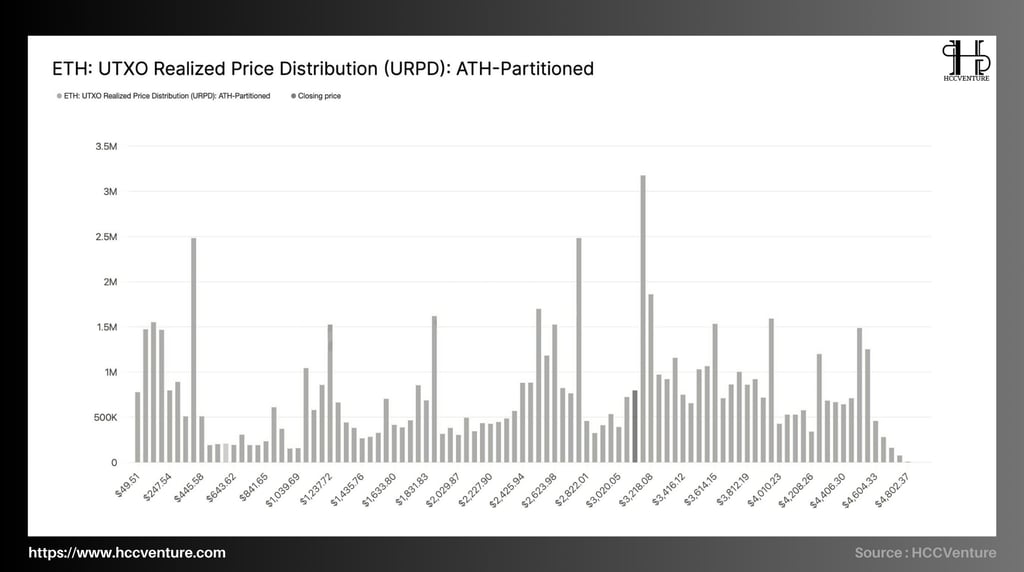
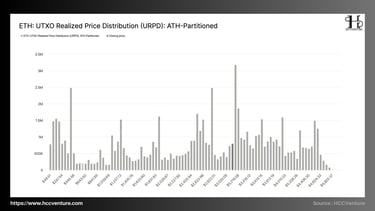
Ethereum's URPD, after splitting by ATH, shows a relatively evenly distributed supply structure but densely concentrated in two key price clusters: the $450–$650 range and the $3,200–$3,600 range. The fact that large UTXO clusters continue to hold, despite ETH's recent correction from the ~$4,800 peak, suggests that selling pressure from long-term holders is very low.
The 2020–2021 period produced a large UTXO volume at $500–650 , with URPD stakes peaking at nearly 2.5–3.0 million ETH . This group of investors:
Still holds most of the supply from the cycle bottom
No sell-off during sharp corrections in 2022 and 2023
Creating a "concrete" layer to support the market long term
From the URPD data, it can be seen that the $1,200–$1,450 and $1,800–$2,200 clusters maintain a relatively high supply density (0.5–1.2 million ETH each). This is a large number of holders participating in the 2023–2024 recovery cycle, most of whom remain undistributed even when ETH reaches the $4,000–$4,800 marks.
This is the “top buyer cluster” zone of the current cycle. As ETH corrected from $4,800 to near $3,000, this group of holders has not yet capitalized. There is no drop in URPD volume, leading to very low distribution pressure.
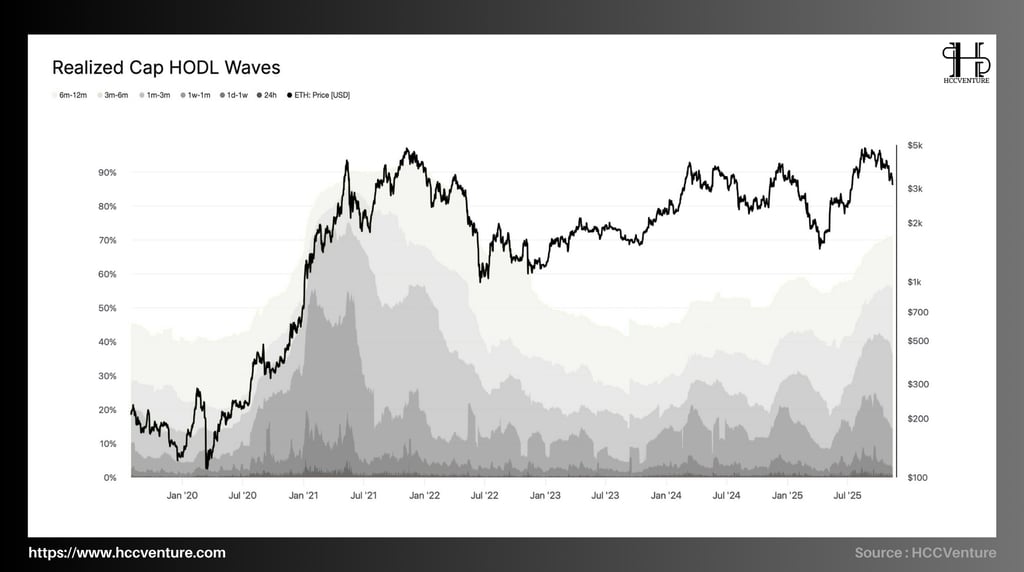
Ethereum's Realized Cap HODL Waves show that the current holding structure is shifting strongly into the ≥6 month groups, while the proportion of capital in the <1 month group has decreased significantly compared to the 2021 peak formation period.
The proportion of Realized Cap in the <1 week group is currently maintained at a very low level, lower than the 2022 bottom period.
Short-term churn is being compressed to a minimum.
The market does not show speculative FOMO waves.
New cash flow has not created any noise pressure, helping the trend become more stable.
The 1–3 month and 3–6 month groups are expanding significantly from late 2023 to mid-2025, reaching their highest levels since 2020.
Medium term investors are participating regularly
Most of the new capital entering the market does not exit the position when ETH corrects
The level of patience increases gradually, in line with the mid-cycle consolidation phase.
The 6–12 month group is the most important in ETH's HODL Waves structure. The 6–12 month weighting has now surpassed 2020 levels and is approaching the peak of the 2023 recovery phase.
Big money buying in 2024–2025 corrections won't leave the market
Long-term holders increase control over supply
ETH's price base is becoming "heavier" and more stable
Short-term HODL groups remain low, in stark contrast to the 2021 cycle. The proportion of the 6–12 month group is approaching a 5-year high. Any demand shock from ETFs, staking, or altcoin rotation flows could push ETH sharply higher.
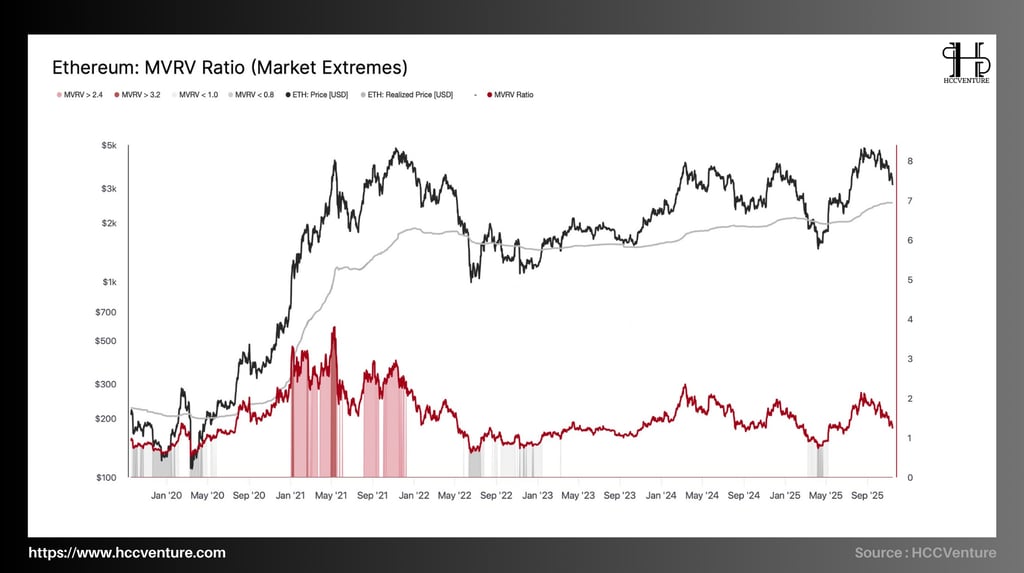
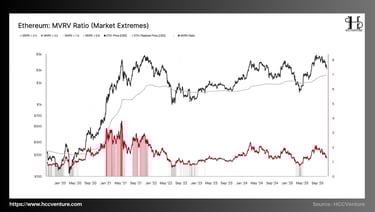
Ethereum's MVRV Ratio continues to reflect a neutral–bearish valuation, as MVRV hovers around 1.2–1.4, significantly lower than the extreme peaks of the 2020–2021 cycle (MVRV > 3.2) and also higher than the 2022 bottom (MVRV < 0.8).
The MVRV Ratio measures the ratio between Market Value and Realized Value – the difference between the market price and the investor’s average cost of capital. This metric is a key tool in determining:
Is ETH overvalued or undervalued?
the degree of risk accumulated in speculative behavior
peak distribution and bottom collection areas
Cyclical health and price scalability
During the 2020–2021 bubble , Ethereum recorded 8 times approaching the MVRV > 3.2 zone – a threshold that history shows is always associated with the phenomenon of investors holding huge profits, sudden profit-taking pressure and strong distribution structure.
In the 2023-2025 period , MVRV mainly fluctuates around 1.0-1.8, reflecting that ETH is no longer as cheaply priced as in the 2022 period, nor does it experience the over-standard excitement of 2021, and the market is in a phase of re-establishing the supply-demand structure.
Current MVRV is around ~1.2–1.4, much lower than the >3.2 zone of the previous cycle. There are no extreme MVRV clusters indicating large profit-taking pressure. There are no capitulation or breakdown signals. When new capital flows return or staking increases sharply, ETH is likely to exit the neutral zone and return to the price expansion zone.
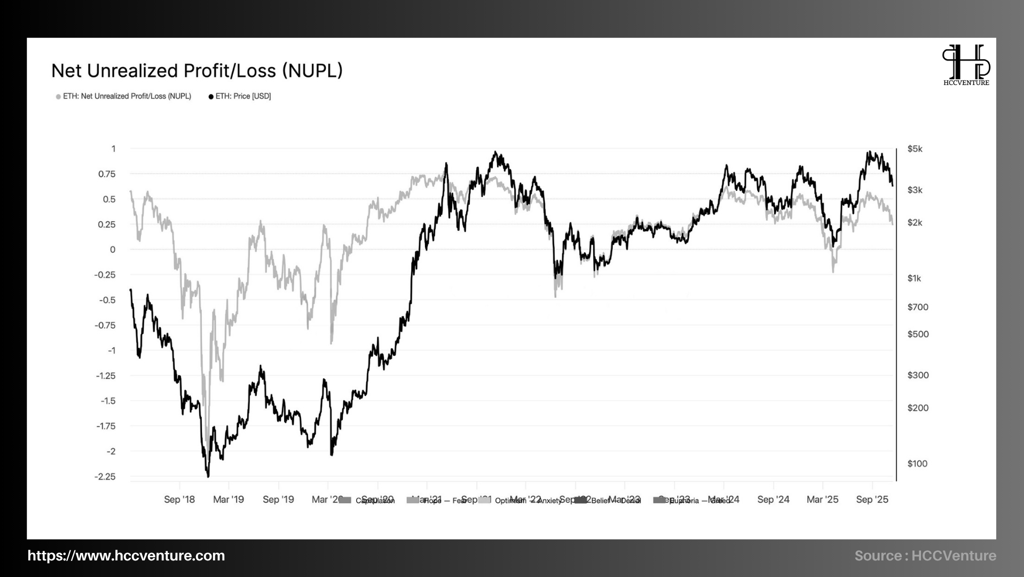
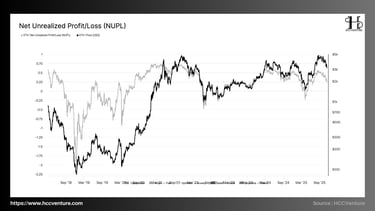
Ethereum’s NUPL index is currently in a slightly positive zone, fluctuating around 0.20–0.35. Compared to previous periods, ETH is in the “ Optimism – Belief ” zone, significantly lower than the 2021 “Euphoria” zones (NUPL > 0.6), and higher than the 2022 “ Capitulation ” zone (NUPL < –0.3).
ETH fell deep into a massive unrealized loss, reaching -2.0 – one of the lowest NUPLs ever recorded in 2018-2019, the result of a massive sell-off, network abandonment, and long-term illiquidity.
The “ Capitulation ” zone appears when ETH falls below $1,000. It reflects profits turning into losses, the network purging weak investors, and long-term holders starting to accumulate Ethereum.
Currently NUPL is not entering the euphoria zone, but it is not falling into the fear zone either. This structure usually appears in mid-cycle consolidation . gThe re-accumulation phase before expansion and when the market is reasonably priced.
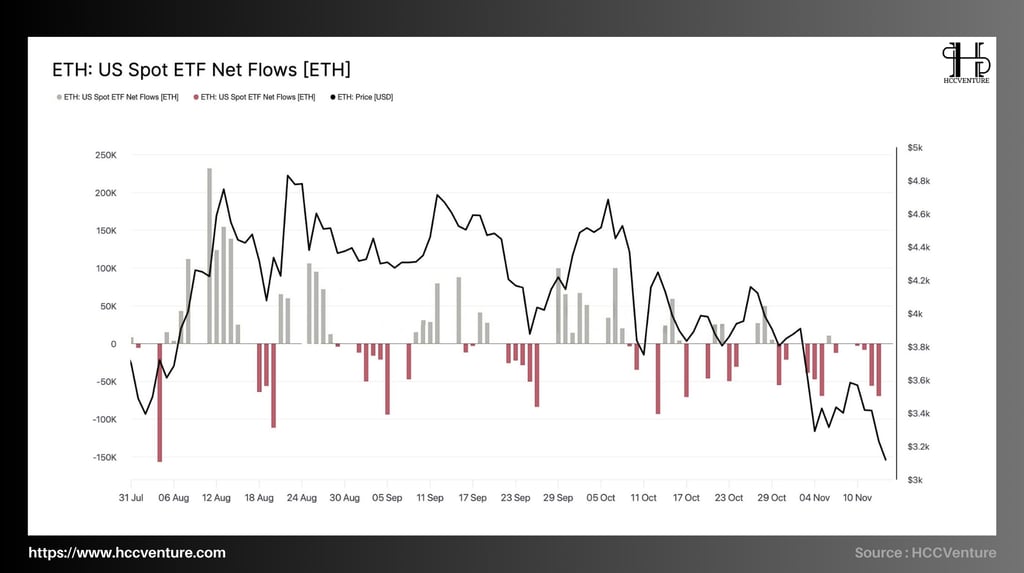
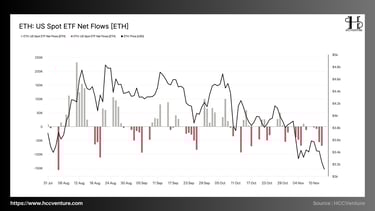
Net Flows of US Spot ETH ETFs shifted from positive in August to a weakening trend that lasted from mid-September to November. While the early stages of the ETF attracted strong flows, with days recording net gains of over +150,000 ETH , the late stages of the chart showed continuous withdrawals, with many sessions falling deeper than -120,000 ETH.
Capital flows begin to diverge:
Inflow is decreasing, mostly below +30,000 ETH/session.
Outflow appears sporadically but has not yet created a trend.
ETH price fluctuates around the $3,800–$4,200 range , showing lack of convincing demand.
The magnitude of the withdrawals is significantly larger than the remaining inflow sessions. The high frequency of outflows suggests that this is not a short-term fluctuation, but a systemic decline in confidence. This structure replicates the “institutional distribution phase ” model.
As outflows have not decreased in intensity, the market has not shown any signs of a capital reversal. Large money is not taking risks in the context of ETH falling below $4,000. As inflows turn into outflows, institutional liquidity weakens, making ETH more sensitive to price fluctuations.
Evaluation and Conclusion
Ethereum is in a systematic correction, with a defensive movement structure. It is unlikely that the price will establish a strong uptrend without a clear recovery in ETF inflows or a new demand large enough to absorb the dense supply area above.
Long-term valuation metrics such as True Market Mean and AVIV Ratio show that ETH has returned closer to its intrinsic value after the previous surge. The AVIV Ratio is falling closer to its 4-year median, reflecting that ETH is moving out of the expensive valuation zone and into a more reasonable valuation.
Investor sentiment is clearly bearish. MVRV Ratio and MVRV Z-Score have fallen sharply from the euphoric zone, returning below the neutral threshold – confirming that profit margins are not attractive enough to trigger new cash flows. NUPL has weakened to near zero, reflecting the market sentiment shift from “Optimism/Belief” to “Neutrality”. At the same time, Net Realized Profit/Loss has recorded large loss clusters, similar to the 2022 distribution model, indicating that investors who bought at the top have started to cut their losses.
The supply distribution structure also reinforces the cautious view. Realized Cap HODL Waves show an increase in the proportion of short-term coins (1d–1m), reflecting a high degree of coin turnover – a characteristic state of redistribution phases where long-term holdings are losing confidence. URPD shows that ETH is “ trapped ” under multiple layers of dense supply in the $3,400–$4,400 region, causing any recovery to be met with strong selling pressure.
Ethereum is in a structural consolidation phase , with a high probability of continuing to fluctuate in a compressed price range. The bullish momentum will only appear when ETF inflows return and MVRV – NUPL recovers from neutral territory. Until those signals appear, ETH will remain in an extended correction, reflecting the current supply-demand pressures and market sentiment.
Disclaimer: The information presented in this article is the author's personal opinion in the cryptocurrency field. It is not intended to be financial or investment advice. Any investment decision should be based on careful consideration of your personal portfolio and risk tolerance. The views expressed in this article do not represent the official position of the platform. We recommend that readers conduct their own research and consult with a professional before making any investment decisions.
API & Data: Glassnode
Compiled and analyzed by HCCVenture
Join HCCVenture here: https://linktr.ee/holdcoincventure
Explore HCCVenture group
HCCVenture © 2023. All rights reserved.


Connect with us
Popular content
Contact to us
E-mail : sp_contact@hccventure.com
Register : https://linktr.ee/holdcoincventure
Disclaimer: The information on this website is for informational purposes only and should not be considered investment advice. We are not responsible for any risks or losses arising from investment decisions based on the content here.
TERMS AND CONDITIONS • CUSTOMER PROTECTION POLICY
ANALYTICAL AND NEWS CONTENT IS COMPILED AND PROVIDED BY EXPERTS IN THE FIELD OF DIGITAL FINANCE AND BLOCKCHAIN BELONGING TO HCCVENTURE ORGANIZATION, INCLUDING OWNERSHIP OF THE CONTENT.
RESPONSIBLE FOR MANAGING ALL CONTENT AND ANALYSIS: HCCVENTURE FOUNDER - TRUONG MINH HUY
Read warnings about scams and phishing emails — REPORT A PROBLEM WITH OUR SITE.