


On-chain analysis week 46 / 2024: Bitcoin's big hit
BTC has been setting ATHs over the past week, driven by strong spot demand and institutional inflows, with over 95% of the current supply in profit. We look at on-chain metrics to highlight strong spot buying, growth in ETF AUM, futures spreads, and the ability to hold onto profits during the ATH.
11/14/20248 min read
Assess the situation
Bitcoin's price increase is largely driven by strong demand in spot markets, where investors are willing to pay a premium to own Bitcoin immediately. This demand is much stronger than in perpetual futures contracts, suggesting that many people are considering Bitcoin as a safe investment option amid economic uncertainty.
Spot ETFs in the US and open interest in CME futures have surged as cash-and-carry strategies have gained popularity, reflecting growing confidence and interest from institutional investors.
Entering the ATH price discovery phase, an important factor is the proportion of supply that is in profit. We will focus on market dynamics that come with extended periods where more than 95% of supply is in profit, indicating positive investor sentiment and the potential for continued price increases.
To track demand dynamics, the analysis is based on on-chain cost basis bands. Identifying these value ranges indicates periods of strong market demand, helping investors determine where to enter or exit the market.
Onchain Metrics Analysis
After the US presidential election results were announced, with the consensus that the Trump administration would take a more crypto-friendly stance, a positive signal rang out in the crypto market, pushing Bitcoin to a new all-time high. This breakout to ATH was reflected across all major BTC/Forex pairs.
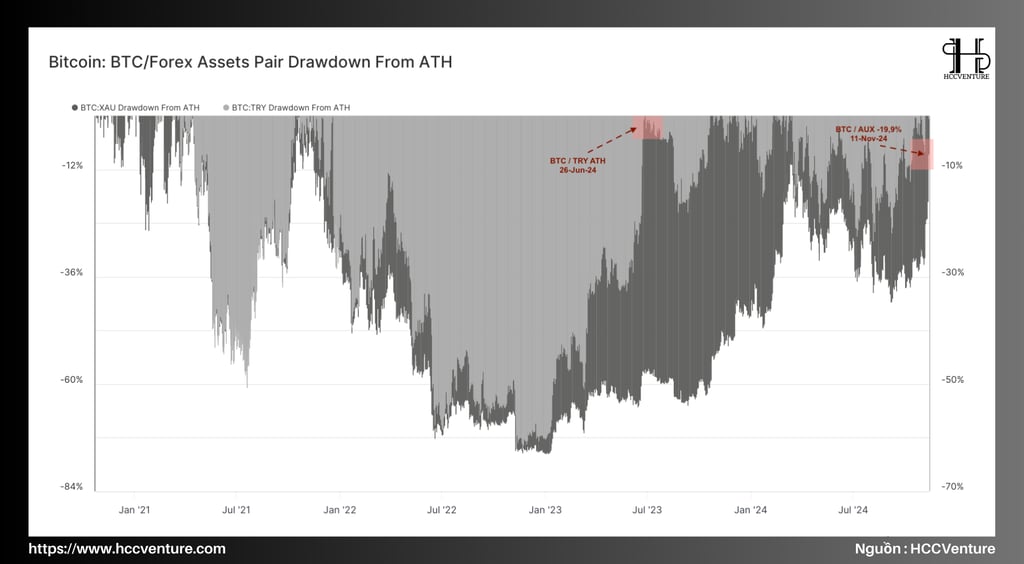
The chart below illustrates the decline from ATH of Bitcoin (BTC) when paired with various fiat currencies and gold (XAU). Notably, the BTC/TRY (Turkish Lira) pair was the first to reach ATH on June 26, 2024, leading the way before other pairs followed. On November 6, 2024, nearly all BTC:Forex pairs reached new ATHs, except for the BTC/Gold pair, which remained approximately 19.9% below its ATH, despite Bitcoin's current value of $88,600.
The BTC/Gold pair is still about 19.9% below its ATH despite the current Bitcoin price being pegged at $88,600. This shows that while Bitcoin is on a strong growth trajectory, the comparison to gold still makes the market pay attention to gold’s safe-haven value amid inflation and economic uncertainty that could affect investor sentiment.
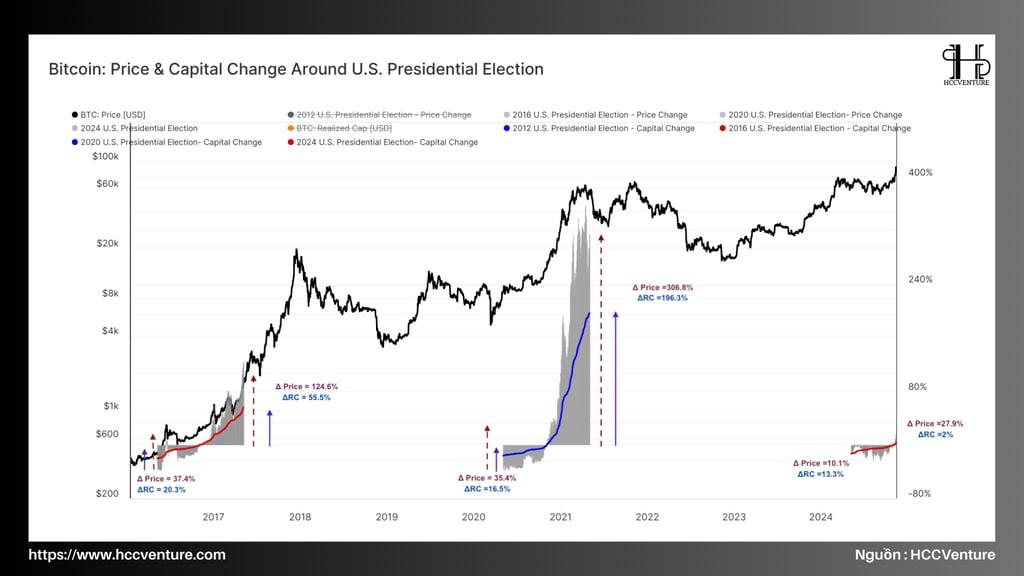
History shows that US presidential elections have had a significant impact on Bitcoin's market performance, with marked fluctuations in price and realized capital—representing the cumulative wealth invested in the Bitcoin network.
2016 Election (Republican Government):
Realized capital jumped 20.3% before the election and continued to increase 55.5% afterward.
Bitcoin's value increased 34.7% before the election and "flew" 124.6% in the months after the election.
2020 Election (Democratic Government):
Realized capital flows grew 16.5% before and 196.3% after the election.
Bitcoin's value increased 35.4% before the election and "rose" 306.8% after.
2024 Election (Republican Administration as of now):
Realized capital increased 13.3% before the election but only increased slightly by 2% afterwards.
Bitcoin's value increased by 10.1% before the election and recorded a 27.9% increase in the post-election period (so far).
Thus, the current cycle reflects a more modest response than previous elections, although still marked by optimism. The market is now adjusting to possible changes in cryptocurrency policy that are expected to occur in the coming years.
The recovery in Bitcoin market performance following elections demonstrates that political factors can have a strong impact on investor sentiment. With each election cycle, significant increases in realized capital and price are often accompanied by expectations of a favorable policy environment for cryptocurrencies.
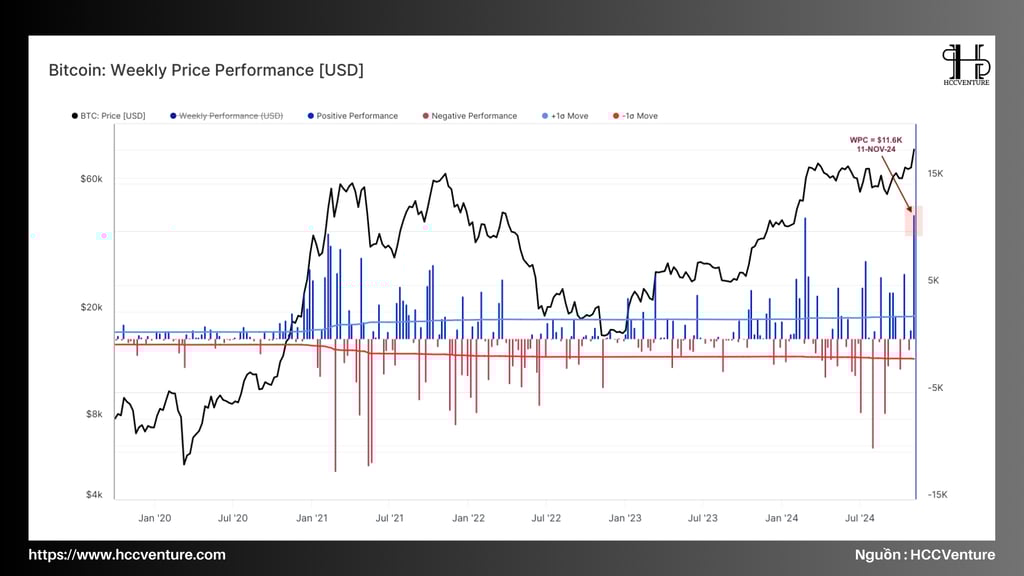
Continuing its rally from its recent all-time high (ATH) breakout, Bitcoin has recorded its largest weekly candle ever, posting a stunning $11.6k gain. This rally far outpaced historical weekly moves, reaching nearly five times the statistical band (1 standard deviation), signaling unprecedented bullish strength.
This stellar price action reflects market optimism, as participants view the anticipated regulatory landscape as a driver of steady capital inflows. This strong performance not only indicates increased investor interest, but also reinforces the belief that favorable regulations could further drive Bitcoin adoption and price stability.
As the market continues to react positively to these developments, monitoring investor sentiment and regulatory news will be important to understand the future direction of Bitcoin and the broader cryptocurrency market. With such strong gains, the current cycle looks set to continue, attracting both retail and institutional investors looking to participate in the growing digital asset space.
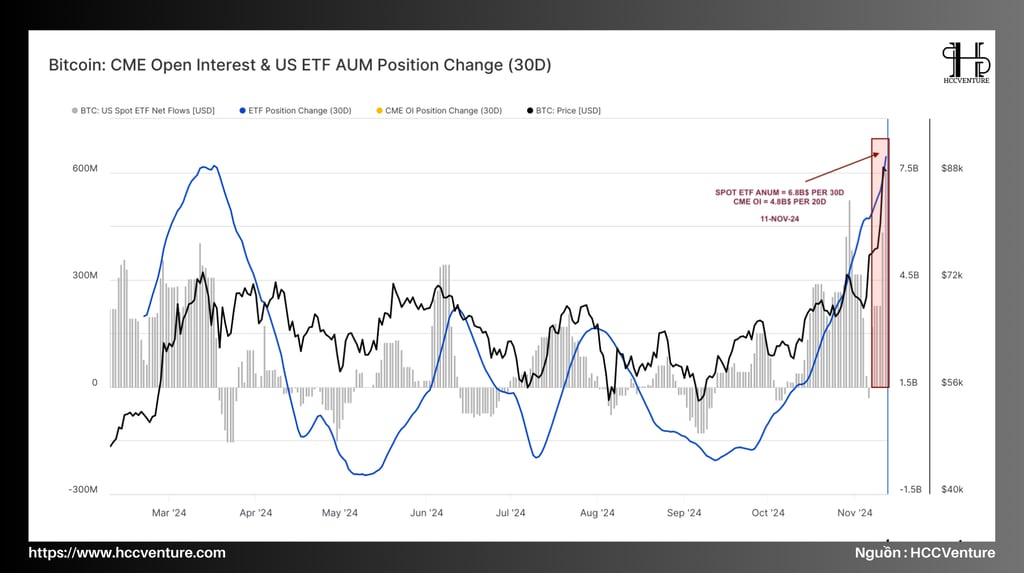
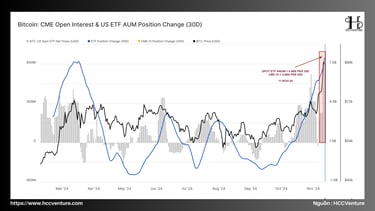
Following strong buyer pressure seen in Coinbase’s spot market, the recent surge has led to significant inflows into U.S. spot ETFs, with total assets under management increasing by $6.8 billion over the past 30 days. This growth outpaced the $7.6 billion increase in open interest on CME futures, indicating a clear preference for spot exposure through ETFs.
The correlation between ETF inflows and CME open interest underscores the dominance of cash-and-carry strategies in the current market environment. However, the stronger demand for ETFs suggests a clear shift toward direct spot exposure during this market rally.
This trend suggests that investors are increasingly recognizing the advantages of spot trading, particularly in terms of liquidity and price stability, as they seek to capitalize on the Bitcoin market’s bullish momentum. The collective behavior of market participants favoring ETFs demonstrates growing confidence in Bitcoin’s long-term growth potential and the resilience of the market, supporting the overall bullish sentiment in the cryptocurrency space.
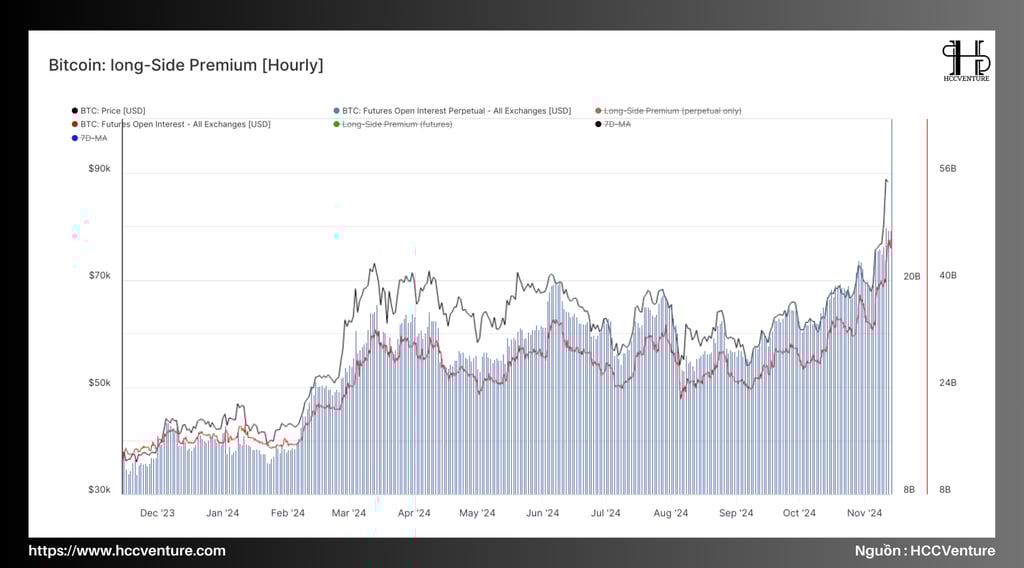
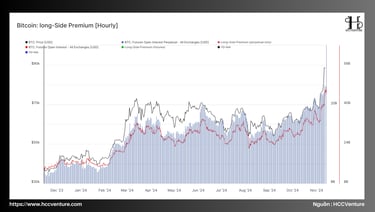
Sustained demand in the spot market often leads to similarly positive momentum in perpetual futures contracts. The recent peak in the futures markets—reaching $1.59 million per hour (with a seven-day average of $392,000 per hour) on November 12—suggests strong speculative interest.
However, this is still below the mid-March peaks, reinforcing the theory that the current rally is largely driven by spot trading. Moderate but still significant demand in futures markets suggests that spot demand, rather than leveraged speculation, is the dominant force behind the price rise so far.
This distinction is important, as it suggests that investor confidence is largely based on actual market activity rather than speculative moves. A greater focus on spot demand could help establish a more stable foundation for future price increases, as it reflects real investor interest and participation. Therefore, monitoring the relationship between spot and futures market dynamics will be essential to understanding ongoing price movements and potential future trends.
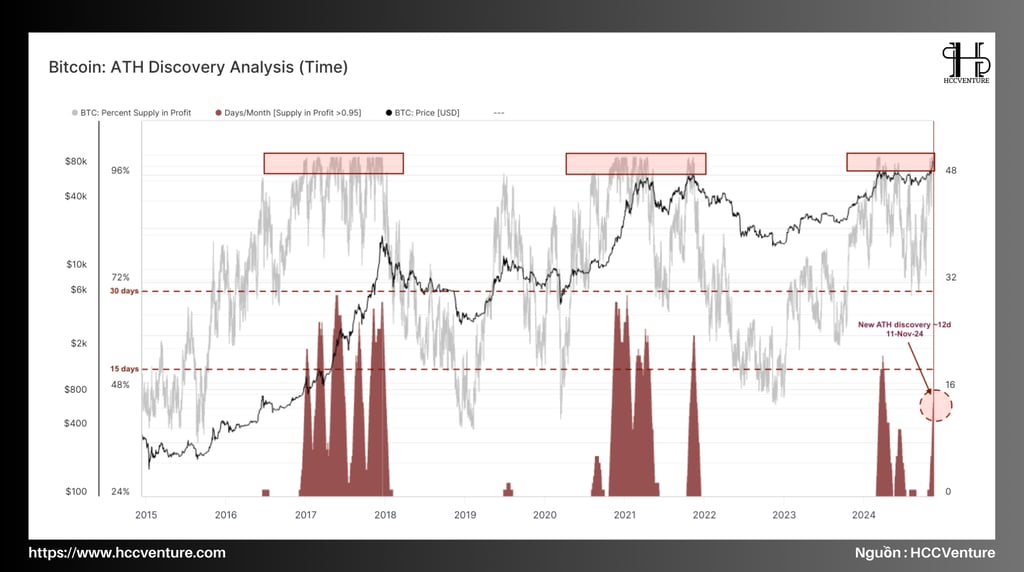
Bitcoin has entered a new phase of price discovery, with the entire circulating supply in profit. The accompanying chart illustrates the percentage of the supply that is in profit, along with the number of consecutive days in each month that the metric exceeds 95%.
History shows that these euphoric periods typically last around 22 days before a correction occurs, pushing more than 5% of supply below the initial purchase price. The current rally has maintained this high level of profit for 12 consecutive days, highlighting strong market sentiment. However, it also suggests that a correction is likely to come based on past patterns.
When the market is operating in this euphoric state, investors should remain vigilant and ready to deal with potential volatility, recognizing that history can repeat itself and corrections often occur after extended periods of profitability.
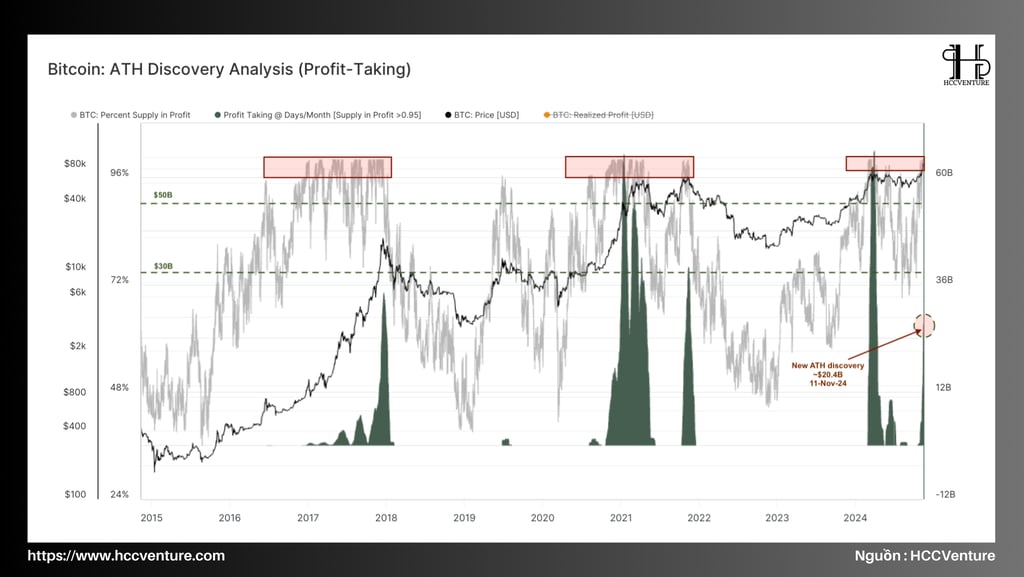
This chart looks at cumulative realized profits during the New ATH Discovery period, highlighting the scale of profit-taking activity. History shows that monthly realized profits have ranged from $30 billion to $50 billion before demand exhaustion occurs, typically signaling a cooling period in the market.
We have now recorded $20.4 billion in realized profits since entering this new ATH discovery phase. While this level of profit taking is quite remarkable, it is still below historical highs, suggesting that there is still potential for additional profits before demand exhaustion is reached.
This pattern suggests that the market may have room to continue its rally, as profit-taking levels have not yet been reached, which typically triggers a slowdown in demand. Investors can continue to capitalize on the current bullish sentiment, but should remain vigilant for signs of market fatigue that could signal an upcoming correction. Monitoring these profit-taking trends will be important to understanding future price movements and the overall health of the market.
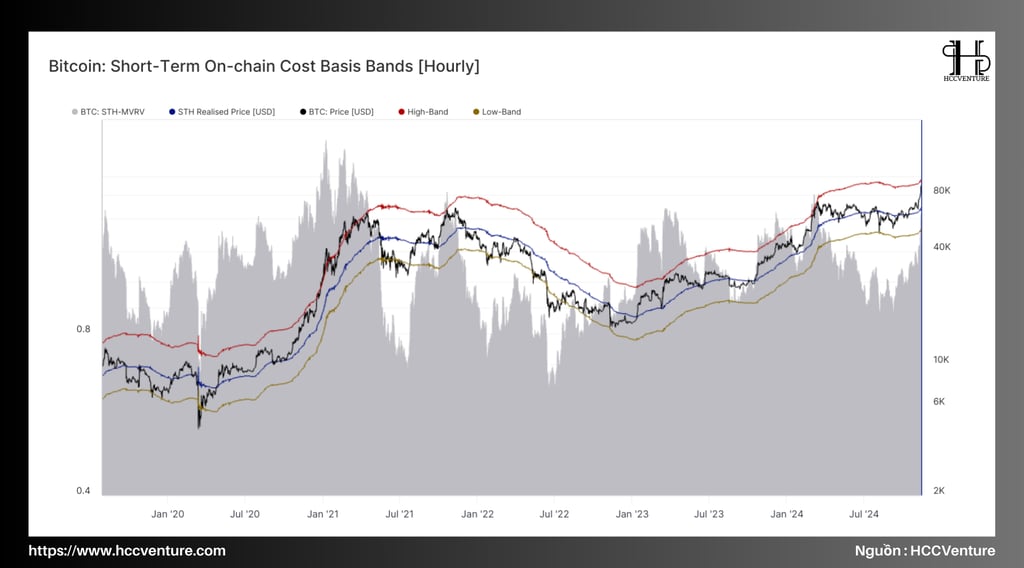
As we enter a new ATH discovery phase, it becomes necessary to identify the most effective price model to navigate the increased market activity. This chart shows the base cost of new investors, along with the upper and lower statistical bands (±1 standard deviation).
During ATH discovery periods, Bitcoin price often approaches and tests the upper band multiple times, driven by strong demand momentum from new investors entering at higher prices. Currently, Bitcoin price is at $87.9k, near the upper band at $94.9k. Tracking the distance to these bands, especially the upper and middle bands, can highlight periods of strong market demand, reflecting the eagerness of new capital to enter the market during bull phases.
Currently, with Bitcoin’s spot price at $87.9k, it is close to the upper band of $94.9k. Monitoring the distance to these bands, especially the upper and middle bands, can indicate when periods of intense demand may be fading and where prices may be high enough for many current holders to increase selling pressure. Monitoring this is important for predicting potential market corrections and understanding supply and demand dynamics, providing valuable insight for traders and investors in this volatile environment.
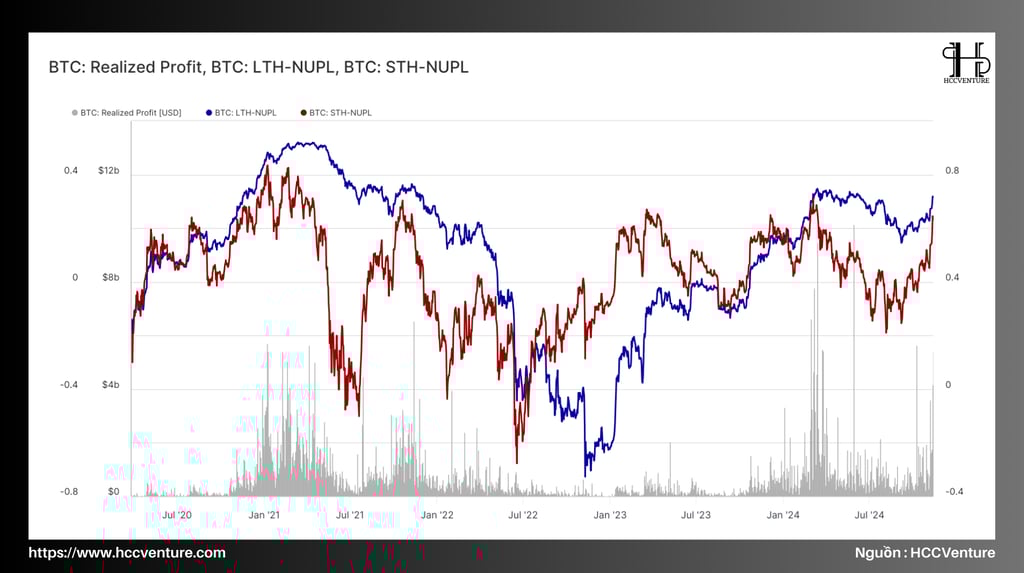
Currently, realized profit volume is averaging around $1.56 billion per day, with long-term holders contributing around $720 million, or 46% of total volume.
Despite the increase in profit taking, the total volume of realized profits is still only about half of what it was during previous ATH cycles, when it exceeded $3 billion per day, with more than 50% coming from long-term holders. This again shows that there is still room for price to rise if demand continues to flow into the market. It also indicates that more selling pressure is needed before realized profits reach normal levels at peaks.
Given the current market dynamics, this information provides valuable insight into potential future movements, highlighting the need to keep an eye on the ongoing supply and demand situation. If the capital flow trend continues, we could see an increase in realized profits that could signal an upcoming rally as more investors choose to book profits.
Evaluation and Conclusion
This newsletter looks at Bitcoin’s recent all-time high, which was largely driven by strong demand from the spot market, particularly through US-based spot ETFs.
Institutional interest has surged since the election, with significant inflows into CME futures and ETFs, favoring spot exposure and pushing Bitcoin into a new ATH discovery phase. Currently, over 95% of circulating supply is in profit, often followed by large profit-taking activities.
Almost the entire circulating supply of BTC is currently in profit, although this is balanced by a significant increase in profit-taking activity.
Although realized profits for both short-term and long-term investors have increased, they are still lower than previous ATH peaks, which may indicate that many investors are willing to wait for higher prices.
The current movements in the Bitcoin market reflect strong investor sentiment, with strong performance and significant profit potential. However, significant profit-taking activity suggests caution, and the market’s ability to sustain growth momentum will depend on current demand and investor confidence. Continued monitoring of market trends and investor behavior will be essential to identify future opportunities and challenges.
Join the HCCVenture community to get the latest market information. Once again, we give our opinion on potential projects in the crypto market. This is not investment advice, consider your portfolio. Disclaimer: The views expressed in this article are solely those of the author and do not represent the platform in any way. This article is not intended to be a guide to making investment decisions.
API & Data : Glassnode
Compiled and analyzed by HCCVenture
Join our telegram community: HCCVenture
Explore HCCVenture group
HCCVenture © 2023. All rights reserved.


Connect with us
Popular content
Contact to us
E-mail : sp_contact@hccventure.com
Register : https://linktr.ee/holdcoincventure
Disclaimer: The information on this website is for informational purposes only and should not be considered investment advice. We are not responsible for any risks or losses arising from investment decisions based on the content here.
TERMS AND CONDITIONS • CUSTOMER PROTECTION POLICY
ANALYTICAL AND NEWS CONTENT IS COMPILED AND PROVIDED BY EXPERTS IN THE FIELD OF DIGITAL FINANCE AND BLOCKCHAIN BELONGING TO HCCVENTURE ORGANIZATION, INCLUDING OWNERSHIP OF THE CONTENT.
RESPONSIBLE FOR MANAGING ALL CONTENT AND ANALYSIS: HCCVENTURE FOUNDER - TRUONG MINH HUY
Read warnings about scams and phishing emails — REPORT A PROBLEM WITH OUR SITE.