

On-chain analysis week 45/2026 : Long-term BTC investors have returned
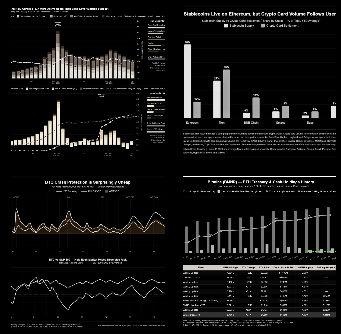
Bitcoin is entering a correction phase with the simultaneous weakening of several indicators reflecting capital flows and spot buying demand, while the supply of stablecoins is shrinking sharply.
PHÂN TÍCH
11/16/202615 min read


On-chain analysis week 45/2026 : Long-term BTC investors have returned
Bitcoin is entering a correction phase with the simultaneous weakening of several indicators reflecting capital flows and spot buying demand, while the supply of stablecoins is shrinking sharply.
Analysis • November 16, 2026


Market Summary
Prices have fallen below the Short-Term Holder Cost Basis at $75.6K, while the supply of stablecoins has shrunk sharply, Bitcoin Spot ETFs have seen net outflows, and the Coinbase Premium remains in negative territory. These signals indicate that demand from short-term investors and institutional capital in the US is not strong enough to absorb the selling pressure in the market.
However, the current developments do not mean that the recovery structure formed since June 2026 has been completely broken. Long leverage has been significantly released, the spot order book shows a larger volume of pending buy orders than sell orders in the near-market price range, and some large wallet groups have shifted from distribution to accumulation.
The core issue in the current market lies in the imbalance between capital supply and accumulation behavior. While a segment of large investors are buying during price corrections, overall capital is still flowing out of the digital asset ecosystem. Therefore, the short-term outlook for Bitcoin remains inclined towards accumulation and testing support levels, rather than confirming a new growth cycle.
Bitcoin's performance is showing relative weakness compared to the US stock market. Following the sell-off that began on November 5th, Bitcoin and major stock indices initially came under pressure. However, since November 9th, the S&P 500 and Nasdaq 100 have recovered above their election day closing levels, while Bitcoin continued to decline after the CPI data released on November 10th and remains approximately 5% below this benchmark.
Stablecoins act as an intermediary liquidity source in the digital asset ecosystem, used to store value, facilitate transactions, and prepare capital for investment activities. When the total supply decreases sharply, this reflects the withdrawal of USD-denominated capital from the ecosystem, instead of being held to await disbursement into Bitcoin and other assets.
The simultaneous outflows of ETFs and a negative Coinbase Premium suggest that the pressure to withdraw capital is not limited to a single investment channel. Demand from US investors is weakening in both the managed investment product market and the spot market, leaving Bitcoin without a crucial source of demand to sustain its recovery.
Analyzing on-chain metrics
US M2 data is showing a clear improvement in macroeconomic liquidity conditions. At approximately $23.51 trillion, the money supply has surpassed its 2022 peak and continues its expansionary trend after recovering from the 2022-2023 tightening cycle. This is a positive fundamental factor for risk assets, including Bitcoin, as an expanding monetary environment typically facilitates capital allocation and asset valuation in the medium term.


The most notable point in the current data is the divergence between the M2 trend and Bitcoin price movements. While the money supply continues to increase to historical highs, Bitcoin has yet to sustain its upward momentum at a rate commensurate with the expansion of liquidity. This divergence reflects an important reality: expanded monetary liquidity does not necessarily mean that capital will immediately flow into Bitcoin.
With M2 currently at around $23.51 trillion and continuing its upward trend, nominal liquidity conditions are creating a more positive macroeconomic foundation for Bitcoin compared to the tightening period of 2022–2023. However, the actual level of support will depend on the M2 growth rate in the coming months, the Fed's monetary policy, and the ability of capital to shift from the traditional financial system to the digital asset market.
However, Bitcoin's price movements have not fully reflected the improvement in liquidity. The divergence between the continuously rising M2 levels and BTC still trading below its cyclical peak suggests that the money flow within the financial system has not been proportionally converted into demand for digital assets.


The period from 2018 to 2025 shows that Bitcoin and the S&P 500 tend to move in sync more clearly during periods heavily impacted by global liquidity conditions and monetary policy. However, Bitcoin consistently maintains a larger volatility range, reflecting its high risk characteristics and high sensitivity to speculative capital flows.
In 2026, as the S&P 500 continues its upward trend and moves towards the 7,500-7,700 point range at the end of the data series, Bitcoin will decline from its previous peak. This divergence suggests that the upward momentum of the US stock market has not been proportionally reflected in the Bitcoin market. In other words, the positive performance of US stocks is no longer a strong enough factor to sustain the upward trend of BTC in the current period.
Notably, Bitcoin has failed to maintain the same gains as the S&P 500 after both markets recovered in previous years. As equities continued to establish higher price levels, BTC formed a relatively weak structure. This indicates that Bitcoin's growth momentum is more dependent on specialized capital flows within the digital asset market, rather than simply on an overall improvement in global risk appetite.


The Bitcoin Market Balance Index (MBI) is an index developed by HCCVenture to assess the equilibrium state of the Bitcoin market over a 6-month timeframe. In May 2026, the MBI remained above 0.6 and at times approached 0.85, placing it in the high-risk zone according to the index's classification system, which corresponds to the period when Bitcoin traded around $70,000-$75,000. However, this state quickly changed as the MBI began to decline in the latter half of May and early June.
Currently, the MBI is trading at 0.45, significantly lower than the 0.6 threshold, and its tendency to continue declining towards the 0.3 support level signals that the market equilibrium is shifting in a less positive direction.
If the index continues to decline and breaks through this level, the market could enter a state similar to the local bottom at the end of June. At that point, corrective pressure is likely to increase, and the price of Bitcoin needs to be reassessed in relation to the $59,000-$60,000 bottom.
Overall, the Bitcoin market currently lacks sufficient signals to confirm a re-establishment of an uptrend. The most fitting description for this phase is a correction and weakening of market momentum, while the MBI remains above the local support zone that emerged in late June 2026.


The Fama Efficiency Index Downside Alpha is showing signs of weakening after a period of sustained high levels in 2025 and much of 2026. The current level of around 94-95% is below the 95% threshold of high performance and has entered the tactical zone according to HCCVenture's classification.
A noteworthy feature is that during the 2024-2025 period, the FEI repeatedly maintained or exceeded the 95% threshold, even approaching the 98-100% range. This was also the period when Bitcoin extended its upward trend and continuously set new price highs.
However, from the beginning of 2026, the index experienced more periods of decline and greater volatility, while the price of BTC formed progressively lower peaks compared to the previous historical peak, lasting until November 2026. The FEI fell below 95%, marking a clear weakening of the performance previously maintained during the earlier growth phase.
According to the chart's zoning system, a level below 95% falls within the Tactical Entry Zone . This implies the market has moved out of a state where the model assessed a lack of trading advantage due to overly favorable market conditions or a lack of additional momentum. If the FEI recovers and remains above 95%, and BTC forms a stable price base, this would indicate improving trading conditions and that corrective pressure may gradually be absorbed. Conversely, if the FEI continues to decline while BTC fails to recover lost price levels, the current weakening trend is likely to continue.


Institutional Spot Traction reflects a significant weakening of institutional trading activity on Coinbase between May and November 2026. From a peak of approximately 145,000-150,000 in early May, the index fell to around 5,000-10,000 by the end of the period, equivalent to a decline of approximately 93-97%.
In the short term, the 10,000 level serves as a benchmark for monitoring the index's performance. If the Coinbase Institutional Flow Pulse continues to hover around or below this area, it indicates that institutional trading activity remains limited. In that case, BTC's recovery will need to rely more on other investor groups, rather than being bolstered by institutional demand on Coinbase.
Conversely, a recovery above 10,000 and sustained stability would signal initial improvement. However, to confirm a genuine return of institutional momentum, the index needs to recover above 50,000. This is a more crucial threshold as it indicates a significant improvement in trading intensity compared to the current state. The 100,000 mark would represent even stronger participation, similar to the early May 2026 period.
The IST data currently leans towards a cautious stance, with institutional momentum at a low level and no confirmed signals of large-scale trading returning. The continued price correction to around $66,000-$67,000 while Institutional Flow Pulse returns near the $10,000 mark reinforces the view that institutional demand on Coinbase remains weak and insufficient to create a foundation for a sustainable recovery trend.


The Delta-Thermo Market Multiple (DTMM) is an indicator used by HCCVenture to assess the correlation between Bitcoin's market price and a reference valuation level based on the Delta-Thermo factor. A DTMM of 1.7x indicates that Bitcoin has moved away from the expansion valuation zone and is approaching the accumulation zone. Compared to the 2.5x threshold, the indicator is currently 0.8 points lower, equivalent to a decline of approximately 32%.
If we take the 3.5x distribution zone as a reference, the current DTMM is approximately 51% lower. This gap reflects a significant correction in the market's valuation since the strong growth phase of 2024-2025.
With Bitcoin trading around $68,200, the decline in DTMM suggests that the relative valuation has contracted more rapidly than its previous expansion. This is a sign of an ongoing correction cycle, rather than a market that continues its strong growth trajectory.
Overall, the 1.5x level is a crucial point to watch; if the index continues to fall and breaks through this area, the market could enter a consolidation phase, similar to the undervaluation periods in previous cycles.


Research and Analysis
Market Summary
Analyzing on-chain metrics
Bỉcoin and M2 Federal Reserve System (US)
Bitcoin vs S&P500 Correlation
Bitcoin Market Balance Index (MBI)
BTC Fama Efficiency Index Downside Alpha
Institutional Spot Traction
Delta-Thermo Market Multiple (DTMM)
Long-Term Holder Supply – LTH Supply
Long-Term Holder 30 Day Net Position Change
Bitcoin Keynes Liquidity Preference
Bitcoin Traders Unrealized Profit Ratio
Bitcoin MVRV Ratio & Rea;ized Price
Bitcoin Long Term Holder Activity Levels
Assessment and Conclusion
Current data on the Long-Term Holder Supply (LTH Supply) shows that Bitcoin's long-term supply structure has recovered significantly after the decline in early 2026. LTH Supply increased from the 11.5-12 million BTC range to nearly 15 million BTC, bringing the supply back to its highest point in the observation period.
With Bitcoin currently trading around $68,000-$70,000, the market price is approximately $18,000-$22,000 higher than the average cost basis (LTH). In terms of percentage, long-term holders are currently showing an unrealized profit of around 36-46% on their average cost basis. This is a significant profit margin, but lower than the profit levels this group experienced when Bitcoin traded above $100,000 in 2025.
From an outlook, the long-term holding structure is showing signs of improvement, but there is not enough data to confirm that the distribution pressure has ended. The increase in LTH supply reflects the expansion of the long-term holding group, but cannot automatically be considered evidence of new buying inflows or simultaneous accumulation by large wallets.


The Long-Term Holder 30-Day Net Position Change indicator currently reflects a relatively solid long-term supply structure. The total amount of Bitcoin held by the LTH group is approximately 15.9 million BTC , which is in the highest range in the historical data series on the chart and significantly higher than the lows of around 5-7 million BTC in the early years.
In terms of supply structure, the 15.9 million BTC level indicates that a large amount of Bitcoin is being held by long-term investors rather than constantly circulating in the market. This is highly significant for the circulating supply structure, as a supply that is not frequently traded can reduce the amount of BTC available for sale at any given time. However, this indicator cannot accurately determine the amount of Bitcoin actually locked or unavailable for sale, as long-term investors can still shift to a distribution phase when market conditions change.
In the coming period, the key confirming signal will not only be whether the total supply of LTH continues to remain around 15.9 million BTC, but also whether the 30-day net position volatility remains positive. If supply continues to expand while distribution activity does not increase, the long-term holding structure will continue to strengthen. Conversely, a continuous decline in LTH supply along with large negative net position volatility will indicate increasing pressure to realize profits.


Bitcoin Keynes Liquidity Preference is currently around 3-3.5% , below the 4% threshold and in the extreme greed zone according to the chart's classification system. Compared to its historical peak of around 10-11% in 2022, the index has fallen by approximately 65-70%, indicating a significant weakening of defensive sentiment and liquidity preference. However, the current level is still about 0.4-0.5% higher than the historical low recorded in early 2020.
The most notable point of the current data is that Keynesian Liquidity Preference has broken the 4% threshold in a downward direction. According to the classification system on the chart, this represents a shift from the neutral or healthy growth zone to the extreme greed zone, indicating that the market is decreasing its priority for liquidity and tending towards accepting higher risks.
However, the fact that the index fell below 4% while Bitcoin's price simultaneously corrected suggests that the decline in the index doesn't necessarily mean price strength is consolidating. Instead, the market may be experiencing a risk appetite that is no longer commensurate with price movements. Historically, the index has remained low during periods of strong Bitcoin uptrends, but it can also appear when the market approaches overheated valuations.


The Bitcoin Traders Unrealized Profit Ratio is currently showing a clear negative trend. The group's unrealized losses have fallen to around -8 to -9 billion USD, approaching the extreme low of around -9 to -10 billion USD recorded in early February 2026.
Simultaneously, the reversal from positive profits of approximately $4-5 billion in late September to deep losses in November indicates that the previous profit recovery process has been significantly disrupted. Compared to the lowest point recorded in early February 2026, the current unrealized loss value has approached that extreme level, suggesting that the current loss pressure is not simply a decline in profits after a correction, but has reached a state of tension similar to the sharp sell-off at the beginning of the year.
Based on the current data structure, the market is experiencing high unrealized loss pressure, diminishing profit margins for traders, and increased risk of selling to control losses. This signals a weakening of the market structure in the short term, especially as the price of Bitcoin simultaneously fell from the $85,000-$87,000 range to around $68,000.


Considering the entire period from 2018 to 2026, the MVRV Ratio reached approximately 4 times during the 2021 growth cycle . This is a high valuation zone, reflecting a very large gap between the market price and the actual cost of Bitcoin supply. When MVRV enters this zone, a large portion of the supply holds significant unrealized profits, thereby increasing the incentive to take profits and the pressure to distribute in the market.
Furthermore, the Realized Price has increased sharply during periods of new capital inflow into the market, particularly in 2021 and the 2024-2025 period. This shows that market valuations have narrowed the gap with the realized cost, reflecting a decline in unrealized profits compared to the previous peak.
Compared to previous cyclical lows, the market is no longer in a deeply discounted valuation state. However, the gap between market price and actual cost has narrowed significantly compared to periods of strong growth, which signals that overall investor profit margins have decreased, and the valuation structure is no longer in an overextended state.


The 30-day CDD (Cost, Deposit, and Delivery) is hovering around 400-500 million, higher than the low activity range of approximately 200-300 million seen in 2022-2023 and some points in early 2026. However, the index remains significantly lower than the historical surges exceeding 1 billion. Thus, the long-term Bitcoin supply movement has recovered from its slump, but has not yet reached an extreme level of activity.
It's important to note that an increase in CDD doesn't necessarily mean that all the recorded BTC is being sold. This indicator measures the number of coin-days destroyed when BTC is spent or moved, and doesn't directly determine the purpose of the transaction.
From a structural market perspective, current data does not show a sudden and sustained increase in the movement of long-lived supply. This is a significant difference from periods when CDD exceeded 1 billion, when the number of destroyed coin-days increased sharply and long-lived supply was activated with greater intensity. Nevertheless, the current CDD level being higher than the recent lows suggests that long-lived supply is no longer as inactive as before.
Assessment and Conclusion
Bitcoin has moved away from its historical peak above $100,000 and is currently trading around $68,000-$70,000 according to end-of-period data on the provided charts. This development reflects a clear decline in price momentum and suggests a widespread revaluation is underway, rather than just a short-term correction.
However, on-chain data has not yet shown a full-blown capitulation similar to the deep bottoms of previous cycles. Although the unrealized profits of the trading group have moved into significant negative territory, the MVRV ratio remains above 1, the supply from long-term holders remains high, and the Delta-Thermo Market Multiple (DTMM) indicator is fluctuating around 1.7. These characteristics suggest that the market has weakened significantly but has not yet fully met the pricing conditions typically seen at the bottom of a cycle.
It is noteworthy that the current correction pressure is not only reflected in the price of Bitcoin but also in the weakening of institutional capital flows, the distribution activities of long-term investors, and the narrowing of profits for market participants. Therefore, the outlook for the next phase needs to be assessed based on the ability to absorb the supply being distributed, rather than solely on short-term price rallies.
In the short term, Bitcoin remains at risk of continued negative volatility if institutional capital flows do not improve and supply from long-term investors continues to increase. In the medium term, the current valuation range may facilitate accumulation, but confirmation signals are needed from a recovery in capital flows, stabilization of LTH supply, and the maintenance of valuation indicators above key thresholds.
Disclaimer
This report was prepared by HCCVenture Research with the aim of providing information, research, and market analysis. The entire content of the report is based on publicly available data, on-chain data, market data, venture capital (Venture Capital) data, macroeconomic data, and HCCVenture's internal research methodologies at the time of publication. Data sources are compiled from numerous reputable research platforms and organizations, including but not limited to Glassnode, CoinGecko, TradingView, Dune Analytics, CoinGlass, CryptoRank, RootData, PitchBook, DefiLlama, CryptoQuant, Messari, Token Terminal, Artemis, CoinMarketCap , public blockchain data, reports from financial institutions, investment funds, blockchain companies, and other publicly available information sources. HCCVenture strives to select reliable data sources and applies a verification and cross-checking process throughout its research. However, HCCVenture does not guarantee the completeness, accuracy, timeliness, or error-free nature of all data due to differences in statistical methods, data collection scope, update times, or adjustments from data providers.
All opinions, assessments, valuation models, cyclical analysis, on-chain data, capital flow analysis, Venture Capital activity, ETFs, Digital Asset Treasury Companies (DATs), technical indicators, macroeconomic indicators, and scenarios presented in this report reflect only the research views of HCCVenture Research at the time of publication, based on available assumptions and data. These contents are not investment advice, financial advice, legal advice, accounting advice, tax advice, brokerage advice, portfolio management advice, or recommendations to buy, sell, or hold any digital asset, security, financial product, investment fund, blockchain protocol, or business. The digital asset and blockchain markets are highly volatile and are influenced by global liquidity, monetary policy, regulatory regulations, macroeconomic conditions, and many other unpredictable factors. Therefore, the trends, patterns, correlations, or historical cycles mentioned in this report are not guaranteed to repeat in the future and should not be considered reliable predictions of market developments. Readers should conduct their own independent research ( DYOR – Do Your Own Research ) and consult with qualified financial, legal, tax, or investment professionals before making any decisions. Any investment decisions or actions arising from the use of information in this report are the sole responsibility of the reader.
HCCVenture, its affiliates, research team, personnel, or related parties may own or will own digital assets, invest in blockchain projects, investment funds, technology companies, or maintain commercial, research, media, consulting, or collaborative relationships with the organizations, protocols, businesses, or platforms mentioned in this report. These relationships may create actual or potential conflicts of interest, although HCCVenture always applies internal research standards to maintain objectivity and independence in its analysis. Nothing in this report is construed as an offering, brokerage, promotion, fundraising, or provision of investment services as regulated by any country or territory. The entire content of this report is protected under intellectual property and copyright law. It is strictly prohibited to copy, modify, reproduce, distribute, or use all or part of this report for commercial purposes in any form without the written consent of HCCVenture. Accessing, using, or quoting this report signifies that the reader has understood, accepted, and agreed to the entire content of this disclaimer.
Explore HCCVenture group
HCCVENTURE QUANT JSCO
© 2026 HCCVENTURE. ALL COPYRIGHTS RESERVED.


Connect with us
Popular content
Contact to us
Address: 8th Floor, Bach Dang Complex Building, 50 Bach Dang Street, Hai Chau Ward, Da Nang City, Vietnam.
Phone: 1900 1509
Gmail : sp_contact@hccventure.com
Disclaimer: The information on this website is for informational purposes only and should not be considered investment advice. We are not responsible for any risks or losses arising from investment decisions based on the content here.
TERMS AND CONDITIONS • CUSTOMER PROTECTION POLICY
ANALYTICAL AND NEWS CONTENT IS COMPILED AND PROVIDED BY EXPERTS IN THE FIELD OF DIGITAL FINANCE AND BLOCKCHAIN BELONGING TO HCCVENTURE ORGANIZATION, INCLUDING OWNERSHIP OF THE CONTENT.
RESPONSIBLE FOR MANAGING ALL CONTENT AND ANALYSIS: HCCVENTURE FOUNDER - TRUONG MINH HUY
Read warnings about scams and phishing emails — REPORT A PROBLEM WITH OUR SITE.