On-chain analysis week 45/2025: What will be the driving force for Bitcoin's recovery?
This delicate equilibrium will continue, sideways or falling around $100,000 until net inflows return and the $112,000–$113,000 level is reclaimed as support.
11/11/202510 min read

Market Summary
Over the past two months, Bitcoin has maintained a narrow range around $100,000–$105,000 , reflecting tight liquidity and supply-demand balance pressures . The Supply/Profit Ratio is at 7.1 % , a typical level for a mid-cycle re-pricing , while the Relative Unrealized Loss at 3.1% suggests a low probability of loss.
The hold cost model indicates that STH's Cost Basis (~112.5k) is a trend test. The breakdown and failure to reclaim confirms the previous rally is over; the current structure is a rebalancing under distribution pressure. The 100k area has become a " defensive pivot " both technically and psychologically — where defensive money ( short-term gamma hedges/buys ) has been most active.
Since July, LTH Spend Volume has been steadily increasing; net LTH supply has decreased by ~300k BTC . The main difference has been that they have been selling on dips , rather than on breakouts like in the first half of the cycle. This has lengthened the time it takes for supply to be absorbed, forcing the market to accumulate sideways for a longer period before it can re-establish its trend.
Long-Term Holders (LTH) supply has decreased by approximately 300,000 BTC since July , reflecting strategic profit-taking amid weak prices. Notably, unlike previous bull runs, LTH are now selling when prices are flat or falling, suggesting they are restructuring their portfolios rather than “ chasing the rally .”
On-chain metrics analysis
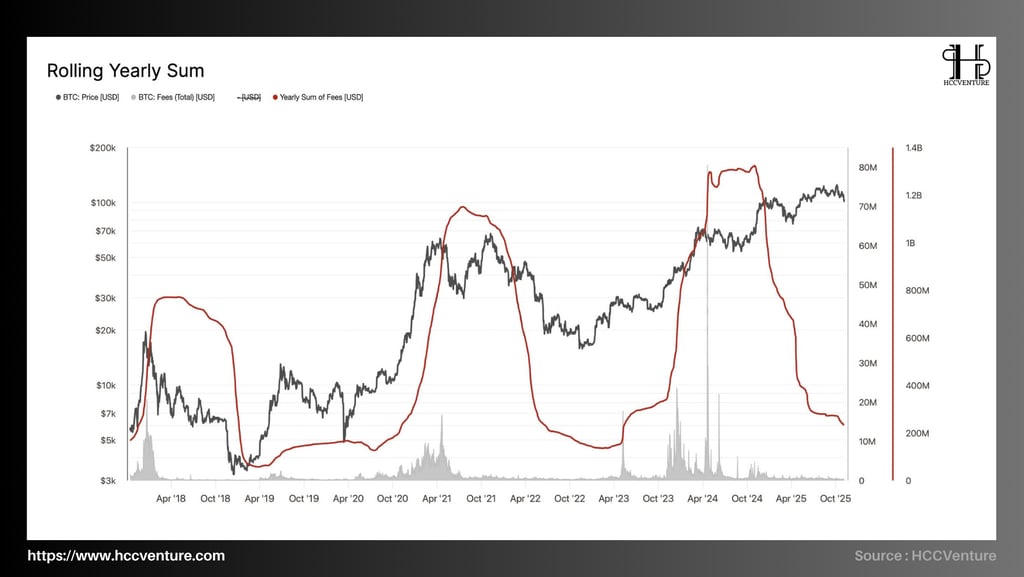
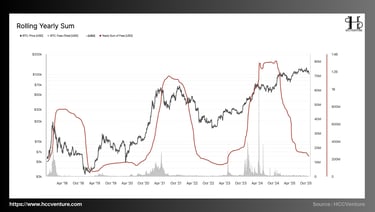
Rolling Annual Fees (RSF) is one of the core indicators of the internal health of the Bitcoin network . It measures the total fees ( USD ) paid by users to miners over the past 365 days , directly reflecting the network's usage, actual transaction demand , and profitability . Unlike price, which is susceptible to speculative sentiment, RSF represents the " economic temperature " of the system, where on-chain activity actually takes place.
Since 2017, every Bitcoin bull cycle has been accompanied by a surge in RSF , indicating a surge in network demand, followed by a decline as capital leaves the chain. Currently, the latest data shows that RSF is in a sharp correction after the 2025 cycle peak - similar in morphology to the cooling periods after the strong price increases in 2018 and 2021.
Over the seven years of observation, the RSF index has experienced three major boom periods coinciding with Bitcoin price peaks :
2017–2018 Cycle: Transaction fees peak as network overloads, total RSF spikes to record levels and then drops over 80% as ICO bubble bursts.
2020–2021 Cycle: On-chain demand surges with DeFi and NFT wave , pushing RSF above 2017 levels, reflecting broader and more sustainable activity.
2024–2025 Cycle: The most recent RSF peak was formed when Bitcoin surpassed $100,000, supported by spot ETF inflows, Ordinals momentum , and core layer crypto minting. RSF peaked at similar levels as 2021, before weakening significantly from Q2 2025.
It is noteworthy that the RSF bottom of each new cycle is higher than the previous cycle, showing that the network's usage structure is being upgraded in quality. Every time the RSF cools down, it no longer means " recession " but " restructuring " - when the Bitcoin network eliminates speculative transactions, moving towards more practical and organized activities .
Structurally, the RSF chart shows the current curve moving close to cyclical support, similar to the “ post-recession consolidation ” points in 2019 and 2022. In both previous cases, the RSF stabilized for a few months before rebounding with the next liquidity expansion phase of the market.
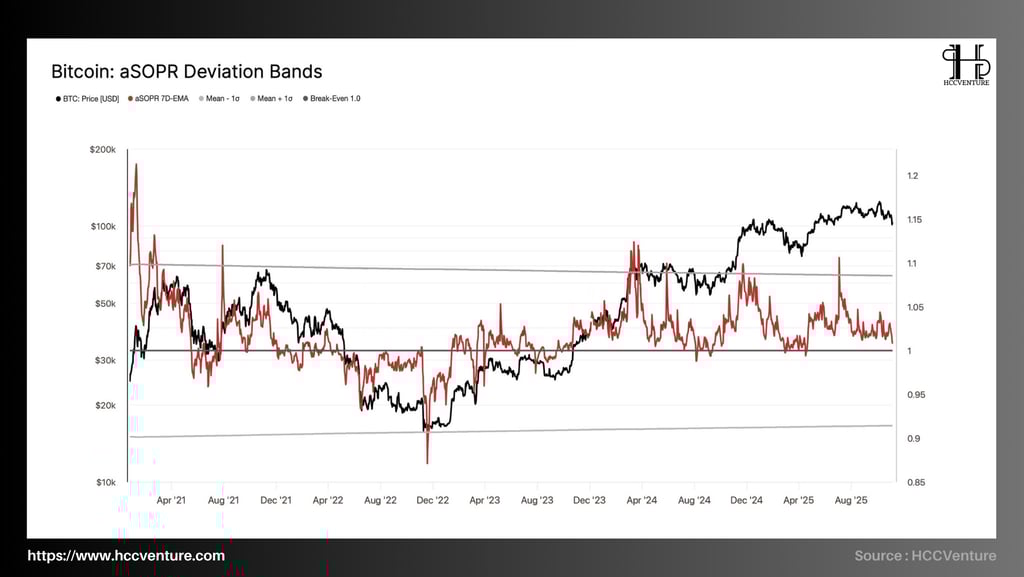

aSOPR ( Adjusted Spend Output Profit Ratio ) measures the “ profit/loss ratio ” of a UTXO when spent. When aSOPR > 1, the majority of capital is realizing profits; < 1 is a stop loss . The aSOPR Normalized Deviation Band variation around the mean and standard deviation ( ±1σ ), helps to statistically determine the euphoria/capitulation threshold.
Currently, the 7D EMA aSOPR is hovering around 1.02–1.04 , above the 1.0 breakeven point but below the +1σ band ( ~1.06–1.08 ), confirming a period of profit cooling. The market still maintains a structural uptrend, but the momentum has weakened, the profit flow has been absorbed, and the breakout momentum has not been re-established.
The fact that aSOPR is slightly above 1 suggests that profit-taking selling pressure is being absorbed without pushing the market into a loss-making mode. However, as it has not yet exceeded +1σ sustainably, the buyers have not yet triggered a bullish momentum to open a new wave ; this is consistent with the recent re-leverage and reduced realized volatility context.
Bullish base case (higher probability): aSOPR continues to hold ≥ 1.00 and breakout > +1σ with improved spot/stablecoin liquidity → triggers an impulse wave to retest the recent top.
Risky case (need to defend): aSOPR closes < 1.00 consecutively for ≥ 7 sessions , especially if it crosses -1σ (~0.97) → distribution phase reversal signal, prioritize reducing beta, increasing cash/hedge ratio
The aSOPR Deviation Band data currently favors a stronger accumulation scenario than a recession: the 1.00 threshold is still respected, but there is no confirmation of new momentum ( as it has not yet occupied the +1σ band ). Therefore, the structural uptrend of the cycle remains intact, but it needs time to absorb profit-taking pressure before a sustainable breakout can form.


The Net Position Change over the last 1 year of activity reflects the amount of Bitcoin that has not been moved in at least 1 year - an important indicator in assessing the sentiment and accumulation behavior of long-term investors (Long -Term Holders - LTH ). In on-chain analysis, this indicator has special significance because it represents the level of " confidence " and " holding commitment " in the asset, thereby helping to identify cyclical accumulation or distribution phases of the Bitcoin market .
Since 2018, the “ dormant ” Bitcoin supply over 1 year ( Over 1 Year Supply ) has typically surged during periods of deep price declines or after major corrections , reflecting the accumulation mentality of long-term investors when the market is in a state of fear.
Moving into the second half of 2025, the latest data shows that this index is trending down slightly to around 13.1 million BTC , marking a natural distribution phase for long-term investors. The decrease is not large, but enough to reflect the return of profit-taking activities from the LTH group as Bitcoin price remains around the high range of 110,000 - 120,000 USD.
The Net Position Change metric – which represents the net change in the amount of “ dormant ” Bitcoin – has now turned from positive to negative, suggesting the rate of accumulation is slowing.
This means that long-term investors - those who hold large amounts of Bitcoin - are starting to see profits, but the distribution rate remains within a " manageable " range, not creating sudden selling pressure. The market still shows a sustainable structure as the volume of BTC moving from long-term wallets does not exceed 1% of the total supply within 30 days , significantly lower than the initial distribution periods in 2017 and 2021.
In terms of long-term cycles, a decline in supply “ over 1 year ” after a historical peak typically signals a change in market phase – from “ accumulation phase ” to “ steady distribution phase ”. Long-term investors are gradually transferring liquidity to new investors, which typically happens in the middle phase of a bull market (mid-cycle).
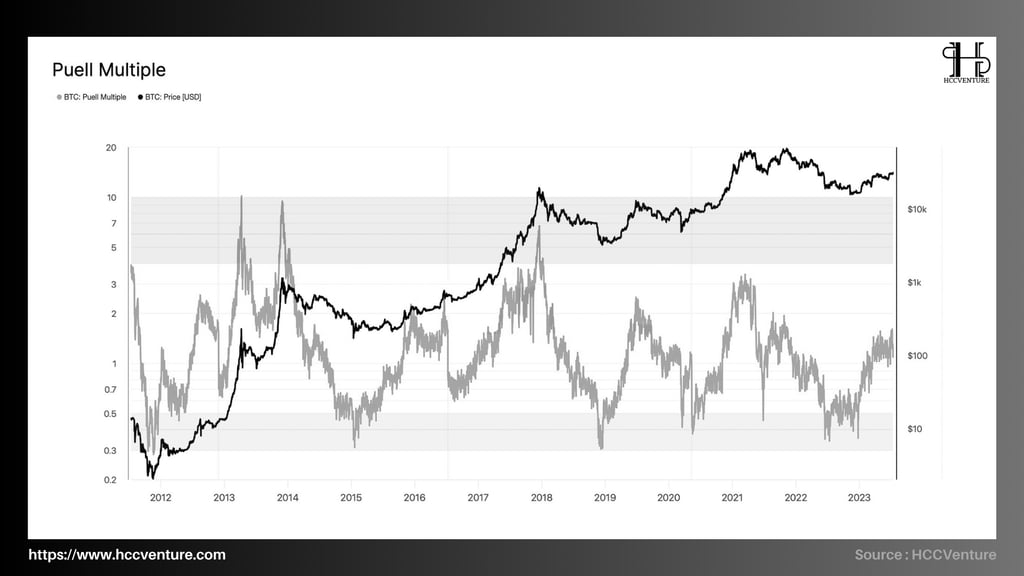
The Puell Multiple is considered one of the macro tools that reflects the revenue situation of Bitcoin miners compared to the historical average value. This index is calculated as the ratio between the daily revenue of miners and the 365-day average value of that index.
Updated data through November 2025 shows the Puell Multiple hovering around 1.2–1.4 , significantly higher than the 0.3–0.5 bottom in the 2022 bear market, but still well below the 5–10 range that characterized extreme bull runs like 2013 , 2017, and 2021.
In the previous cycle, the Puell Multiple peaked at 7.3 in April 2021, coinciding with Bitcoin 's peak of $64,000 , before plummeting to 0.33 in December 2022 when BTC fell to $15,500 . This deep correction represented a " washout " of miners' profit margins, forcing many weak miners to leave the network.
Since the beginning of 2023, the index has recovered steadily and maintained the neutral zone (1-2), showing that miner revenue is returning to a state of balance , no longer under strong selling pressure, but has not yet exploded like in previous bull market periods.
Notably, since June 2024, the increase in Puell Multiple has been accompanied by the stabilization of the entire network hashrate and the growth of transaction fee revenue - a sign that the mining economy is entering a period of sustainable recovery.
The current stability of the Puell Multiple is positive for Bitcoin 's ability to sustain its price . With miner profitability in neutral territory, the market is not under excessive technical selling pressure and has not yet been swept into a state of excessive euphoria.
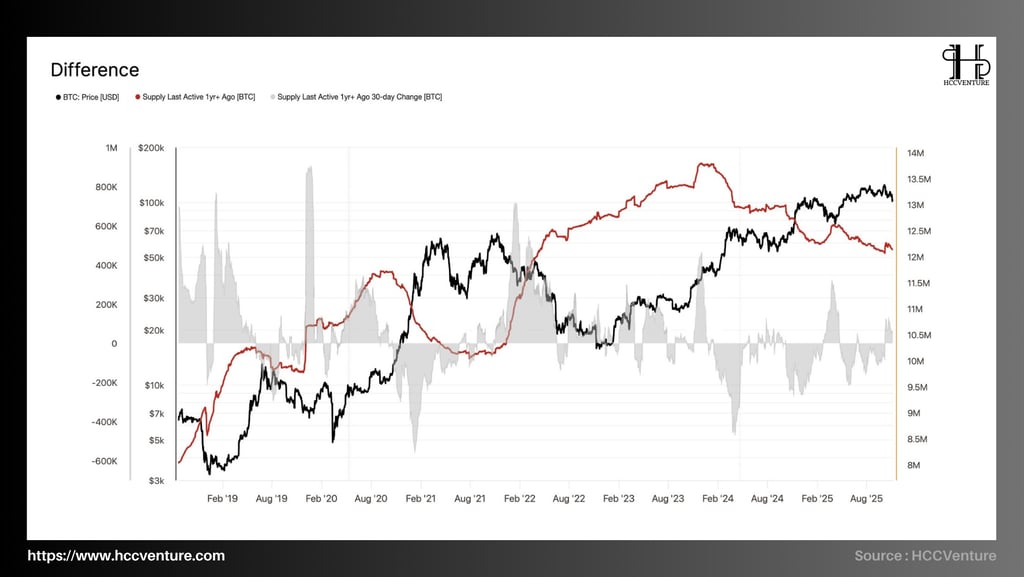
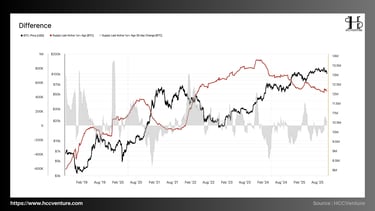
The Last Active Supply Difference 1 Year+ reflects the change in the volume of Bitcoin that has not moved in more than a year — the amount of BTC “ sleeping ” in long-term wallets. This is one of the core metrics to assess Long-Term Holders (LTH) confidence and their willingness to sell in the current market cycle.
2020–2021: Bitcoin 1 year+ supply surges from around 10.5 million BTC to over 13 million BTC , coinciding with the accumulation phase before the price spiked to a peak of $69,000.
Late 2021 – Mid-2022: The index begins to decline as Bitcoin prices correct deeply, indicating distribution pressure from long-term investors — which is also a signal that growth momentum is weakening before the market enters a “ bear market ” phase.
From 2023 to present (Q4/2025): After peaking at nearly 13.9 million BTC in early 2024, the amount of Bitcoin 1 year or older began to decrease to about 12.3 million BTC , corresponding to the period when the market entered the distribution phase after halving . The decrease amplitude was about 1.6 million BTC , equivalent to nearly 8% of the long-term supply - the largest decrease since 2021.
Currently, the 1+ Year Ending Active Supply is hovering around 12.3 million BTC , 1.6 million lower than the 2024 peak but still significantly higher than early 2021. This suggests that the majority of long-term investors are still holding positions, with no mass exits yet.
In addition, the net distribution volume ( net position change ) has gradually decreased to the balance zone, showing that LTH's selling pressure is weakening . This is a positive signal indicating the possibility of the market entering a medium-term accumulation phase, preparing for a growth cycle after halving.

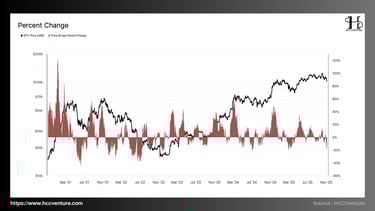
The Percent Change Index, which represents the rate at which Bitcoin prices change over a 30-day period, is one of the tools used to measure short-term market volatility. When this index reaches an extreme ( positive or negative ), it reflects the euphoric or panic phases in the price cycle. Looking at the data from 2021 to 2025, Bitcoin 's 30-day volatility has narrowed after each cycle, indicating that the market is entering a more mature phase with a clearly controlled fluctuation range.
During the 2021–2022 period , peak 30-day volatility typically exceeds 80–100% , corresponding to sharp price increases following FOMO capital flows and a surge in global liquidity. However, as we move into the 2023–2025 period, the maximum volatility range will be only around 40–60% , reflecting a significant decline in speculative behavior and relative stability of institutional money flows.
On the other hand, sharp declines ( negative 30–50% ) will also become rarer, indicating that selling pressure has been effectively absorbed by long-term holdings ( LTH ) – a factor that plays a fundamental role in the current accumulation structure.
As of November 2025, Bitcoin's 30-day price change is hovering around -10% to 0%, significantly lower than the average correction of -25% during the 2022 period. This reflects a " coastal regime " in the market, where short-term supply and demand shocks have been mitigated, while new money flows remain moderate, enough to stabilize the price around $110,000–$115,000.
The continued decline in the 30-day volatility range is a positive signal from Bitcoin 's macro structure . It shows that the market has passed the hot speculative phase and is moving towards a stable state of institutional and long-term capital flows. In the short term, this may cause Bitcoin's price to fluctuate narrowly and create a feeling of " lack of momentum ", but in the long term, this is the foundation for the next expansion cycle - similar to the 2019-2020 period before the market entered a full-blown bull phase.
Evaluation and Conclusion
In terms of cycles, the “ Days to Halving ” and “ Realized Market Cap to Valuation ” data show that the market is moving in line with the historical trajectory of the strong price increase in the 12–18 months after the Halving has paused, entering a “ moderation ” zone similar to the 2017 and 2021 periods. The Market Cap/Realized Market Cap ratio remains stable around 2.3–2.5 , not signaling a bubble but reflecting increasing profit-taking pressure.
The chain structure confirms that Bitcoin is still in the mid-cycle phase ( Mid-Cycle Re-Accumulation Phase ) – when the price has not yet reached the “ overvalued ” state but is no longer in the “ deep value ” zone. Therefore, the 2024–2028 cycle is re-establishing the growth pattern of the 2016–2020 period, with a correction amplitude of about 25–30% around the short-term peak before forming a solid price foundation for the next explosive phase.
Analysis of “ Last Active Net Position Change Over 1 Year ” and “ Discrepancy Index ” shows that long-term holdings have slightly decreased by about 300,000 BTC since mid-year, reflecting reasonable profit-taking by long-term investors after the price period above $110,000 . However, the proportion of coins “ not moving in over 1 year ” remains above 65% of total supply, the highest level since early 2022, indicating that long-term confidence still has absolute dominance.
Total annual transaction fees have fallen more than 40% since their peak in Q2 , reflecting slowing on-chain activity, but also reflecting lower network fees, which help maintain miner economic efficiency. This reinforces a “ stable equilibrium ” structure, similar to the mid-2019–2020 period , before the market continued to rise.
Disclaimer: The information presented in this article is the author's personal opinion in the cryptocurrency field. It is not intended to be financial or investment advice. Any investment decision should be based on careful consideration of your personal portfolio and risk tolerance. The views expressed in this article do not represent the official position of the platform. We recommend that readers conduct their own research and consult with a professional before making any investment decisions.
API & Data: Glassnode
Compiled and analyzed by HCCVenture
Join HCCVenture here: https://linktr.ee/holdcoincventure
Explore HCCVenture group
HCCVenture © 2023. All rights reserved.


Connect with us
Popular content
Contact to us
E-mail : sp_contact@hccventure.com
Register : https://linktr.ee/holdcoincventure
Disclaimer: The information on this website is for informational purposes only and should not be considered investment advice. We are not responsible for any risks or losses arising from investment decisions based on the content here.
TERMS AND CONDITIONS • CUSTOMER PROTECTION POLICY
ANALYTICAL AND NEWS CONTENT IS COMPILED AND PROVIDED BY EXPERTS IN THE FIELD OF DIGITAL FINANCE AND BLOCKCHAIN BELONGING TO HCCVENTURE ORGANIZATION, INCLUDING OWNERSHIP OF THE CONTENT.
RESPONSIBLE FOR MANAGING ALL CONTENT AND ANALYSIS: HCCVENTURE FOUNDER - TRUONG MINH HUY
Read warnings about scams and phishing emails — REPORT A PROBLEM WITH OUR SITE.