


On-chain analysis week 44/2025: Stablecoins are booming, USD's position
Stablecoins – the central liquidity infrastructure of the entire decentralized market. Amid the growing demand for stablecoins, the supply of Stablecoins has reached over $300 billion, the highest level in history.
11/3/202511 min read


Summary of the situation
The total circulating value of the top Stablecoin group ( USDT, USDC, DAI, FDUSD, TUSD ) reached 265 billion USD , up more than 40% over the same period last year. USDT alone accounts for nearly 70% of the market share , continuing to consolidate its leading position in liquidity on centralized exchanges.
The 7-day average trading volume of USDT and USDC reached over 420,000 and 310,000 transactions/day , respectively, record highs since 2021. This growth reflects the expanding role of Stablecoins in decentralized applications ( DeFi ), derivatives trading, and cross-border remittances.
Data shows that positive net inflows into exchanges increased by more than $8 billion in Q3 2025 , indicating that investors are preparing liquidity for a new buying cycle. This is a positive signal because history shows that large stablecoin accumulations on exchanges usually precede Bitcoin's recovery by 1-2 months.
The Stablecoin Supply Ratio indicator is currently down to -2.1 , which corresponds to the bottom of the strong rallies in 2020 and 2023. This shows that the buying power of Stablecoins is relatively high , or in other words, the amount of money “ waiting outside ” in the system is large enough to trigger the next liquidity injection when market confidence returns.
Analyzing on-chain metrics
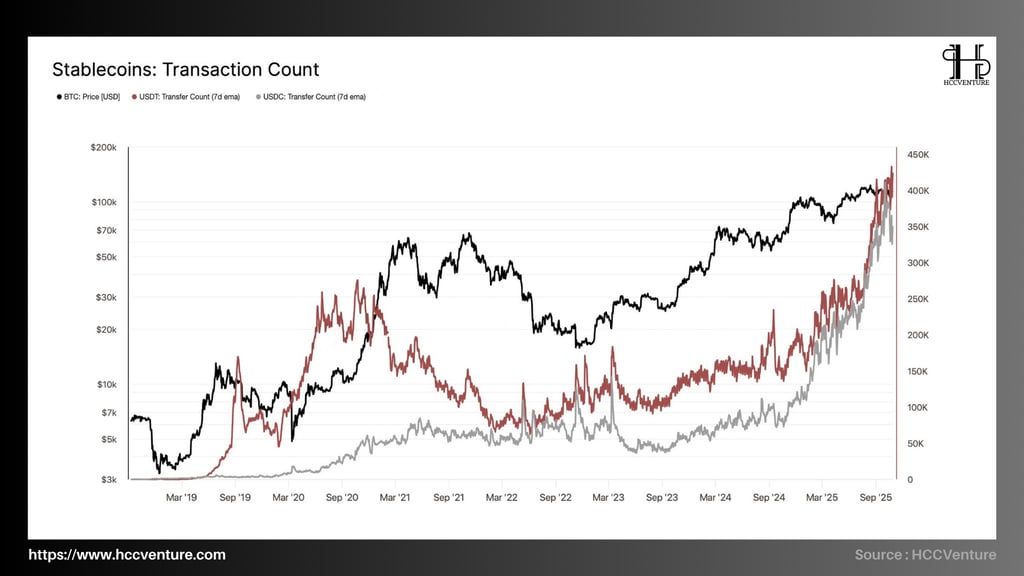
Stablecoin trading activity is literally exploding. USDT (7D-EMA) trading volume is steadily increasing to around 420–450k trades/day , while USDC is at around 270–320k trades/day —both well above their 2021 peaks.
The synchronization of the two largest stablecoins confirms that on-chain USD demand is growing steadily , uninterrupted by BTC corrections. In the context of low free Bitcoin circulation controlled by LTH, endogenous liquidity from stablecoins becomes a lever to amplify any return of spot/ETF flows.
Observing the time series from 2019 to present shows that the USDT line (blue) and the USDC line (gray) both entered an exponential growth phase since the end of 2024. In which:
USDT has surpassed 300,000 trades/day since Q1 2025 and continued to expand to ~4.2–4.5×10⁵ trades/day recently.
USDC gradually increases from a base of 70–120,000 trades/day in early 2024 to ~2.7–3.2×10⁵ trades/day.
The slopes of the two 7D-EMAs have barely abated, indicating that these are not short-term “spikes” but rather a base of actual usage demand. During the 2020–2021 cycle, USDT trading volume mainly fluctuated at ~200–300,000 trades/day ; while USDC only reached ~80–120 thousand trades/day . Currently, both have simultaneously surpassed their previous peaks by 40% , reaching more than 2 times , indicating a larger and more diversified liquidity base.
In terms of cycles, Bitcoin's sustained bull run has always been accompanied by stablecoin expansion ( 2019→2021, 2023→2025 ). The difference in this cycle is that USDC has accelerated strongly alongside USDT , implying increased institutional/fintech participation along with global retail capital flows.
Stablecoin-led on-chain liquidity is at its strongest in the cycle and is a key variable for Bitcoin's next bull run. The fact that USDT and USDC both hit all-time highs in trading volume shows that on-chain USD demand is sustained and diversified, while the available BTC supply is limited and derivatives leverage has been reset.
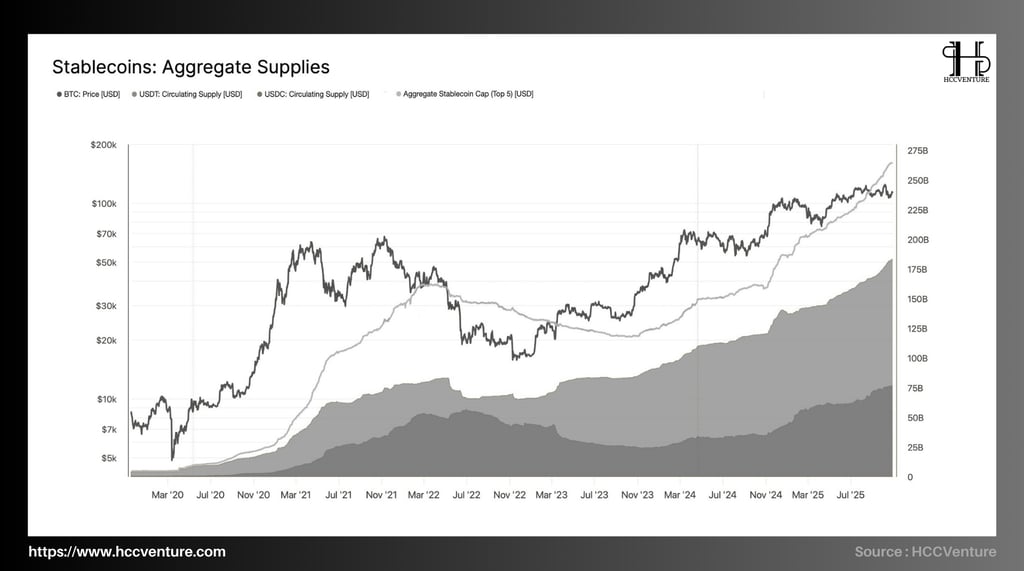
As of October 2025, USDT continues to dominate with a circulating capitalization of around $180 billion , accounting for nearly 67% of the total stablecoin market share . USDC, after a sharp correction in 2023, has made an impressive recovery and is now at $62 billion, up more than 40% year-on-year. Notably, the stablecoin supply growth rate in 2025 averages 2.5-3% per month , equivalent to around $5-7 billion in new net capital injected into the crypto system.
Compared to the liquidity bottom in 2022 - when the total stablecoin capitalization hovered around $125 billion, the current supply has more than doubled, clearly reflecting the return of institutional capital, especially through ETF products, tokenized treasuries, and cross-chain stablecoin trading.
During the 2019–2021 cycle, when the total stablecoin capitalization increased from $25 billion to $150 billion , the price of Bitcoin increased by more than 2,000%, from $3,000 to $69,000. The current cycle is showing a similar trajectory, but with larger capital inflows and a more stable expansion rate. In particular, as the ratio between stablecoin capitalization and BTC market capitalization ( Stablecoin Supply Ratio - SSR ) continues to decline, this reflects the increasing ability to purchase BTC with stablecoins — a clear signal of price growth.
Currently, the total supply of stablecoins continues to increase steadily despite the temporary correction in Bitcoin prices. This shows that selling pressure is waning , while potential buying power from stablecoins is still accumulating. This behavior is similar to the pattern of a re-accumulation phase before entering a strong growth phase — similar to the 2020–2021 cycle.
The total global stablecoin supply is now around $300 billion, up more than 22% year-on-year in 2024 , showing that liquidity in the crypto ecosystem has recovered strongly. Specifically, USDT accounts for 71% of the total supply, USDC accounts for 18%, the rest belongs to DAI, FDUSD and PYUSD.
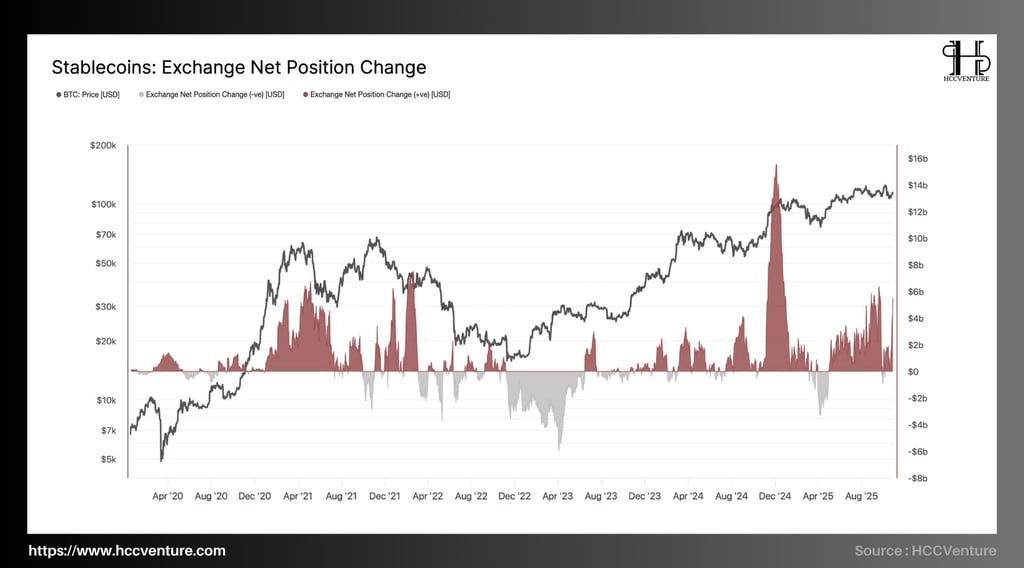
The second half of 2025 marks a profound change in stablecoin capital flows on centralized exchanges (CEX). The Exchange Debt Position Change Index - reflecting the net amount of stablecoins deposited or withdrawn from exchanges - has recorded steady growth since Q2 2024 and broke out sharply in Q3 2025. Total net stablecoin deposits reached +12 billion USD in the past 30 days , equivalent to the largest scale since early 2021 - when the market entered the parabolic growth phase of Bitcoin.
Comparing historical data, periods of strong stablecoin “ inflows ” (blue areas on the chart) have always coincided with periods of bullish re-pricing in Bitcoin.
December 2020 – April 2021: average net stablecoin deposits of +5 to +7 billion USD/month.
January 2024 – March 2024: inflow reaches +8 billion USD.
Current (October 2025): net inflows exceed +$14 billion, setting a new high.
Stablecoin withdrawals from exchanges – often signal periods of accumulation or correction. For example, Q2 2022 saw outflows of -$6 billion , accompanied by a sharp drop in Bitcoin from $47,000 to $17,000. The current data is in stark contrast to that backdrop, with stablecoin capital returning to the market at its strongest level since 2021.
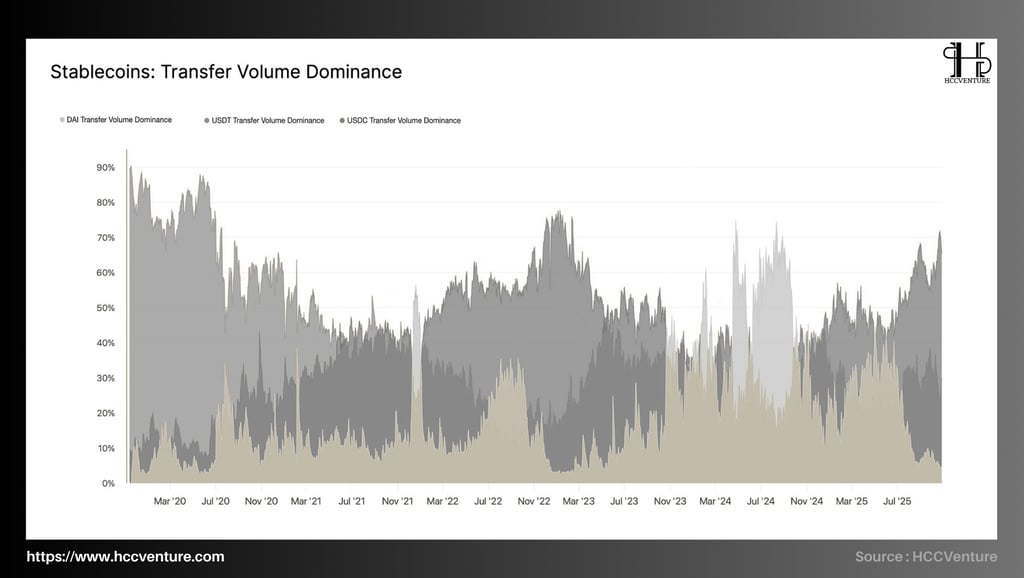
The Stablecoin Transfer Volume Dominance metric measures the ratio of each stablecoin's transfer volume to the total stablecoin volume in circulation on the network. The three main representatives observed are USDT (Tether), USDC (Circle), and DAI (MakerDAO).
This index serves as a liquidity indicator, reflecting capital flows in the cryptocurrency market, especially as these stablecoins are the main liquidity bridge for both centralized exchanges (CEX) and decentralized exchanges (DEX).
From early 2020 to late 2025, on-chain data shows USDT consistently dominating in terms of absolute transaction volume, with a peak in early 2020 reaching over 90% of total stablecoin transaction volume. However, this trend will gradually change as USDC and DAI expand their market share, especially in 2022–2024, when the DeFi market recovers strongly and the demand for transparent liquidity increases.
USDT: Maintains leadership with market share hovering around 55–70% in 2024 , recovering to around 72% in Q4 2025 , corresponding to the period when Bitcoin approaches the $110,000–$115,000 price range.
USDC: After accounting for 35–40% during the DeFi liquidity expansion phase in late 2022, USDC's trading market share will decline to 25–28% by mid-2025 , reflecting the shrinking of fiat flows as international exchanges shift their focus to USDT.
DAI: Trading volume hovers around 5–10% , increasing slightly as the market stabilizes , demonstrating DAI's role as an autonomous liquidity layer in decentralized systems.
Currently, USDT trading volume has exceeded 70% , approaching the peak set during the 2021 bull cycle. This shows that capital flows into the market are highly speculative, as investors prioritize stablecoins with global liquidity and few legal constraints.
If the current growth rate is maintained, stablecoin trading volume could reach a record high in Q1 2026, with USDT accounting for more than 75% of total volume , thereby significantly supporting the growth momentum of Bitcoin and the digital asset market in general.
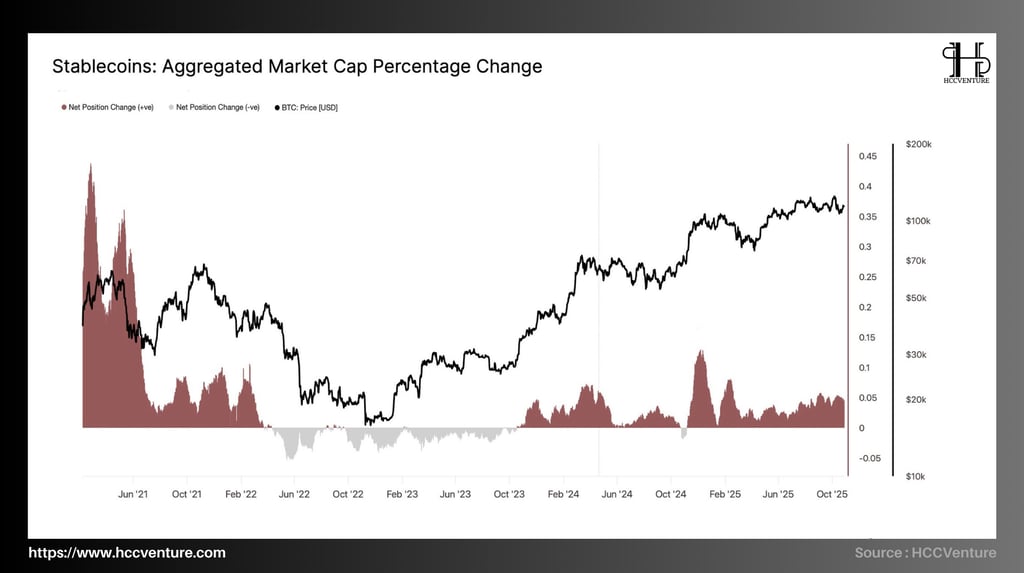

The Aggregate Market Cap Change Rate reflects the percentage change in the total market capitalization of major stablecoins ( USDT, USDC, DAI, TUSD, BUSD, etc. ) over time. It is one of the most sensitive indicators for measuring liquidity flows into or out of the crypto market, which in turn has a direct correlation with the price movements of Bitcoin and risky assets.
In the current macro environment (end of 2025), stablecoins act as liquidity storage tools and investment intermediaries between fiat currencies and digital assets. Therefore, stablecoin capitalization fluctuations not only reflect market sentiment but also serve as an early indicator of global liquidity expansion or contraction cycles in the crypto ecosystem.
2021 Phase: The market witnessed record stablecoin capitalization growth, posting a net increase of more than 0.45 (or more than +45%) as USDT, USDC, and BUSD all expanded their supply during the DeFi and NFT boom.
2022 – 2023: Following the collapse of Terra-LUNA and the global liquidity crisis , the index recorded a sharp decline, with a steady capitalization decline around -0.05 to -0.1 , corresponding to a net withdrawal of tens of billions of USD from the ecosystem.
Recovery phase 2024 – 2025: From Q2 2024, the growth index returns to positive and remains stable around +0.05 to +0.15 , indicating a clear return of new capital flows. In particular, strong growth in Q4 2024 and Q1 2025, when the total stablecoin capitalization increased by more than 35 billion USD in just 3 months.
The consistent growth of many stablecoins shows that new capital is coming from both sides — institutions and individuals, instead of focusing solely on short-term speculation as in previous cycles. This is a signal of a more stable and mature market structure, with more decentralized liquidity and higher capital absorption capacity.
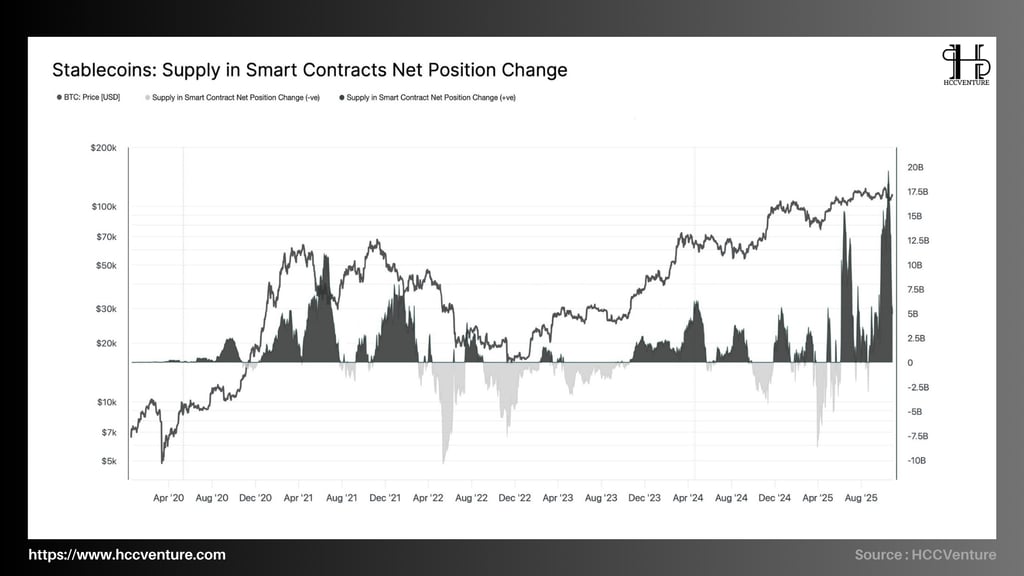
Net Position Change Smart Contract Stablecoin Supply reflects the amount of stablecoins ( USDT, USDC, DAI, etc. ) that are net deposited into or net withdrawn from smart contracts on decentralized platforms such as Ethereum, Arbitrum, Polygon or other Layer 2 EVMs.
This is an important metric to assess the level of activity and liquidity flowing into the DeFi ecosystem, thereby indirectly reflecting the confidence and risk-taking level of investors in the cryptocurrency market in general.
When net deposits of stablecoins (blue) surge, this indicates that money is flowing back into the market, ready to engage in yield farming, lending, staking, or buying digital assets. Conversely, periods of net withdrawals (gray) indicate defensive or divestment sentiment, which often accompanies sharp Bitcoin price corrections.
Notably, recent net deposit peaks have been more stable in size than before, reflecting a more mature market structure - capital flows are evenly distributed between lending protocols , DEXs, returns are stable and no longer speculative as in the 2021 cycle.
The increase in net stablecoin deposits into smart contracts in 2025 shows a strong recovery of the DeFi ecosystem after more than two years of decline. Some notable factors in the current capital flow structure include:
Institutional Interest: Funds and digital asset managers have increased liquidity provision on Aave, MakerDAO, and new protocols like Ethena or Curve 2.0.
Growth of Layer 2 platforms: Most new stablecoin flows are deposited into Arbitrum, Base, and Optimism, reflecting the trend of capital shifting to networks with low transaction costs.
Real yield stability: DeFi yields are currently at 4–6%/year, lower than in 2021 but more stable and supported by “natural” stablecoin cash flows (real yields), rather than token inflation rewards.
Structurally, stablecoin flows are shifting from “defensive” to “active investment,” while supply on exchanges is decreasing, reflecting that capital is being locked in activities that offer real yields rather than short-term speculation.
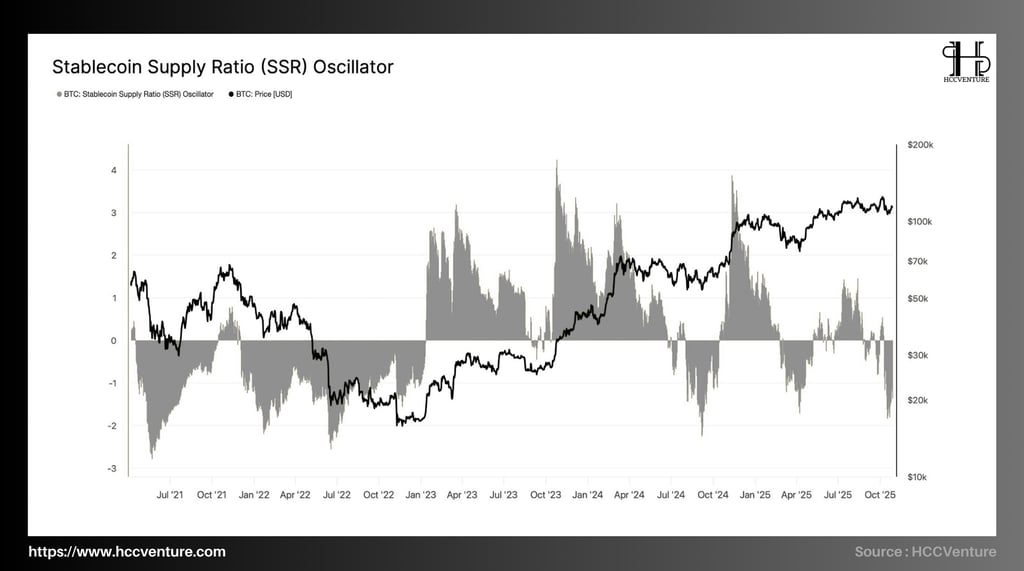
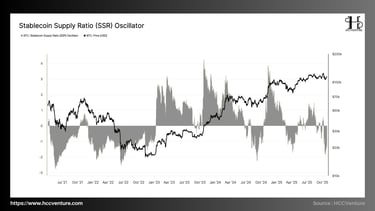
The Stablecoin Supply Ratio (SSR) is one of the core metrics in analyzing liquidity in the cryptocurrency market, especially when assessing the potential purchasing power of stablecoins compared to Bitcoin. This metric measures the ratio between the circulating supply of Bitcoin and the total capitalization of stablecoins, thereby reflecting the level of “liquid fuel” that is ready to be converted into demand for Bitcoin.
The latest data shows that the SSR Indicator is hovering around -2 , its lowest level since mid-2022. In previous cycles, when the SSR Index dropped deeply below -1 , the market often recorded strong liquidity accumulation from stablecoins — a sign that the amount of USD is at a high level, ready to return to crypto flows when there is a recovery signal.
Compared to the 2020–2021 bull run, SSR remains in a positive range of +1 to +3 , indicating that the majority of stablecoin supply has been converted into spot capital. In contrast, in the current cycle (Q3–Q4/2025), the SSR index continues to be in a deep and stable negative range, reflecting that a large amount of stablecoins are still “anchored ” in wallets or smart contracts, not yet heavily disbursed into Bitcoin.
Observing the Bitcoin price chart combined with the SSR Oscillator indicator shows that: every time the SSR drops sharply to the -2 zone or lower, the Bitcoin price usually hits a mid-term bottom and prepares to enter a recovery phase (for example: bottoms in July 2021, November 2022 and August 2024).
Combining data from the SSR Oscillator indicator, it can be affirmed that the market is in a pre-expansion phase, with abundant stablecoin reserves and relatively low selling pressure. The fact that SSR remains in a deep negative zone shows that potential demand is still large, while the circulating supply of Bitcoin has not increased significantly.
Evaluation and Conclusion
Stablecoins are becoming the central liquidity pillar of the digital economy, acting as a bridge between traditional assets and the blockchain world. Amid global economic uncertainty, the surge in stablecoin flows reflects the trend of strategic sheltering and liquidity accumulation. The total supply of stablecoins as of the end of October 2025 exceeded $265 billion, approaching a historical record high, of which USDT accounted for more than 70% and USDC about 20%, demonstrating the absolute dominance of the two US-based stablecoins in trading infrastructure and capital circulation.
At the on-chain level, the Stablecoin Supply Ratio (SSR) continues to decline to the -2.1 region, which corresponds to the lows of past major accumulations (2020 and 2023). As the SSR declines, it implies that the amount of stablecoins held on-chain is increasing relative to Bitcoin's market capitalization, which means that the potential purchasing power of stablecoins for risk assets is very high.
In addition, the net inflow of stablecoins into exchanges recorded +8 billion USD in Q3 2025, the highest level since Q2 2021. This data shows that investors are re-adding liquidity and preparing long positions, instead of withdrawing capital from the system as in the previous adjustment period. Specifically, the ratio of stablecoins circulating in exchange wallets to total market supply is currently only 7.4%, lower than the historical average of 9-10%, indicating that free-float stablecoins are being held for the long term and are less likely to be sold off, reinforcing the stability of the underlying cash flow.
USDT continues to dominate most spot and derivatives exchanges year-to-date, accounting for 73% of the total stablecoin volume used as a quote pair. Meanwhile, USDC has shown a strong recovery momentum after expanding its integration to layer 2 blockchains such as Base, Arbitrum, and Optimism, with trading volume increasing by more than 60% YTD. In contrast, decentralized stablecoins such as DAI or crvUSD are losing market share due to lack of liquidity support and increased pegging spreads during periods of high volatility.
In the current cycle, the correlation coefficient between stablecoin supply fluctuations and Bitcoin price is +0.86, much higher than the historical average of 0.62. This shows that Bitcoin is inseparable from the liquidity dynamics of stablecoins. When stablecoin supply increases, Bitcoin price tends to respond quickly, especially during SSR bottoming phases. Conversely, when stablecoins are net withdrawn from the system (e.g., Q4 2021 or Q2 2022), Bitcoin almost always enters a price recession.
Disclaimer: The information presented in this article is the author's personal opinion in the cryptocurrency field. It is not intended to be financial or investment advice. Any investment decision should be based on careful consideration of your personal portfolio and risk tolerance. The views expressed in this article do not represent the official position of the platform. We recommend that readers conduct their own research and consult with a professional before making any investment decisions.
API & Data: Glassnode
Compiled and analyzed by HCCVenture
Join HCCVenture here: https://linktr.ee/holdcoincventure
Explore HCCVenture group
HCCVenture © 2023. All rights reserved.


Connect with us
Popular content
Contact to us
E-mail : sp_contact@hccventure.com
Register : https://linktr.ee/holdcoincventure
Disclaimer: The information on this website is for informational purposes only and should not be considered investment advice. We are not responsible for any risks or losses arising from investment decisions based on the content here.

TERMS AND CONDITIONS • CUSTOMER PROTECTION POLICY
ANALYTICAL AND NEWS CONTENT IS COMPILED AND PROVIDED BY EXPERTS IN THE FIELD OF DIGITAL FINANCE AND BLOCKCHAIN BELONGING TO HCCVENTURE ORGANIZATION, INCLUDING OWNERSHIP OF THE CONTENT.
RESPONSIBLE FOR MANAGING ALL CONTENT AND ANALYSIS: HCCVENTURE FOUNDER - TRUONG MINH HUY
Read warnings about scams and phishing emails — REPORT A PROBLEM WITH OUR SITE.