


On-chain analysis week 44 / 2024: Big challenge in the network
Bitcoin spot price is on the rise, currently up to $69k, just 6.8% below its all-time high. This price increase has surpassed many important thresholds based on technical indicators and blockchain data. This is one of the first signals of positive price dynamics since late June.
10/24/202410 min read
Introduce
The spot price of Bitcoin has recently experienced a slight increase, surpassing $69,000 after successfully breaking through several technical values and important on-chain thresholds.
Analysis of on-chain data indicates that all age cohorts within the short-term holder group are currently showing unrealized profits, which could boost optimism in market sentiment.
In the futures market, speculation is on the rise, with open interest reaching an all-time high (ATH). These adjustments are attributed to increased transactions based on interest rate spreads and cash basis.
From a macroeconomic perspective, signs of growth are emerging globally, with GDPs of several countries showing modest increases. This could provide a favorable environment for risk assets like Bitcoin. Amid this conducive backdrop, many advisors may view Bitcoin as a store of value and a means to preserve capital.
Overall, the current market dynamics suggest a potential for continued upward momentum in Bitcoin's price, supported by strong investor sentiment and favorable economic conditions.
On-chain metrics

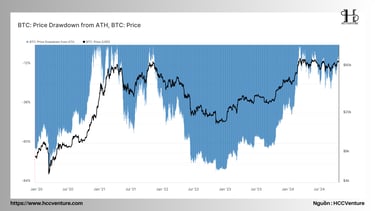
The recent price of Bitcoin has increased to $69,000, just 6.8% away from its all-time high (ATH) of $73,000 achieved in March. This rise has alleviated concerns among investors who have faced around seven months of unstable and volatile market conditions. Factors contributing to the recovery in Bitcoin's price may include growing interest from institutional investors and indications of a potential shift in monetary policy from major central banks, which could influence investor sentiment towards riskier assets like cryptocurrencies.
When considering the extent of the decline from the ATH over time, the current drop pattern resembles the growth cycle of 2021 more than the bear markets of 2019 and 2022. This similarity suggests a healthier market recovery phase. In 2021, similar conditions witnessed strong buying following price dips, supported by robust on-chain activity and increasing adoption rates.
According to data, Bitcoin's annual growth rate is now approximately 126% since the beginning of the year, indicating that this recovery is not merely temporary and could potentially usher in a new cycle for investors as macroeconomic conditions stabilize.
If these trends continue, they could help sustain Bitcoin's upward momentum and potentially pave the way for achieving new ATHs in the near future.
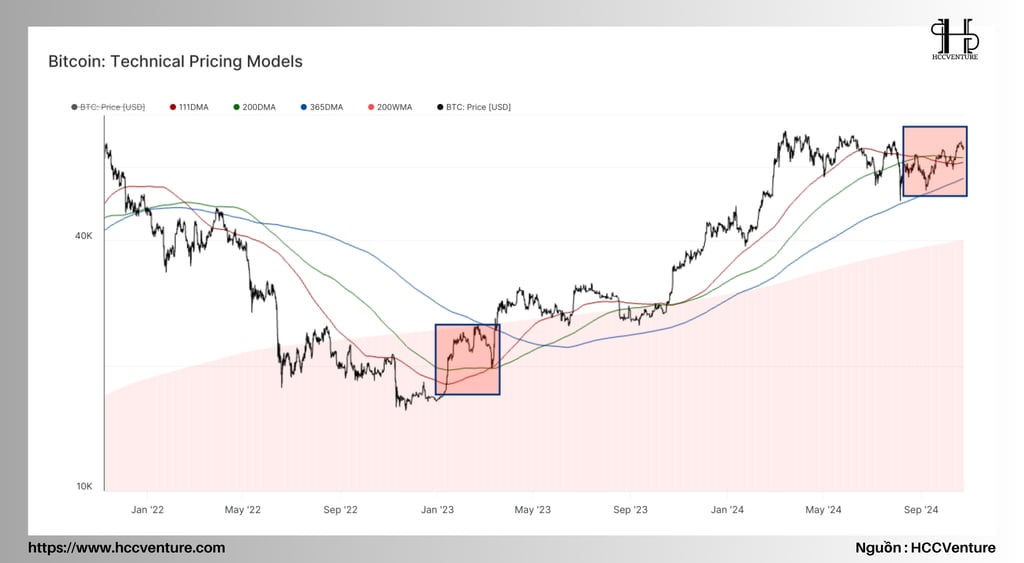
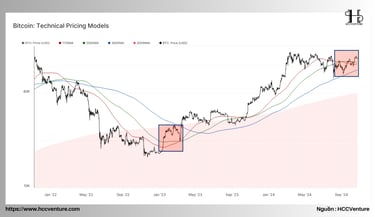
We can gain deeper insights into the market's recovery potential by comparing the spot price with key technical price levels. This recent price increase has allowed the market to surpass the combined resistance of the 200-day moving average (200DMA) and the 111-day moving average (111DMA), two indicators that Bitcoin investors often respond to.
Interestingly, the 365-day moving average (365DMA) has historically served as a solid support or resistance level during significant macro market transitions. Recently, on August 5, the 365DMA acted as strong support during the unwind phenomenon associated with yen-carry trades, and it has since defined the lower bound of the ongoing macro growth trend.
This situation indicates that if the market can maintain its value above these levels, particularly the 365DMA, it could create further stable upward momentum. Additionally, performance above these moving averages might attract added attention from investors and potentially increase trading volumes, marking a solid recovery after an extended accumulation phase. Sustaining above these moving averages would be a positive indicator for investors in the near future.
Overall, the interplay of these technical indicators reflects investor sentiment and market dynamics, emphasizing the importance of these price levels as the market navigates its recovery journey.
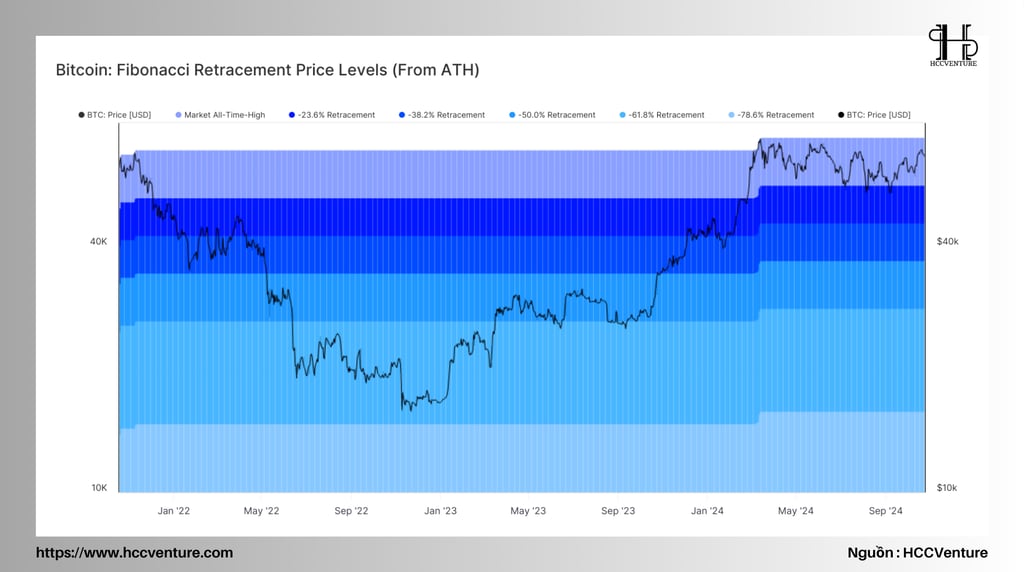
From the perspective of Fibonacci retracement levels, the spot price of Bitcoin has primarily oscillated between the all-time high (ATH) and the -23.6% region, establishing a common lower boundary throughout this sideways price action phase.
Bitcoin maintaining its trading within these limits for several months is rare, highlighting the uniqueness of this period of sideways movement and high volatility. Typically, the Bitcoin market would either rally to new peaks or undergo more severe sell-offs, which adds to the intrigue of the recent stable growth phase.
Fibonacci retracement levels, particularly the -23.6% level, are often closely monitored by investors as they can act as significant support levels. This leads many traders to seek buy signals as the price approaches these levels, thereby contributing to stability and price consolidation during the accumulation phase.
Furthermore, in this context, it can be inferred that this sideways phase is not merely a temporary phenomenon but also reflects a thorough evaluation by investors of the market dynamics. This indicates a level of determination and a desire to seek long-term investment opportunities in a market characterized by deep volatility. If the price can break out of these boundaries, the likelihood of reaffirming previous trends or reaching new highs becomes very feasible.
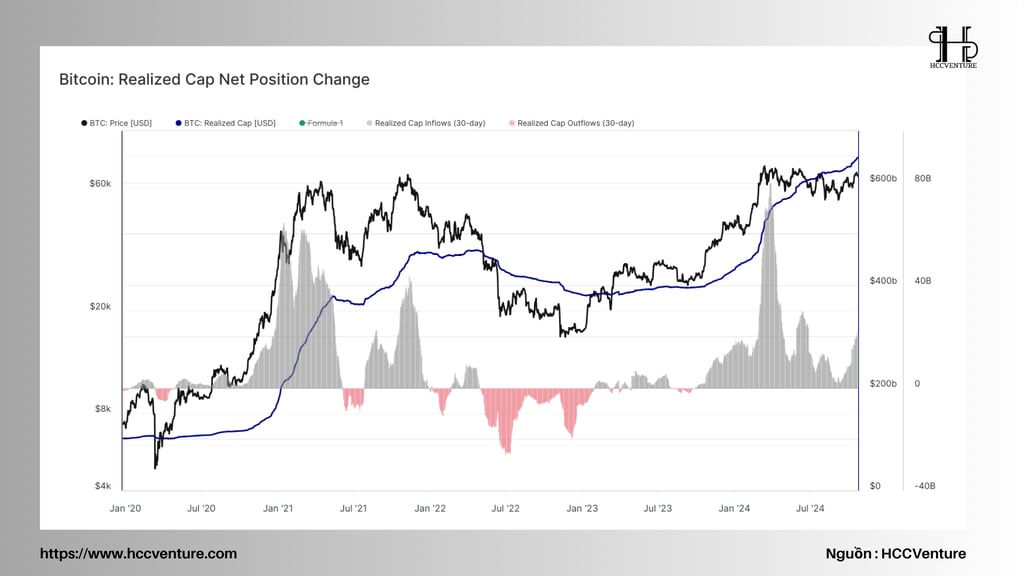
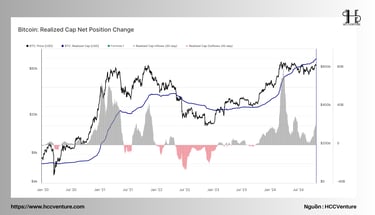
The net inflows into Bitcoin assets have accelerated significantly, recording an increase of $21.8 billion (equivalent to 3.3%) over the past 30 days. This surge has led to the Realized Cap reaching a new all-time high of over $646 billion.
This increase indicates a growing trend in liquidity within this asset class, and these substantial capital inflows are supporting the price increase. High liquidity not only contributes to greater market stability but also reflects investor confidence in engaging with the cryptocurrency space.
Moreover, with the Realized Cap hitting new highs, this encourages more investors to view Bitcoin as a solid investment asset, particularly amidst global economic uncertainties. The support from these inflows plays a critical role in affirming the upward price trend, especially during periods of significant market volatility. If this trend persists, we can expect Bitcoin's price to maintain a stable upward momentum and open up new opportunities for investors in the near future.
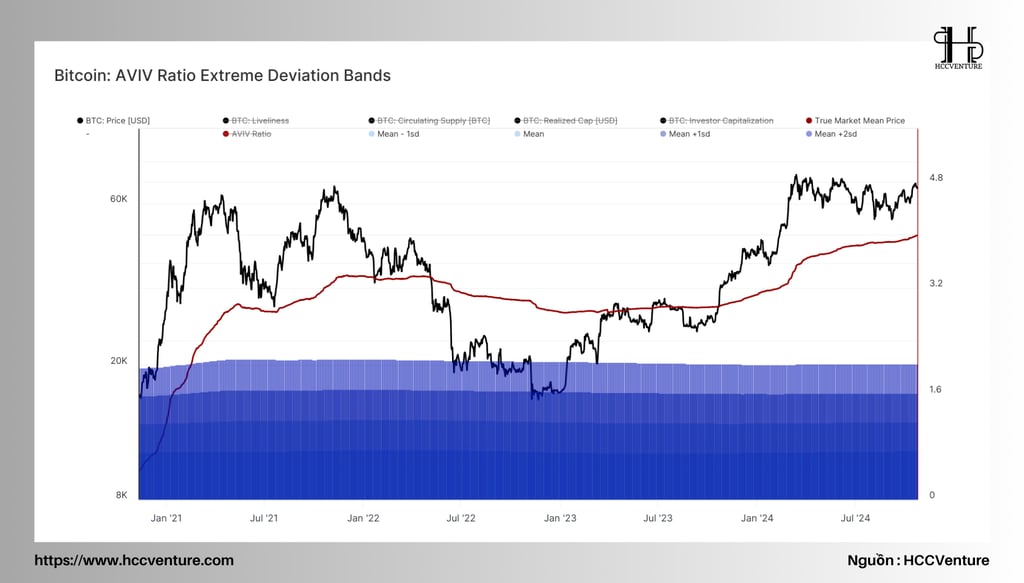
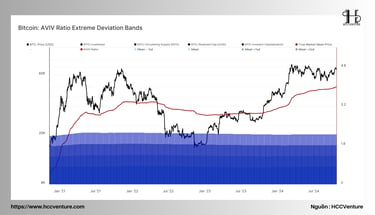
The AVIV Ratio is a fundamental metric in the on-chain analyst toolkit, assessing the scale of unrealized gains/losses held by investors (by excluding inactive entities such as lost or long-dormant supply).
This year, the AVIV Ratio has traded above its historical average and has shown a strong rebound from this average following the unwind of yen-carry trades on August 5. Overall, this is a positive sign, indicating that investor profitability remains relatively robust and that active investors have protected their break-even points in recent months.
Additionally, it is noteworthy that the AVIV Ratio has not breached the +1 standard deviation level since the peak in March, underscoring the growth potential if positive price momentum is established.
The stability of the AVIV Ratio in this context not only suggests that investors may still be in a profitable position but also indicates their tendency to hold firm throughout price fluctuations, thus driving demand and potentially triggering the next upward price trend for Bitcoin. If the price can establish upward momentum and surpass higher averages, it could present opportunities for even greater increases in the future.
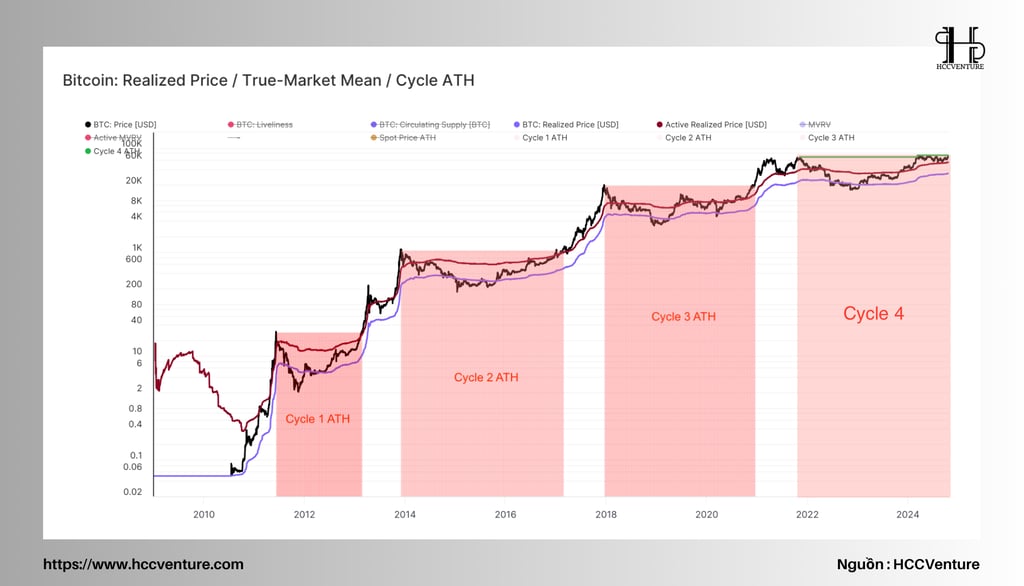
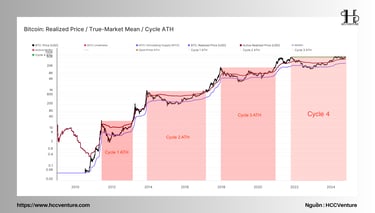
We can use key on-chain price levels to construct a framework for understanding Bitcoin market cycles. This analytical framework can be categorized into the following stages:
Cycle 1 (Enthusiastic Bull Market): The price trades between the All-Time High (ATH) and the True Market Mean.
Cycle 2 (Deep Bear Market): The price trades below the Realized Price.
Cycle 3 (Early Bull Market): The price trades between the Realized Price and the True Market Mean.
Cycle 4 (Euphoric Bull Market): The price trades above the ATH of previous cycles.
Currently, Bitcoin is attempting to transition from the Enthusiastic Bull Market phase to the Euphoric Bull Market phase, which is characterized by a sustained breakout above the 2021 ATH of $69,000.
While this price point was temporarily breached during the peak in March 2024, strong profit-taking at that time forced the market to undergo a "cool-off" period to soothe investor emotions.
If Bitcoin can maintain its price above $69,000 and establish robust upward momentum, the market is likely to easily enter the Euphoric phase, where demand and interest from investors will significantly increase. Any signs of a return of confidence from investors could further reinforce this trend and open up opportunities for new peaks in asset value development in the future.
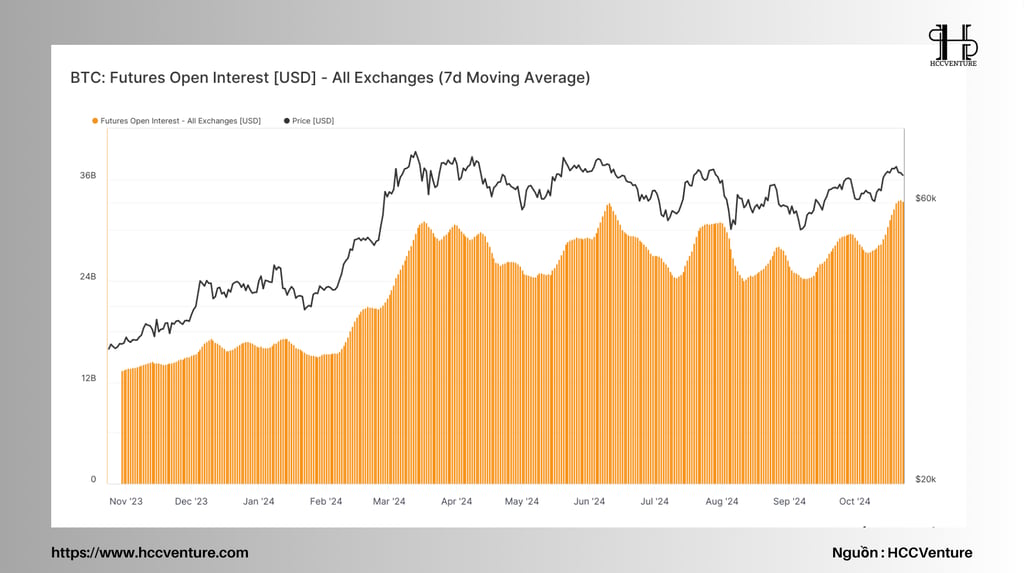
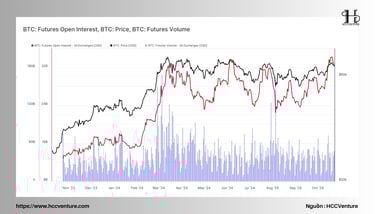
The Bitcoin derivatives market has witnessed robust growth since the first perpetual swap instruments were introduced in 2016. These derivative markets have provided significant depth and liquidity to this asset class, allowing for increasingly sophisticated trading and hedging strategies to be implemented.
Currently, open interest in both perpetual futures and fixed-term futures contracts has reached a new all-time high of $32.9 billion this week, indicating a notable increase in total leverage entering the system.
This high level of open interest not only signifies strong interest and participation from investors but also reflects a vibrant trading environment in the market. As open interest rises, it generally suggests that many investors are betting on future price fluctuations, which could lead to further increases in Bitcoin’s price volatility.
The development of the derivatives market also creates more opportunities for traders looking to optimize profit and mitigate risk through complex strategies such as hedging or arbitrage. These factors contribute to reshaping how Bitcoin and other cryptocurrencies are traded, reinforcing the increasingly critical role of the derivatives market within the cryptocurrency ecosystem. If this trend continues, it is likely to further bolster stability and liquidity in the Bitcoin market moving forward.
While perpetual swaps are favored among cryptocurrency enthusiasts, traditional fixed-term futures contracts at CME Group play a crucial role in driving the increase in open interest.
This product has provided a new wave of institutional investors with a regulated tool to engage in derivatives, opening up opportunities to profit through cash-and-carry strategies. Open interest in CME contracts has surged to a new all-time high of $11.3 billion, indicating heightened activity from institutions in the digital asset space.
This increase in open interest not only reflects institutional investor interest in Bitcoin but also signifies a positive trend in the adoption of complex trading strategies. CME futures contracts offer a reliable, regulated environment, which instills confidence in investors participating in the market.
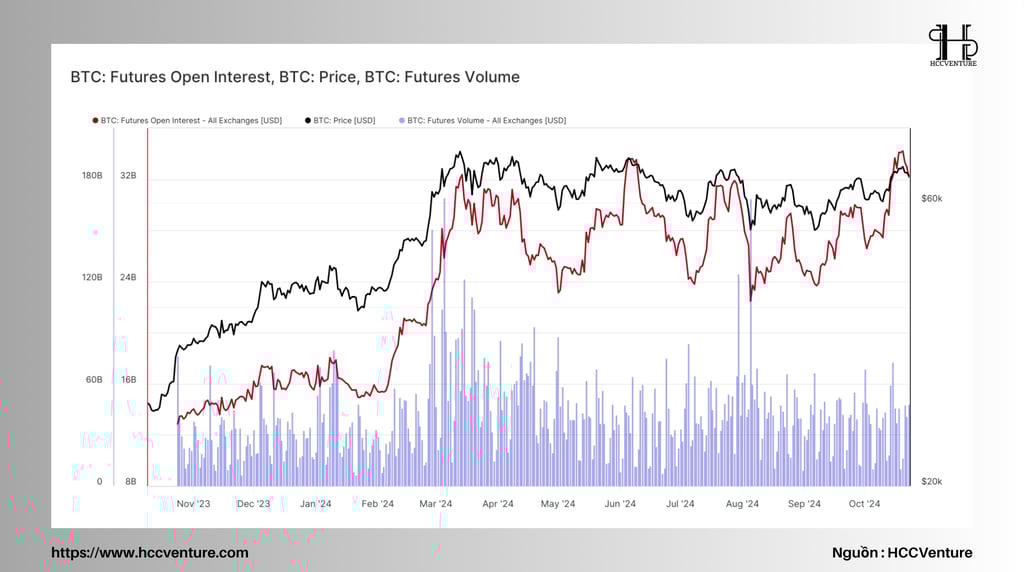
However, the trading volume across all futures contracts, averaging $35 billion per day, has seen a slight decline, particularly compared to the heightened volumes when the market reached its ATH in March. This suggests that there isn't significant momentum in trading activity at present, possibly indicating a higher dominance of single trade basis strategies and arbitrage positions within the futures market.
Furthermore, the cash-and-carry strategy enables institutions to profit from the spread between futures prices and spot prices, creating additional income streams while enhancing liquidity and stability for the entire cryptocurrency ecosystem. If this trend continues, it could further develop the derivatives market and attract more institutional investors into the space in the future.
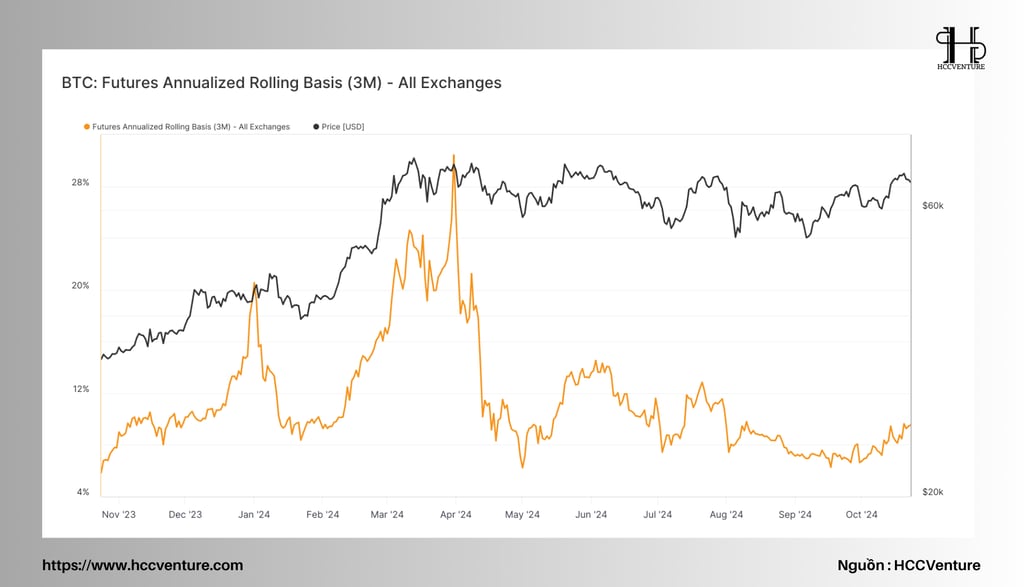
The yield from Cash-and-Carry strategies is currently around 9.6%, nearly double the "risk-free" rate from short-term U.S. Treasury bonds. With the Fed expected to implement further interest rate cuts in the coming months, this spread trading opportunity is likely to continue attracting institutional traders, thereby expanding liquidity in the Bitcoin market.
The appeal of this higher yield compared to Treasury bonds will drive many investors to seek better profit opportunities. The Cash-and-Carry strategy allows institutions to capitalize on the price differentials between futures markets and the spot price of Bitcoin, enabling them to develop more effective trading strategies and optimize profitability.
As more institutional investors engage in these strategies, it not only enhances liquidity for Bitcoin but also strengthens its position within diversified investment portfolios. If interest in such arbitrage transactions continues to grow, we can anticipate a more vibrant market and an increased connection to traditional financial processes, contributing to the sustainable development of the cryptocurrency space in the future.
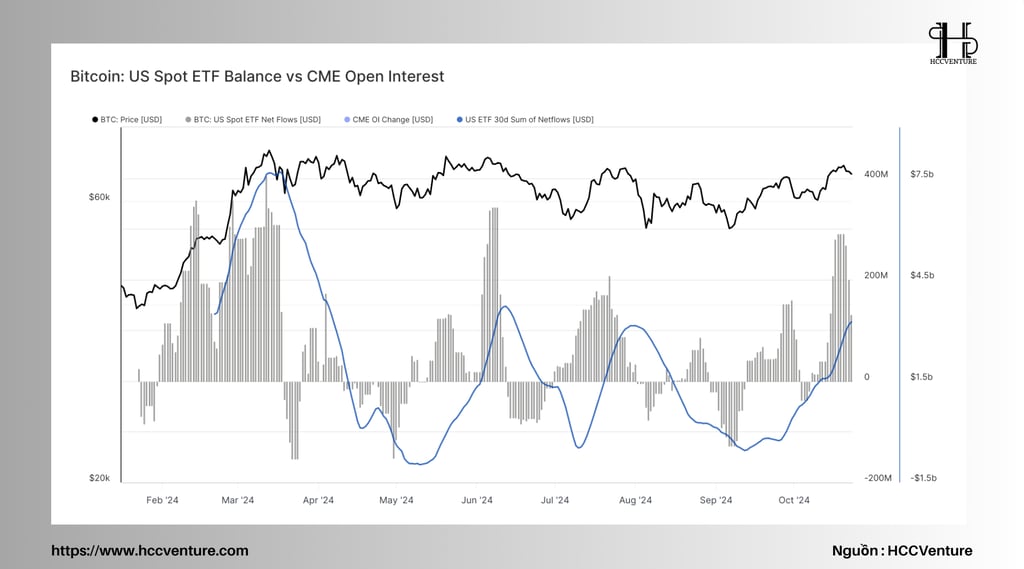
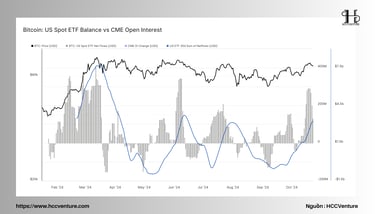
By comparing the total net inflows of Bitcoin ETFs over a 30-day period with the changes in open interest on the CME during the same timeframe, we can find further evidence of an increase in Cash-and-Carry trading.
Notably, we observe a similar scale correlation between these two metrics, indicating a connection between long positions through Bitcoin ETFs and short positions via CME futures contracts aimed at capitalizing on price discrepancies. This relationship suggests that as inflows into ETFs increase, open interest in futures contracts on the CME also rises, indicating that investors are using ETFs to hold Bitcoin while simultaneously leveraging futures contracts to exploit yield.
This alignment not only reinforces the theory of the Cash-and-Carry strategy but also demonstrates that investors are increasingly employing sophisticated trading methods to optimize profits. If this trend continues, it could positively impact liquidity and depth in the Bitcoin market, attracting even more investors to the digital asset space.
Conclusion and Assessment
From the analysis, it is evident that the Bitcoin market is currently in a strong recovery phase, driven by several positive factors. The spot price has risen above $69,000, nearing the historical peak of $73,000, just 6.8% away. This recovery has allowed many investors to return to an unrealized profit position, boosting market optimism after a prolonged period of accumulation and volatility.
Over the past 30 days, net inflows into Bitcoin have recorded an increase of $21.8 billion, equating to 3.3%, resulting in a Realized Cap increase to $646 billion. Furthermore, open interest in futures contracts has reached a new all-time high of $32.9 billion, while open interest at CME Group recorded $11.3 billion, indicating growing participation from institutional investors and an enhancement of trading strategies such as Cash-and-Carry.
This increase not only provides the Bitcoin market with a stable source of liquidity but also opens up numerous new trading opportunities. The yield from Cash-and-Carry strategies, approximately 9.6%, has attracted investor interest, especially in light of potential future interest rate cuts from the Fed. This reveals a strong link between long positions via Bitcoin ETFs and short positions through CME futures, facilitating the development of a richer and more efficient trading environment.
In conclusion, the combination of positive price momentum, increasing open interest, and institutional investor interest has created a bright outlook for the Bitcoin market moving forward. These factors not only bolster investor confidence but also present the potential for stable growth, forecasting a new development phase for cryptocurrencies amidst the evolving landscape of global financial markets.
Join the HCCVenture community to get the latest market information. Once again, we give our opinion on potential projects in the crypto market. This is not investment advice, consider your portfolio. Disclaimer: The views expressed in this article are solely those of the author and do not represent the platform in any way. This article is not intended to be a guide to making investment decisions.
API & Data : Glassnode
Compiled and analyzed by HCCVenture
Join our telegram community: HCCVenture
Explore HCCVenture group
HCCVenture © 2023. All rights reserved.


Connect with us
Popular content
Contact to us
E-mail : sp_contact@hccventure.com
Register : https://linktr.ee/holdcoincventure
Disclaimer: The information on this website is for informational purposes only and should not be considered investment advice. We are not responsible for any risks or losses arising from investment decisions based on the content here.
TERMS AND CONDITIONS • CUSTOMER PROTECTION POLICY
ANALYTICAL AND NEWS CONTENT IS COMPILED AND PROVIDED BY EXPERTS IN THE FIELD OF DIGITAL FINANCE AND BLOCKCHAIN BELONGING TO HCCVENTURE ORGANIZATION, INCLUDING OWNERSHIP OF THE CONTENT.
RESPONSIBLE FOR MANAGING ALL CONTENT AND ANALYSIS: HCCVENTURE FOUNDER - TRUONG MINH HUY
Read warnings about scams and phishing emails — REPORT A PROBLEM WITH OUR SITE.