


On-chain analysis week 43/2025: Bitcoin cycle history
As the cryptocurrency market enters a technical correction after a strong bull run in early 2025, Bitcoin continues to play a central role in global capital flows.
10/26/202510 min read
Summary of the situation
On-chain data for October 2025 shows that Bitcoin's growth momentum is slowing down , after the price fell below the short-term investor holding cost (STH Cost Basis) threshold of around $113,000 . At the same time, the 1-month Realized Volatility indicator dropped sharply to 35% , below the historical average, indicating that the market is in a volatility compression phase - a stage that usually occurs before forming a new price phase.
The Supply Quantiles Cost Basis Model indicates that Bitcoin is hovering below the 0.85 percentile (~$108,600) – a key level that acted as support during the 2021–2022 cycle. Failure to hold this zone would increase the probability of a technical correction to the 0.75 percentile (~$97,500) , which would correspond to a reabsorption cycle of old capital flows from long-term investors.
Bull Market Correction Drawdowns show that the current corrections (-23% to -25%) are still significantly milder than the average -38% to -50% of previous bull cycles. On the other hand, the Realized Capital to Valuation Change Ratio (RCVCR) , 90-day value is currently at ~0.8–0.85 , above the 0.75 threshold – the “hot” area for capital flows.
Analyzing on-chain metrics
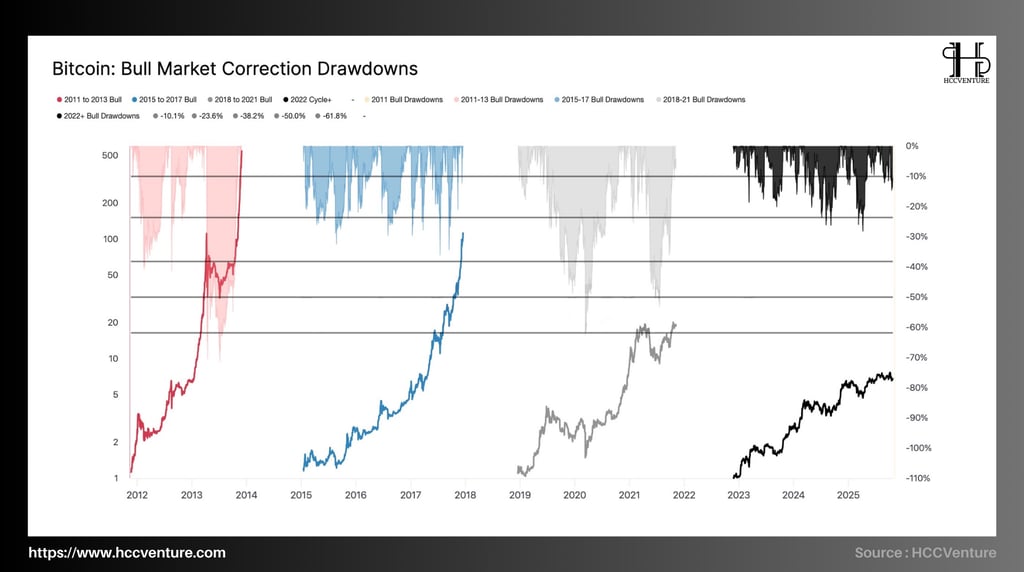
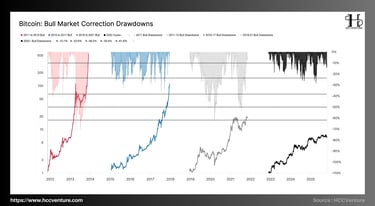
Bull Market Correction Drawdowns measures the degree of price correction (in %) of Bitcoin in each bull cycle since 2011. Bitcoin's history shows that every bull cycle has had corrections averaging between 25% and 60% , which act as a “natural cleansing mechanism” to absorb leverage and strengthen the foundation for the next bull run.
The 2011-2013 cycle was the first phase of Bitcoin when capitalization was low and price fluctuations were huge.
Average correction: -50% to -70% , sometimes touching -93% in short-term speculative crashes.
However, after each deep fall, prices recovered strongly, reflecting the formation of a "young but explosive growth market".
This structure later became the template for the following cycles.
The 2015–2017 cycle , the first mature cycle, was marked by the increase in retail institutional capital and the emergence of derivatives exchanges.
Common adjustment levels: -30% to -40% , average -38.2% .
The market recorded many short declines but recovered quickly, showing high confidence from long-term capital flows.
The late 2017 correction was -39%, paving the way for the historic peak of $20,000.
2018-2021 cycle , the first cycle Bitcoin is widely traded in traditional financial markets, with the birth of CME futures contracts.
The average adjustment increased slightly, ranging from -35% to -55% , peaking at -50% in March 2020.
This regulatory structure reveals the “macro” nature of Bitcoin: the price is affected by global liquidity fluctuations rather than just internal factors.
The 2022-present cycle , which started after the 2022 crash (-77%) due to liquidity crunch and macro events (FTX, Fed rates, etc.), is showing a new correction pattern – less deep but more prolonged .
Average correction: -10.1% to -23.6% , deepest -38.2%, from 2022 bottom to present.
Compared with the 2015–2017 cycle, the adjustment range decreased by 30–40% , reflecting more stable institutional capital flows and higher leverage control in the derivatives market.
With the correction amplitude decreasing over each cycle, the data shows that Bitcoin is entering a phase of capital structure stabilization – where short-term crashes are no longer “system-destroying” but are simply a re-evaluation phase in the long-term uptrend . The current correction is just a natural consolidation phase of the uptrend , similar to the periods between 2016 and mid-2020.
If the historical pattern continues to repeat, the 2022–2026 cycle is likely to maintain a more sustainable upward trajectory, with a gradually decreasing correction amplitude but a longer duration , reflecting market maturity and the dominance of institutional capital flows.
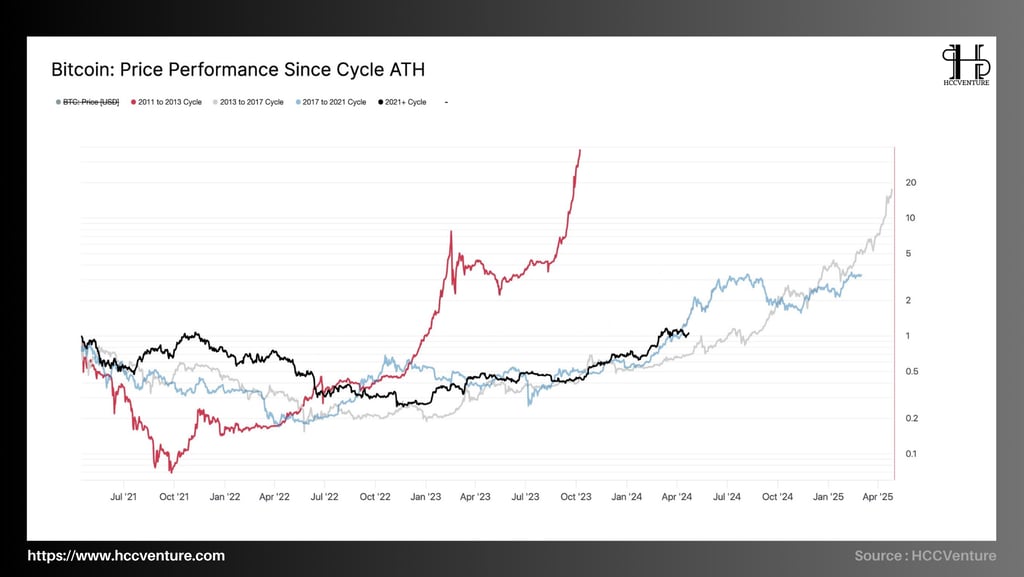
Price Performance Since Cycle ATH measures Bitcoin's price performance since the previous cycle peak (All-Time High – ATH) to determine the speed of recovery, growth amplitude, and sustainability of the current cycle compared to historical periods.
Historically, each Bitcoin bull cycle has shown a logarithmic recovery trajectory , with the recovery from the previous peak typically lasting 12–24 months , and the average cumulative growth being 6–20x from the cycle bottom. The chart clearly shows the difference between the four major cycles:
2011–2013 : Explosive growth, nonlinear performance, 20x peak.
2013–2017 : Steady growth, expanding user network and capitalization.
2017–2021 : Financial integration, but volatile due to leverage.
2021 - present: The current cycle, which represents slower but more stable growth , reflects the market's greater maturity and capital efficiency.
Bitcoin is currently trading around $111,000 , which is 3.2 times higher than the 2022 cycle bottom ($17,500). The average growth rate in 2025 is +85% YTD , lower than the 2017 peak of the same period (around +210%) but higher than 2019 (+60%). The current cycle (2021+) has entered its 46th month since the previous cycle peak (2021) , which means it is deep into the mid-expansion phase – a period that historically sees the distribution of profits for long-term investors.
After the strong correction in 2022 (-77%), Bitcoin began a steady recovery period with an amplitude of 8-12%/month , no longer showing vertical increases like in 2017. This demonstrates the sustainability of long-term investment demand , when cash flow does not come from personal FOMO but mainly from strategic accumulation of organizations.
The current price recovery ratio is 0.82 (i.e., the price is now 82% higher than the 2021 peak). Compared to the same point in the 2017–2021 cycle, this index is at the same level as September 2020 , suggesting that there is still significant room for growth if the historical trend repeats itself. If the logarithmic pattern of previous cycles holds, the target price of the current expansion phase could reach the $160,000–$180,000 range before entering the next major correction cycle.
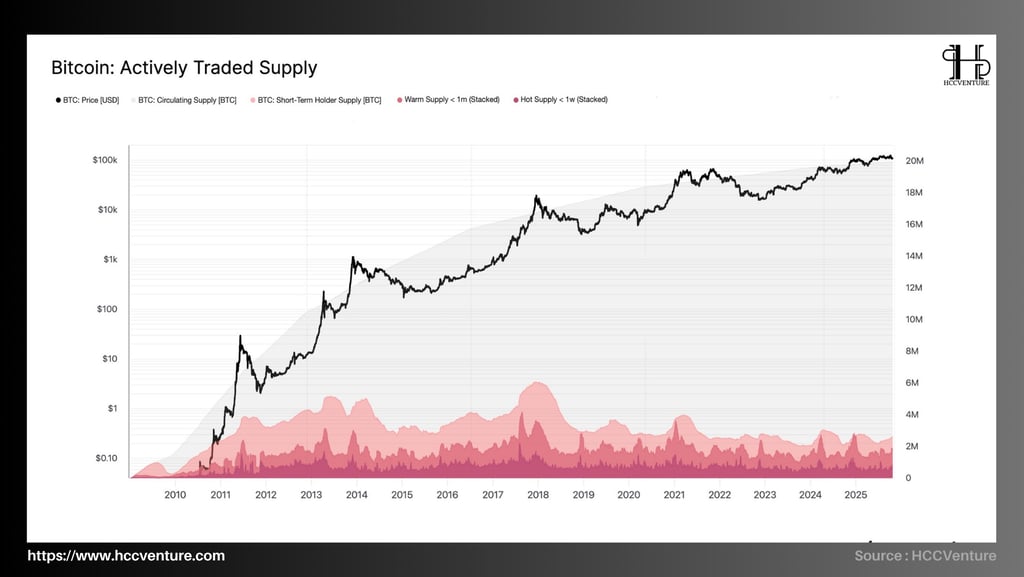

Actively Traded Supply measures the volume of Bitcoins actually traded on-chain over a short period of time (less than 1 month, less than 1 week). It is an important metric that reflects the circulation level, liquidity, and intensity of short-term investor activity in the Bitcoin ecosystem.
Current data shows that, as of the end of October 2025 , the actively traded Bitcoin supply remains at a historic low of just 1.87 million BTC (<9.5% of total circulating supply) – a low comparable to the period between mid-2016 and late 2020, two periods immediately preceding strong growth cycles.
Bitcoin held for less than 155 days (STH) is currently at 2.96 million BTC , down more than 25% from its March 2024 peak (approximately 3.9 million BTC). The continued decline in STH Supply suggests that the market is entering a sustained accumulation phase , as most short-term investors have either exited the market or switched to long-term holdings.
Warm Supply (<1 month) : Currently hovering around 1.45 million BTC , equivalent to 6.8% of total circulating supply . Compared to the 2021 peak (~4.2 million BTC), this number has decreased by more than 65% , showing that short-term trading activities have narrowed significantly .
Hot Supply (<1 week) : Currently there are only about 0.48 million BTC left , equivalent to 2.3% of total supply , which is the lowest level since early 2013 .
The contraction of “Hot Supply” not only reflects the cautious sentiment after the August-September 2025 volatility, but also shows that the immediate selling pressure in the market has almost dried up . Bitcoin is in a natural state of “liquidity tightening” — when the majority of the supply is sitting in long-term wallets and is less inclined to sell.
Historically, periods where active supply has bottomed out below 10% have coincided with accumulation cycles at the end of corrections . The big difference in the current cycle is that the ownership structure has shifted heavily towards institutions and ETFs , causing free on-chain liquidity to decline more rapidly, while the concentration of supply in large custodial wallets has increased sharply.
From a quantitative perspective, Bitcoin’s current supply structure fits a post-halving re-accumulation model , where prices typically enter a 3–6 month plateau before launching an expansion cycle. If history continues to repeat itself, the current low activity levels will set the stage for the next growth phase in the second half of 2026 , when new liquidity begins to return and locked-up supply becomes a price driver.
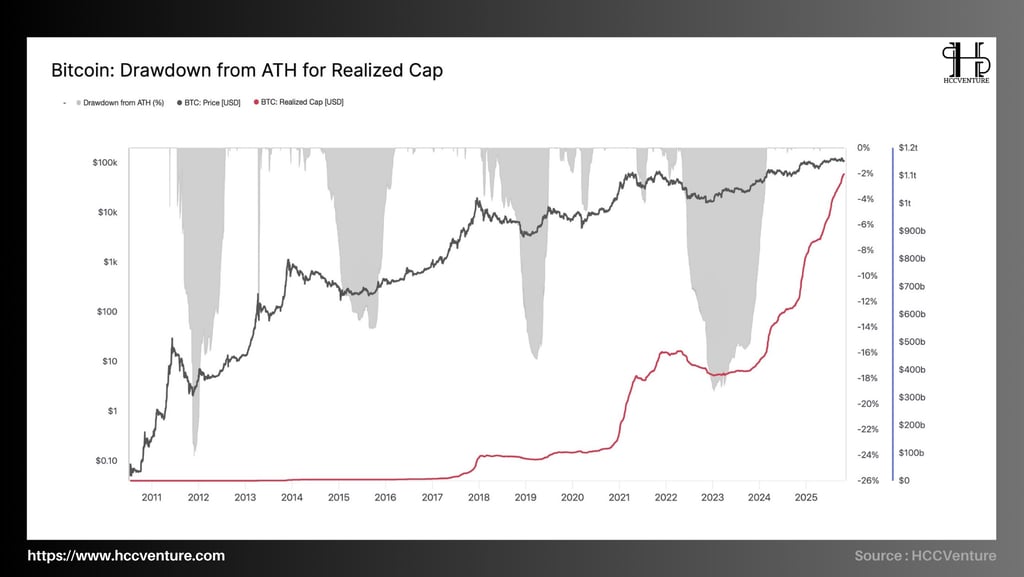
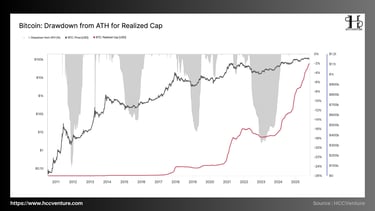
The Drawdown from ATH for Realized Cap is holding near 0% after the recent spot correction, while the Realized Cap continues to hold at a new peak of approximately $1.15–1.20 trillion . This structure confirms:
(i) Net network inflow remains positive.
(ii) Most coins are being revalued at a higher cost level.
(iii) The recent correction did not break the fundamentals .
Realized Cap is in the ~1.15–1.20 trillion USD area , drawdown around −1% to −3% after the drop below the $117k–$114k cost cluster. Meaning only a very shallow decline from the recent peak of realized capitalization. Realized Cap rising to a new high means the average cost of the network continues to be pushed higher . Each coin that changes hands recently has a higher entry cost, thickening the support base.
When the spot price retreats sharply while the Realized Cap drawdown shrinks to only a few percent, the typical structure is “reset leverage – not capital flight” . The difference with 2021–2022 lies in the absence of a series of days of sharp Realized Cap declines (a sign of forced distribution).
Realized Cap peak – shallow drawdown confirms that the underlying money is still firmly anchored in the network . The recent spot price decline is only a rebalancing of leverage and psychology , not a cyclical withdrawal phase. When ETF/spot returns to stable net inflows, there is a high probability that the market will continue its uptrend on the basis of increased costs and low systemic risk .

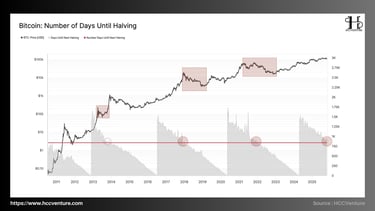
Bitcoin’s Halving event has always been at the heart of every market cycle, acting as a trigger mechanism for the next bull cycle. The Number of Days Until Halving shows a clear historical correlation between the number of days until Halving and price behavior, with periods of sharp declines in days (especially around 700–800 days) often being accompanied by deep price corrections before a new bull cycle begins.
We are currently in the mid-term of the 2024–2028 Halving cycle, with Bitcoin trading around $110,000–115,000 and about 720 days until the next Halving, reflecting a similar market structure to the 2017 and 2020 periods.
In previous cycles, when the number of days to Halving falls below 1,000, the market usually enters a mid-term repricing phase.
2013–2016 Cycle : Bitcoin dropped ~75% after the first peak, then accumulated around 600–700 days before Halving.
2017–2020 Cycle : Mid-term correction of -60% formed 720 days before Halving.
2020–2024 Cycle : Deep correction from $69,000 to $15,500 occurs in the same 750-day range, before the market reverses sharply.
Current data suggests a similar cycle is repeating itself, with an estimated lag of around 680–750 days before the supply reduction actually impacts the demand structure. This coincidence reinforces the hypothesis that Bitcoin still follows a periodic cycle of supply scarcity, maintained by the Halving mechanism.
When we put the three most recent cycles (2013, 2017, 2021) on the same time scale, we can see that Bitcoin typically reaches a local peak around 550–750 days after the Halving . The current cycle is still within that timeframe, implying that the market is in the middle of an expansion phase rather than a distribution phase. The +690% gain since the 2022 bottom is lower than the +980% gain in the 2017 cycle at the same point, suggesting that there is still significant room for growth in the long term.
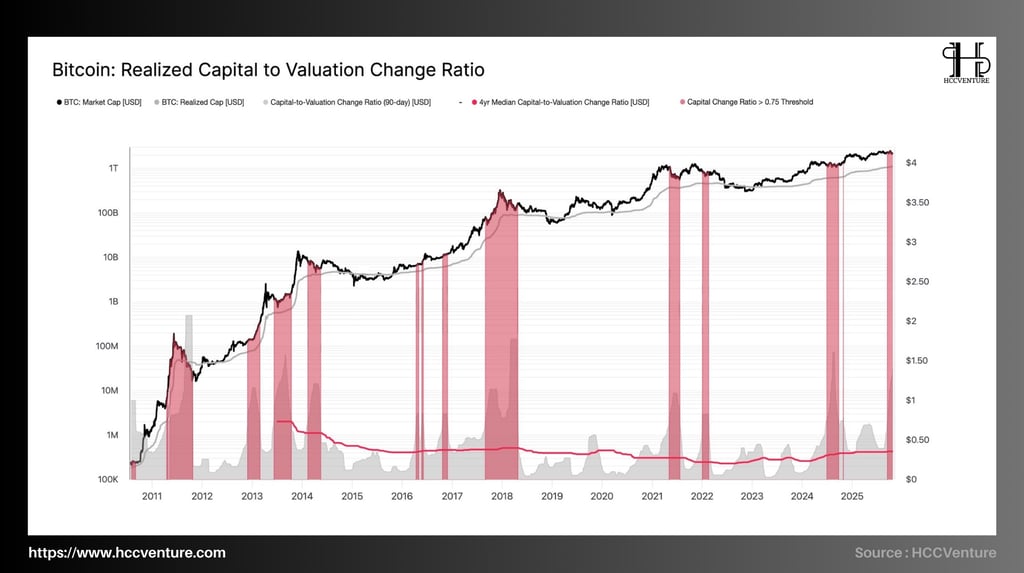

RCVCR (90-day version) is currently above the warning threshold of 0.75, around ~0.8–0.85 , indicating that the increase/decrease in market capitalization is being “fed” by new capital flows with a higher intensity than the long-term equilibrium.
Historically, value clusters >0.75 have always been associated with the acceleration-cooling phase of the cycle; when rising too long above this threshold, the market often needs a -10% to -25% rebalancing to absorb the existing profits before continuing the trend. At present, the capital structure is strong but hot , favoring the scenario of recompression/technical adjustment over the cycle reversal.
When RCVCR is in the 0.8–0.85 region, the proportion of unrealized profits in the system is high; as soon as marginal demand weakens (ETF/spot stagnates), profit realization pressure can trigger a technical correction .
High “hot” capital intensity makes short-term fluctuations sensitive to funding/ELR . With leverage having been washed out recently, the systemic risk base is low, so the corrections from the high RCVCR zone tend to be more orderly than the 2021 periods.
RCVCR is in a “hot but healthy” state, real capital flows are still supporting valuations, but the sensitivity to profit taking has increased. The basic scenario for the medium term is a limited technical re-compression/adjustment , aiming to cool the indicator to the 0.5-0.6 range without breaking the major trend .
Evaluation and Conclusion
Comparing the price performance since the cycle peak (Price Performance Since Cycle ATH), Bitcoin in 2025 is following the 2017 model but with a phase shift of about 4-6 months . The recovery from the cycle bottom is about +370% , lower than the +520% of 2017 at the same stage, showing that the current cycle is growing slower and more steadily , clearly reflecting the maturity of the market.
The Realized Capital to Valuation Change Ratio (RCVCR) – which measures the rate of change in real capital relative to valuation – is currently in the 0.8–0.85 range , which is consistent with past distribution peaks. This reflects increased short-term profit-taking pressure , but has not yet generated a structural reversal signal.
According to Number of Days Until Next Halving , the market is currently in the second half of the 2024 post-halving cycle , with about 750 days remaining until the next Halving (2028).
In the previous three cycles, this middle phase has always been the time when Bitcoin enters a re-accumulation phase – rebalancing supply and demand , before expanding strongly in the next 12–18 months.
The current price structure, with shallow corrections and low volatility, is completely similar to the 2016–2017 and 2020–2021 cycles.
From an academic perspective, the current cycle is repeating the slow-steady-sustained expansion pattern , similar to the 2016–2018 model but with lower volatility and a longer duration . Therefore, Bitcoin is likely in the mid-expansion phase – where the market rebalances in preparation for the final rally towards the $130,000–$150,000 price range in 2026 .
Disclaimer: The information presented in this article is the author's personal opinion in the cryptocurrency field. It is not intended to be financial or investment advice. Any investment decision should be based on careful consideration of your personal portfolio and risk tolerance. The views expressed in this article do not represent the official position of the platform. We recommend that readers conduct their own research and consult with a professional before making any investment decisions.
API & Data: Glassnode
Compiled and analyzed by HCCVenture
Join HCCVenture here: https://linktr.ee/holdcoincventure
Explore HCCVenture group
HCCVenture © 2023. All rights reserved.


Connect with us
Popular content
Contact to us
E-mail : sp_contact@hccventure.com
Register : https://linktr.ee/holdcoincventure
Disclaimer: The information on this website is for informational purposes only and should not be considered investment advice. We are not responsible for any risks or losses arising from investment decisions based on the content here.

TERMS AND CONDITIONS • CUSTOMER PROTECTION POLICY
ANALYTICAL AND NEWS CONTENT IS COMPILED AND PROVIDED BY EXPERTS IN THE FIELD OF DIGITAL FINANCE AND BLOCKCHAIN BELONGING TO HCCVENTURE ORGANIZATION, INCLUDING OWNERSHIP OF THE CONTENT.
RESPONSIBLE FOR MANAGING ALL CONTENT AND ANALYSIS: HCCVENTURE FOUNDER - TRUONG MINH HUY
Read warnings about scams and phishing emails — REPORT A PROBLEM WITH OUR SITE.