On-chain analysis week 43, 2024: ATH is approaching
The trading volume, reflected through the disparity between supply and demand, is forming a relatively high deviation as the market has oscillated within a narrow range for over six months. Observations from both the blockchain market and the futures market, coupled with the fact that a large majority of investors are holding long-term positions, indicate that the current environment suggests the potential for significant volatility in the near future.
10/17/20249 min read
Summary
Since the all-time high (ATH) in March, market demand has significantly waned, with investor interest gradually declining as prices continue to fluctuate within a narrow range. This reflects a growing impatience among many short-term investors, who have not witnessed any significant growth.
On the supply side, the available coin supply in the market is also contracting, as many indicators of "active supply" have dropped to relatively low levels. This suggests that the actual traded and circulating coin supply is decreasing, potentially due to investors continuing to accumulate rather than sell.
Historically, when Bitcoin's supply tightens as it is now, it often signals the onset of a period of heightened volatility. The characteristic of this situation is a temporary balance between the coins held by new investors and those who have been HODLing for an extended period.
However, this state of equilibrium typically does not last long, and with any shocks to supply or demand, the market is likely to experience significant price fluctuations. The tightening of supply, combined with declining demand, may create a volatile environment in the near future as the market seeks a new stable price level.
On-chain metrics

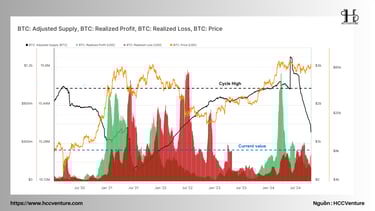
Since the all-time high of $73,000 in March 2024, the influx of new capital into the Bitcoin market has continued to decline significantly. As the Bitcoin network operates on a peer-to-peer trading principle, buyers and sellers are connected on a 1:1 basis. Therefore, using metrics such as Realized Profit and Realized Loss can provide insights into the scale of new capital flowing into and out of the network.
Based on these indicators, it is observed that the current market is seeing approximately $0.73 billion in new capital entering daily. While this figure is not insignificant, it represents a substantial decline compared to the peak of $2.97 billion reached in March.
Further analysis indicates that the weakening capital flow may reflect a cautious investor sentiment, as price volatility has lost its previous luster. This could signal a state of "redistribution," whereby long-term investors maintain their positions while new capital from short-term investors diminishes. This scenario has the potential to create downward pressure on prices or, at the very least, slow the market's growth unless a new catalyst emerges to attract larger capital inflows back into the network.

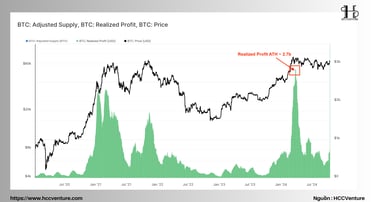
On October 8th, a notable spike in the Realized Profit index appeared in the unadjusted raw data variant of this metric. However, when considering the Entity-Adjusted variant developed by Glassnode, this spike did not manifest.
The reason for this increase in profit was a large internal transaction from the WBTC cluster, as BitGo executed an ownership transfer on-chain. Thanks to Glassnode's proprietary clustering algorithms, this non-economic transaction was identified and excluded from the cleaned dataset. This clearly illustrates the benefit of filtering on-chain transaction data in an entity-adjusted manner, helping to remove artificial fluctuations and better reflect actual network activity.
Utilizing the Entity-Adjusted filter is significant for providing a more accurate view of cash flows and genuine trading behavior while helping analysts and investors avoid potential distortions caused by large internal transactions, such as the WBTC movement. This distinction is crucial for understanding the market’s true dynamics and ensuring sound decision-making based on reliable data.
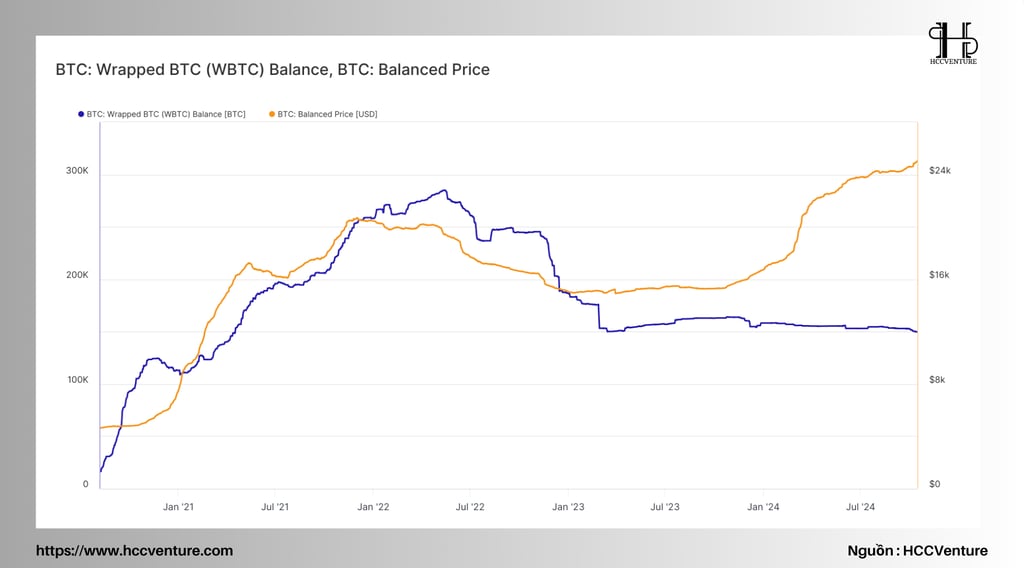
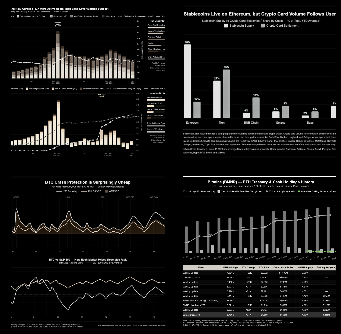
The Wrapped BTC (WBTC) balance reflects the level of liquidity that Bitcoin contributes to Ethereum. An increasing Wrapped BTC balance indicates a rise in the use of Bitcoin within DeFi platforms, meaning that users are increasingly leveraging Bitcoin for borrowing, trading, or participating in other protocols.
A high Wrapped BTC balance signifies strong demand within the DeFi ecosystem. Conversely, a decline in this balance may reflect a trend of capital withdrawal, as users convert WBTC back to BTC to hold outside of Ethereum or due to a decrease in attractiveness of DeFi opportunities.
When the price of BTC surges, users may tend to withdraw WBTC to convert back to BTC, resulting in a decreased Wrapped BTC balance. Conversely, if the price of BTC stabilizes or declines, users might convert BTC to WBTC to seek profits through DeFi.
Changes in regulations regarding cryptocurrency assets could also impact Wrapped BTC balance, depending on how custodians manage BTC. Additionally, if liquidity in DeFi continues to improve, the Wrapped BTC balance could grow due to increasing demand from institutional investors.
Utilizing this non-changing metric is highly beneficial for monitoring the long-term trends of WBTC, as it provides a clear view of asset flows and accumulation over time. This helps investors and analysts achieve a comprehensive understanding of the state and movement of assets within clusters without concerns about interference with historical data, allowing for decisions based on accurate and transparent information.
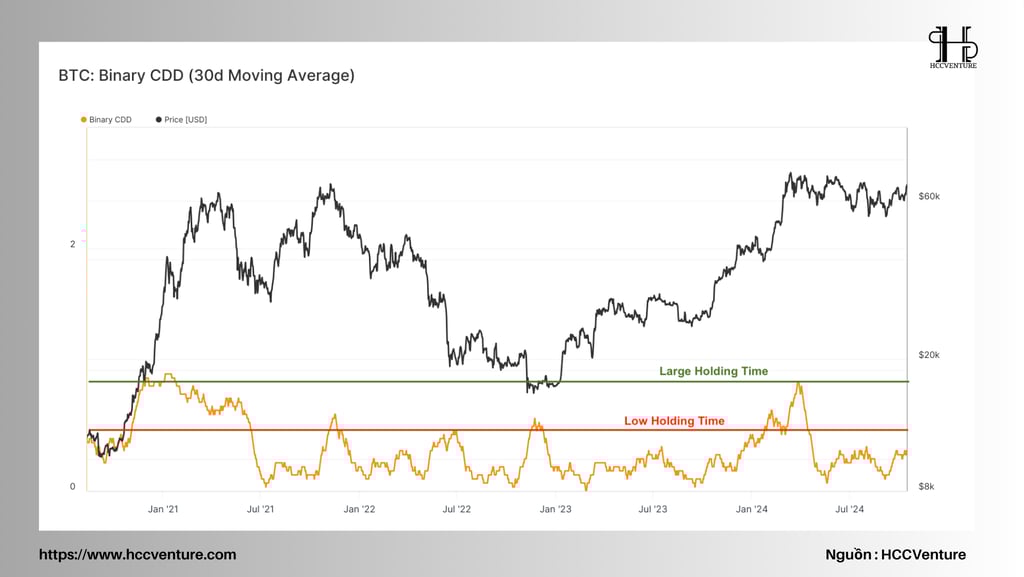
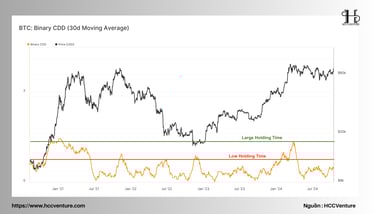
Returning to the assessment of demand, we can utilize the Binary Coin Days Destroyed (CDD) index as a tool to measure pressure from the demand side. The Binary CDD tracks the "coin day destruction" in the market, reflecting when long-term holders engage in significant transactions that balance with the participation of new buyers.
Currently, the CDD index indicates that the volume of coin day destruction is at a low level, suggesting that long-term investors have not been very active within the current price range. This metric can be interpreted as long-term Bitcoin holders maintaining their positions and not selling, indicating a lack of significant movement from seasoned investors in the context of current prices.
Indicators measuring demand intensity show that investor attention and new capital influx within this price range remain relatively weak. Participation from new investors and capital inflow has not shown signs of strong increase, as trading volumes have lacked any notable momentum since the beginning of the year (YTD). According to recent data, current trading volume is approximately 25% lower than the peak reached earlier in the year, demonstrating a marked cooling-off in demand. This may suggest that investors are awaiting new catalysts before returning to the market with greater vigor.
Overall, this analysis highlights the current state of demand within the Bitcoin market, emphasizing the cautious behavior of long-term holders and the need for external factors to invigorate trading activity and investment flows.
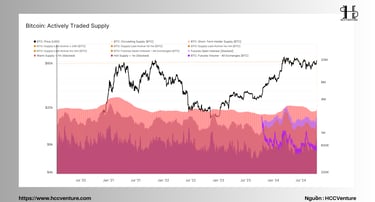
After recognizing a decline in demand, it’s essential to examine the opposing factor—supply. Here, we define "supply" as the volume of coins that market participants are willing to spend and trade.
Data from the chart below shows various indicators of "available supply," including the supply from Short-Term Holders (STH) and Highly Liquid Supply. These indicators are compared to "stored supply" measures such as the Long-Term Holder (LTH) supply and Vaulted Supply.
In recent months, there has been an upward trend in "stored supply" indicators, suggesting that many investors are inclined to HODL or retain their assets rather than sell. This reflects a holding mentality and long-term confidence in the asset's value. Conversely, "active supply" indicators are gradually decreasing, indicating that the number of coins available for trading in the current price range is declining.
This shift suggests that fewer investors are willing to sell coins at current price levels, leading to a constrained supply situation. This could create potential upward pricing pressure if demand recovers, as a lower available supply in the market may heighten competition among buyers. According to recent data, the supply from Short-Term Holders has decreased by nearly 20% compared to three months ago, while Long-Term Holder supply has increased by over 15%, demonstrating a growing tendency to accumulate in the context of the market fluctuating at current price levels.
This analysis emphasizes the dynamic interplay between supply and demand in the Bitcoin market, highlighting the potential for future price movements based on investor behavior and sentiment.
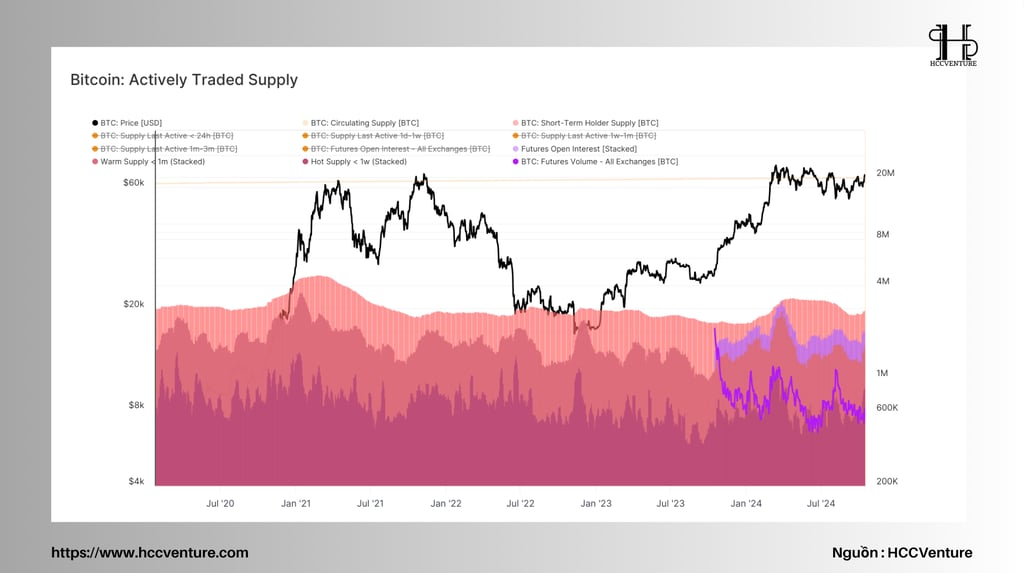
We can enhance the detail of the "available supply" metrics by examining the 'Warm Supply' group, which focuses on coins that have moved within the past month, based on principles of 'coin age.' This provides a more specific view of the subset of coins that are likely to be traded in the near term.
In our study of classifying Long-Term Holders and Short-Term Holders, we found that the likelihood of a coin being traded is closely related to its holding time. This 'Warm Supply' group represents a significant subset of coins with a high probability of changing ownership, providing additional insights into the availability of supply in the short term.
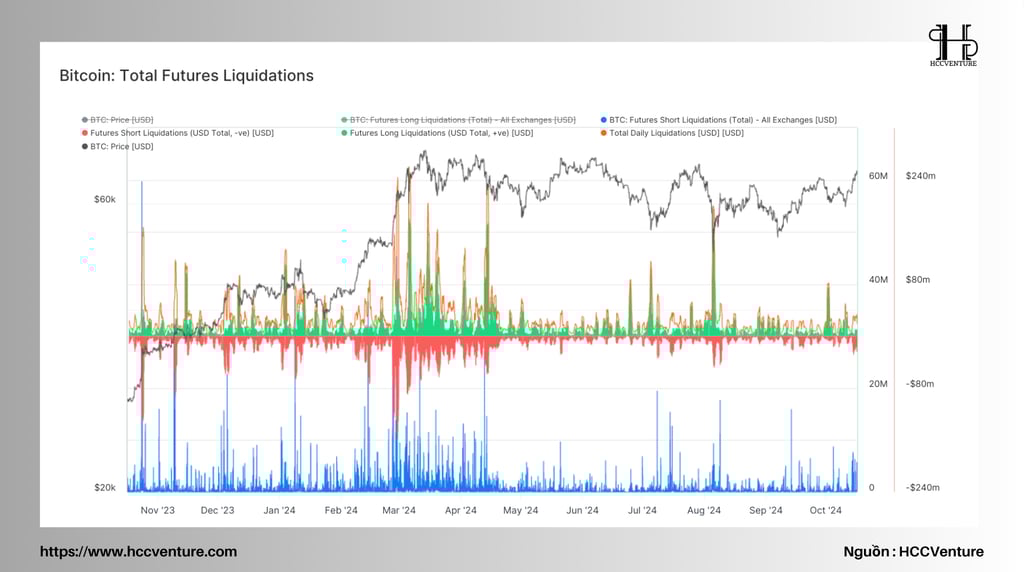
Moreover, we can also assess Trading Volume and Open Interest in the futures market as a form of 'exposed supply' in derivative markets. These indicators reflect the readiness of investors to engage in trading within futures markets, suggesting the level of activity we can expect from the supply side.
Together, these metrics indicate that the active supply has decreased by half since the peak in March. This decline reflects low on-chain trading volume and reduced activity in the futures market, signifying a downward trend in investor attention and speculation. This may imply that investors are currently holding onto their coins for longer periods and are less inclined to sell, indicating that the market is in an accumulation phase with diminishing speculative demand.
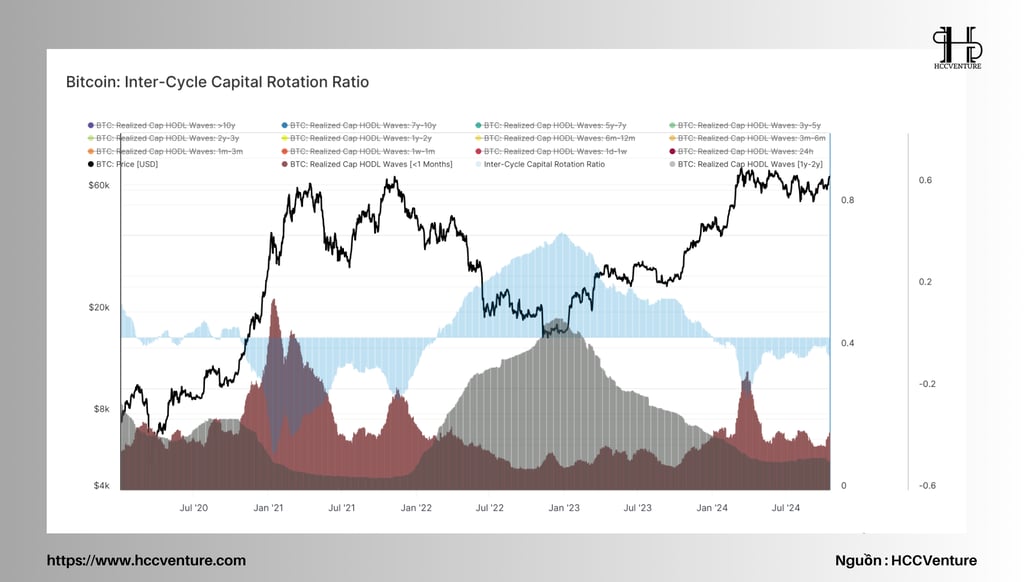
We have identified that both demand is decreasing and supply is tightening. To strengthen this assessment, we need to examine the asset ratios held by these two investor groups. We will consider the behavior of these groups under the following analytical framework.
Short-Term Index [<1 month]
This index is defined as the volume of capital or assets traded over the past 30 days. This group reflects almost entirely the demand, including new investors bringing fresh capital into the market.
Long-Term Index [1-2 years]
This supply segment peaks during the formation of market bottoms. This group represents long-term investors who are less affected by price fluctuations, having accumulated assets during and held through downturns.
Comparing the assets driving buying pressure with the confidence of HODLers, we observe a high but declining presence of new demand. Current new demand is significantly higher than during the bear market of 2022, yet it remains well below the peak levels achieved in March.
We have yet to see a strong and sustainable increase in new demand, which typically accompanies market cycle peaks. Similarly, we also have not begun to experience a significant increase in HODLing pressure, which is often observed during deep bear markets.
This places the current market in a relatively unique equilibrium state, almost at the midpoint between the two extremes of the cycle. This situation indicates a cautious stance among investors, as they navigate the complexities of the marketplace while assessing the balance of supply and demand. Monitoring these dynamics will be crucial for identifying potential future trends in market behavior.
Conclusion and Assessment
The Bitcoin market is currently undergoing a unique phase, characterized by a clear opposition between supply and demand. Following the historic peak in March, when Bitcoin reached $73,000, market demand has sharply declined, with daily trading volume falling to around $730 million, a reduction of nearly 75% from the peak of $2.97 billion at that time. This shift not only reflects the cautious sentiment of investors but also indicates that many have opted to hold onto their assets rather than trade amidst unstable price fluctuations.
Meanwhile, supply is also tightening, with indicators of "active supply" continuously decreasing. Data shows that the supply from Short-Term Holders (STH) has decreased by about 20% over the past three months, while Long-Term Holder supply has increased by over 15%, demonstrating an increase in accumulation in the context of the current price levels. Notably, the "Warm Supply" index indicates that only 10% of the total Bitcoin supply has moved in the past month, showing that very few coins have been traded recently.
Historically, tightening supply conditions often lead to increased volatility. In the past, periods of tight supply, such as those at the end of 2020 and mid-2021, resulted in significant price surges. However, currently, we have yet to see a sufficiently strong wave of new demand to stimulate the market. While the current rate of new demand is approximately 30% higher than during the bear market of 2022, it remains 50% lower than the peak levels seen in March.
In summary, the Bitcoin market is in a waiting state characterized by a dispersion between supply and demand. While the tightening supply may lead to increased volatility in the future, the absence of new demand continues to hinder recovery. Investors should closely monitor market conditions and be prepared to adjust their strategies as clearer signs of renewed demand emerge. Maintaining a cautious mindset is essential in the current market context, as both sides await signals from one another.
Join the HCCVenture community to get the latest market information. Once again, we give our opinion on potential projects in the crypto market. This is not investment advice, consider your portfolio. Disclaimer: The views expressed in this article are solely those of the author and do not represent the platform in any way. This article is not intended to be a guide to making investment decisions.
API & Data : Glassnode
Compiled and analyzed by HCCVenture
Join our telegram community: HCCVenture
Explore HCCVenture group
HCCVenture © 2023. All rights reserved.


Connect with us
Popular content
Contact to us
E-mail : sp_contact@hccventure.com
Register : https://linktr.ee/holdcoincventure
Disclaimer: The information on this website is for informational purposes only and should not be considered investment advice. We are not responsible for any risks or losses arising from investment decisions based on the content here.
TERMS AND CONDITIONS • CUSTOMER PROTECTION POLICY
ANALYTICAL AND NEWS CONTENT IS COMPILED AND PROVIDED BY EXPERTS IN THE FIELD OF DIGITAL FINANCE AND BLOCKCHAIN BELONGING TO HCCVENTURE ORGANIZATION, INCLUDING OWNERSHIP OF THE CONTENT.
RESPONSIBLE FOR MANAGING ALL CONTENT AND ANALYSIS: HCCVENTURE FOUNDER - TRUONG MINH HUY
Read warnings about scams and phishing emails — REPORT A PROBLEM WITH OUR SITE.