

On-chain analysis week 42/2026: Short-term BTC investors have not yet returned to the market
Bitcoin continues to move in a corrective phase, as pressure from the macroeconomic environment and short-term liquidity decline outweigh demand in the spot market. The overall trend suggests that buying pressure is not strong enough to sustain the upward momentum after the mid-week recovery.
PHÂN TÍCH
10/27/202615 min read


On-chain analysis week 42/2026: Short-term BTC investors have not yet returned to the market
Bitcoin continues to move in a corrective phase, as pressure from the macroeconomic environment and short-term liquidity decline outweigh demand in the spot market. The overall trend suggests that buying pressure is not strong enough to sustain the upward momentum after the mid-week recovery.
Analysis • October 27, 2026


Market Summary
BTC opened the week around $81,960 and closed at approximately $80,477, representing a decrease of about 1.81%. During the week, the price briefly rose to nearly $84,777 on October 21st, before reversing and falling below the psychological $80,000 mark towards the end of the week. This indicates that leverage remains a factor amplifying market volatility. However, liquidation primarily reflects the process of releasing leverage and does not, in itself, confirm a long-term downtrend.
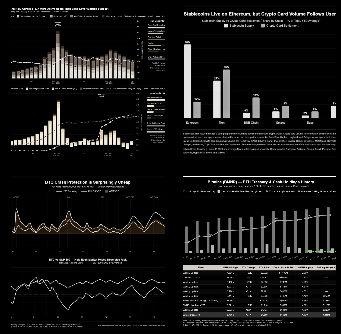
The Bitcoin Price and Apparent Demand 30-day Change chart shows that apparent demand is mostly in negative territory towards the end of the chart. Meanwhile, the Bitcoin Spent Output Profit Ratio (SOPR) is currently around 0.999, close to the break-even point of 1.0. This indicates that spent BTC is being realized with near-zero aggregate profit, reflecting a lack of clear profit-taking momentum across the board. However, a SOPR around 1.0 does not yet confirm that selling pressure has ended; it is necessary to monitor the indicator's ability to remain above this level along with an improvement in spot demand.
Bitcoin's Supply in Profit is at around 68.8%, significantly higher than the historical low of around 40-45%. The market has recovered from deep profit-taking pressure, but has not yet reached the high euphoria typically seen in the later stages of a bull cycle. However, investors who are losing money or close to their cost price may continue to exert selling pressure when the price recovers to previous buying levels.
Relatively low valuations compared to cyclical peaks help to reduce the basis for the view that the market is overheated, but negative apparent demand and SOPR around break-even suggest that demand is not strong enough to confirm a sustained price increase. In the short term, the FOMC meeting on October 27-28, oil price movements, and risk appetite in financial markets may continue to dominate price movements.
The market has recovered significantly from past yield stress zones, but demand has yet to show a sufficiently clear expansion. Therefore, the immediate trend remains a phase of testing the strength of buying pressure and rebalancing valuations. Maintaining prices above $80,000 will help stabilize the short-term structure, but confirming an uptrend requires further consensus between price, on-chain demand, and institutional capital flows.
Analyzing on-chain metrics
During the period from late 2025 to early 2026, the Apparent Demand 30-day Change largely remained below zero, although there were some short-term positive surges in November 2025. These positive surges indicated that apparent demand had improved significantly, but did not last long enough to form a stable positive state.


The deepest decline occurred in June 2026, when the Apparent Demand 30-day Change at one point dropped to approximately -220,000 to -240,000 BTC along the shown axis. However, a negative value for the indicator does not mean that exactly 220,000-240,000 BTC were sold on the spot market; this is a change in demand as defined by the model, not actual sales flow data.
Given that prices have recovered from the $58,000-$60,000 range but the index remains negative, current data does not yet show a clear and sustainable supply-demand imbalance according to this measurement method. Therefore, the price recovery should be considered a completed event, while the sustainability of the trend still requires further confirmation from demand.
Conversely, if the index continues to fall sharply or returns to significantly negative territory while prices remain around $80,000–$85,000, the divergence between price and apparent demand will become more noticeable. At that point, the current price level may become more sensitive to increases in supply or decreases in liquidity and is no longer a sure sign that prices will fall, but it is a condition to monitor when assessing pricing risk.


Bitcoin has moved away from the high valuation levels seen during previous bull cycles, but has not yet entered the deep negative territory corresponding to some historical lows. The MVRV Z-Score is currently around -0.3 to -0.5, while previous lows were around -1.0 to -1.5. Simultaneously, the 365-day SMA is declining, indicating that the medium-term valuation trend has not yet clearly recovered.
Deep negative zones typically appear when the price of BTC falls sharply and the market's unrealized gains shrink. At that point, market capitalization may approach or fall below the exercised capitalization, reflecting a relatively low valuation compared to historical levels. It's noteworthy that the current level is significantly lower than the positive peaks of previous bull cycles, but still well above the deep negative zones previously seen in bear markets.
It can be seen that a lower-than-historical MVRV Z-Score could create a relatively more favorable valuation base compared to when the index is in the high zone, but the effectiveness of this signal depends on the subsequent developments of market price and realized capitalization. If the MVRV Z-Score sustainably recovers and surpasses the 365-day SMA, the market will have further evidence that relative valuation is improving. Conversely, if the index continues to fall to historically negative zones, it will reflect a further contraction in valuation relative to the on-chain platform.


In early 2026, the 30-day balance change of accumulating addresses fluctuated relatively widely. On the chart, the index rose to around 120,000-140,000 BTC in January, then declined and remained in the lower range from February to May. By June, when Bitcoin corrected to the 60,000-65,000 USD range, the accumulated balance was also in the lower range compared to the peaks at the beginning of the year.
From July to September, the index fluctuated but did not form a continuous upward trend. By the end of October 2026, the accumulated balance increased sharply and approached 240,000 BTC, the highest level on the chart. Compared to the bottom of around 60,000-70,000 BTC that appeared in some previous periods, the final level was significantly higher, indicating that the balance of the accumulated address group had increased sharply in line with this index.
If the increase is confirmed by complete data, it indicates that the amount of Bitcoin held in accumulation group addresses has increased over the last 30 days. However, the balance indicator does not itself prove that all of that BTC was newly purchased from the spot market, nor does it indicate the cost basis of these addresses.
If the Liquidity Inventory Ratio is defined to reflect the relative supply of liquidity, a decrease could imply a significant change in the liquidity status. However, without a precise formula, a ratio falling to 35 should not be interpreted as conclusive evidence that market liquidity has dried up or that the supply of available shares has decreased accordingly.


STH SOPR is particularly valuable for assessing short-term investor reaction to price fluctuations. In an uptrend, the index often exceeds 1 when coins are spent at prices higher than their cost basis; the 1 level sometimes becomes a crucial test zone during market corrections. In 2026, STH SOPR will still show points below 1, but mostly closer to the break-even point than its previous deepest loss zones.
Currently, the STH SOPR is still fluctuating near the 1 mark instead of maintaining a clear profit zone, indicating that the BTC price recovery has not yet fully translated into a stable profit state for short-term investors. The frequent return of the STH SOPR around 1 suggests that short-term investors are realizing profits or losses relatively close to their cost basis. The instances where the index falls below 1 reflect continued loss pressure, but the overall depth does not show extreme levels comparable to historical sharp declines. Therefore, the current state is consistent with a market rebalancing after a correction, where short-term investors remain sensitive to price fluctuations.


The current SOPR around 0.999 suggests the market is near break-even considering the amount of BTC spent. Compared to the low of nearly 0.95, the pressure to realize losses has significantly decreased. However, compared to periods when the SOPR remained above 1.10 in 2025, the likelihood of realizing profits is now considerably lower.
With BTC price hovering around $80,500 at the end of the chart, the return of SOPR to the 1 level indicates that the current price has not consistently generated significant realized profits on the amount of coins spent. It doesn't mean all investors are breaking even, as the cost basis of each coin and each group of investors varies. SOPR reflects the output of spent coins, not the total unrealized profit of the market.
In the next phase, a more positive signal would be SOPR remaining above 1 along with the upward trending 30-day EMA. Conversely, a return of the index to the lows near 0.95 would indicate increasing pressure to realize losses. Therefore, current data leans towards a stabilization phase after the correction, and there is insufficient basis to conclude that the market has entered a sustainable uptrend.


The chart shows that the yield on 10-year US Treasury bonds has risen from a low of around 0.5% in 2020 to a high of around 4-5% in recent periods, and during the same time, Bitcoin has experienced several cycles of ups and downs but has still formed a long-term uptrend.
The 10-year bond yield is an important macroeconomic variable for Bitcoin valuation, but it is not a standalone indicator that can directly predict BTC price. A high-yield environment increases the opportunity cost of holding Bitcoin and can put pressure on valuation if liquidity and demand weaken. However, the strength of this impact depends on the causes of yield fluctuations and the state of capital flows in the digital asset market.
From an asset valuation perspective, 10-year bond yields are influenced through opportunity costs and financing conditions. When yields rise due to expectations of higher real interest rates or continued tight monetary policy, capital flows may shift toward income-generating assets, reducing the relative attractiveness of Bitcoin.
Conversely, if yields fall due to cooling inflation expectations, a shift to accommodative monetary policy, or increased safe-haven demand, pricing conditions may be more favorable for risky assets. However, it's important to distinguish the causes of yield declines: falling yields amid improved liquidity could support Bitcoin, while yields falling due to fears of a severe recession could be accompanied by a decline in risk appetite.


Research and Analysis
Market Summary
Analyzing on-chain metrics
Apparent Demand 30-day Change
MVRV Z-Score
Liquidity Inventory Ratio
STH SOPR
Bitcoin & 10Y US Treasury Yield
BTC Growth Rate Difference
Bitcoin Price Geopolitical Shock
Bitcoin Spot Volume Bubble Map
BTC Spot ETF Average Netflows by Price Range
Assessment and Conclusion
Current indicators show that Market Cap remains at historically high levels, while the growth gap between Market Cap and Realized Cap is in negative territory, reflecting a lack of consensus between market valuation size and the dynamics of on-chain cost basis changes.
The BTC Growth Rate Difference shows that Bitcoin has experienced several periods of deep negative market capitalization growth differentials, notably in 2015, late 2018, and late 2022, with estimated lows of around -0.003 to -0.004. At the end of the 2026 chart, the index is in negative territory of around -0.001 to -0.002, shallower than historical lows, while the Market Cap remains above $1 trillion.
Compared to its historical low, the current negative level is not yet extreme. However, in terms of direction, the fact that the index continues to remain below zero indicates that there is no clear confirmation that the market capitalization growth rate has improved relative to realized capitalization; the valuation scale remains large, but the relative momentum between the two has not yet created a sustainable positive signal.
If the recovery index returns to the 0 threshold and remains in positive territory, it would indicate that the Market Cap growth rate is improving relative to the Realized Cap according to the model. When this signal appears simultaneously with stable or rising BTC price, it could reinforce the conclusion that pricing momentum is improving.


The BTC Liquidity Flow (OTC vs Exchange) 24H index tracks the proportion of Bitcoin transactions on centralized exchanges (CEXs) over a 24-hour period, in parallel with BTC price movements. Data shows that CEX trading volume has not yet returned to the peaks of the previous cycle. Although Bitcoin has recently recovered, this indicates that trading activity on exchanges has not yet reached the intensity seen during the bull market.
If the BTC price continues to rise and the CEX weighting recovers steadily, combined with improved trading volume and liquidity depth, this would reinforce the view that the uptrend is attracting broader trading activity on centralized exchanges. Conversely, if the price recovers but the CEX weighting remains low, caution is needed when assessing market participation, and it is necessary to check whether trading activity is shifting to other channels. This indicator should not be used in isolation to determine price targets or predict reversal points.
The current CEX trading volume is significantly lower than during previous peak periods, indicating that the relative trading intensity on centralized exchanges has not yet recovered to the historical highs of the cycle. In the next phase, a key signal to watch is whether the CEX volume will sustainably recover along with the BTC price and trading volume.


Considering the entire data series, Bitcoin transitioned from a deep decline at the end of 2022 to a valuation expansion phase in 2024-2025, followed by a correction in 2026. The 2022 bottom was recorded around $15,000-$16,000, while the 2025 cycle peak reached approximately $120,000-$125,000. At the end of the chart, the price hovered around $80,000-$85,000, significantly lower than the peak but still much higher than the base price of the preceding decline cycle.
February 28, 2026, marked a Geopolitical Shock for the market, and after this point, the price of BTC continued to fluctuate sharply, while the geopolitical divergence zone shifted closer to zero at the end of the data series. Compared to the deep negative zone of approximately -60% to -65% during the 2022 bottom, the current divergence has narrowed significantly. This reflects a shift in the indicator pattern, but does not mean that geopolitical risk has disappeared or that the market has fully absorbed the macroeconomic shocks.
The narrowing of the geopolitical deviation from deep negative to near zero indicates that the pattern indicator has returned to a state close to the reference line. If the price continues to remain above the realized price level and market demand improves, the pricing structure will have a more stable basis. Conversely, if the price falls rapidly to the Realized Price zone while demand weakens, the risk of a deeper correction will increase.


The Bitcoin Spot Volume Bubble Map shows that spot trading activity has undergone several cycles of transition between neutral, cooling, increasing intensity, and overheating states since 2017. Overheated clusters often appear during significant acceleration phases, while neutral or cooling states predominate during many corrective phases.
Currently, prices are significantly lower than their 2025 peak, while trading activity is mostly neutral or cooling down. This structure doesn't show signs of widespread trading euphoria as classified by the model. However, a less heated state doesn't necessarily mean Bitcoin's valuation is low, as valuation also depends on the base cost, unrealized profits, new demand, and macroeconomic liquidity conditions.
In the next phase, if the price of BTC increases along with a sustained expansion of spot volume and trading sentiment gradually shifts from neutral to heated, it would reinforce the view that market participation is increasing, the market is not yet showing signs of prolonged overheating as in the pattern, but there is not enough basis to confirm that spot demand is recovering strongly or that pricing has become attractive.


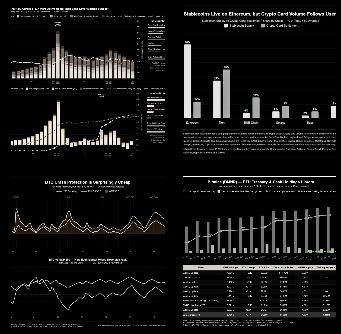
Capital allocation to spot Bitcoin ETFs can remain strong during periods when BTC is trading at high valuations; demand for ETF investment doesn't necessarily only appear when prices fall to low levels. In an uptrend, investors may continue to increase their exposure to BTC as prices break through previous thresholds, especially if long-term expectations and asset accessibility improve.
IBIT has been a prominent contributor to positive capital inflows at high price levels, while GBTC has shown clear outflow pressure in some areas. This suggests the need to analyze ETF capital flows by product and on a consolidated basis, rather than using a single fund as a representative of all institutional investment needs.
The differentiation among funds is significant for assessing institutional investment needs. Observing only the outflow of capital from GBTC might underestimate the extent to which capital is shifting to other ETFs. Conversely, focusing solely on the positive columns of IBIT might overlook outflows from other products. A more appropriate measure for assessing the overall impact is the consolidated net inflow of all spot Bitcoin ETFs, after accounting for both inflows and outflows from each fund.
Assessment and Conclusion
Bitcoin entered a correction phase in late October 2026 after failing to maintain its earlier expected upward momentum, at one point breaking below $80,000 and triggering a wave of leveraged position liquidations. This development reflects a weakening of short-term bullish momentum, especially as the market simultaneously faces uncertainty regarding US monetary policy, inflationary pressure from energy prices, and a decline in risk appetite in financial markets. However, to assess the valuation outlook, price movements need to be considered alongside on-chain indicators of demand, realized profits, supply structure, mining activity, and institutional capital flows.
The Bitcoin MVRV Ratio Z-Score on the historical chart is currently significantly lower than the peak valuation levels of previous bull cycles. This suggests the market has not yet exhibited the same extreme valuation states as the periods of strong euphoria in the past. Simultaneously, the Percent Supply in Profit is around 68.8%, higher than the historical low of 40-45% but still lower than the 90-100% levels seen during periods of rapid market growth.
The key drawback lies in the quality and continuity of demand. The Bitcoin Price and Apparent Demand 30-day Change indicator remains largely in negative territory at the end of the chart, implying that apparent demand has not recovered strongly enough to sustainably absorb supply. Meanwhile, the SOPR is around 0.999, close to the break-even point of 1.0, suggesting that the BTC being spent is realizing near-zero overall returns.
Regarding investor behavior, the Long-Term Holder Activity Levels (using a 30-day CDD) indicator records historical spikes, including periods of strong price increases and periods of high volatility. ETF data should be evaluated in a similar light. The spot ETF flow chart by price range shows significant differences between IBIT, FBTC, ARKB, and GBTC, with IBIT exhibiting large positive flow columns at some high price levels, while GBTC records significant negative columns at some lower price levels.
Finally, the Fed's decision on October 27-28 will influence interest rate expectations and risk appetite, but Bitcoin's reaction will depend on policy guidance and inflation developments, particularly energy prices. At the on-chain level, positive signals need to come from a sustained recovery in apparent demand, SOPR remaining above the break-even point, and positive net ETF inflows confirmed by actual data. If these conditions occur simultaneously, the market will have a stronger basis to shift from rebalancing to a valuation recovery.
Disclaimer
This report was prepared by HCCVenture Research with the aim of providing information, research, and market analysis. The entire content of the report is based on publicly available data, on-chain data, market data, venture capital (Venture Capital) data, macroeconomic data, and HCCVenture's internal research methodologies at the time of publication. Data sources are compiled from numerous reputable research platforms and organizations, including but not limited to Glassnode, CoinGecko, TradingView, Dune Analytics, CoinGlass, CryptoRank, RootData, PitchBook, DefiLlama, CryptoQuant, Messari, Token Terminal, Artemis, CoinMarketCap , public blockchain data, reports from financial institutions, investment funds, blockchain companies, and other publicly available information sources. HCCVenture strives to select reliable data sources and applies a verification and cross-checking process throughout its research. However, HCCVenture does not guarantee the completeness, accuracy, timeliness, or error-free nature of all data due to differences in statistical methods, data collection scope, update times, or adjustments from data providers.
All opinions, assessments, valuation models, cyclical analysis, on-chain data, capital flow analysis, Venture Capital activity, ETFs, Digital Asset Treasury Companies (DATs), technical indicators, macroeconomic indicators, and scenarios presented in this report reflect only the research views of HCCVenture Research at the time of publication, based on available assumptions and data. These contents are not investment advice, financial advice, legal advice, accounting advice, tax advice, brokerage advice, portfolio management advice, or recommendations to buy, sell, or hold any digital asset, security, financial product, investment fund, blockchain protocol, or business. The digital asset and blockchain markets are highly volatile and are influenced by global liquidity, monetary policy, regulatory regulations, macroeconomic conditions, and many other unpredictable factors. Therefore, the trends, patterns, correlations, or historical cycles mentioned in this report are not guaranteed to repeat in the future and should not be considered reliable predictions of market developments. Readers should conduct their own independent research ( DYOR – Do Your Own Research ) and consult with qualified financial, legal, tax, or investment professionals before making any decisions. Any investment decisions or actions arising from the use of information in this report are the sole responsibility of the reader.
HCCVenture, its affiliates, research team, personnel, or related parties may own or will own digital assets, invest in blockchain projects, investment funds, technology companies, or maintain commercial, research, media, consulting, or collaborative relationships with the organizations, protocols, businesses, or platforms mentioned in this report. These relationships may create actual or potential conflicts of interest, although HCCVenture always applies internal research standards to maintain objectivity and independence in its analysis. Nothing in this report is construed as an offering, brokerage, promotion, fundraising, or provision of investment services as regulated by any country or territory. The entire content of this report is protected under intellectual property and copyright law. It is strictly prohibited to copy, modify, reproduce, distribute, or use all or part of this report for commercial purposes in any form without the written consent of HCCVenture. Accessing, using, or quoting this report signifies that the reader has understood, accepted, and agreed to the entire content of this disclaimer.
Explore HCCVenture group
HCCVENTURE QUANT JSCO
© 2026 HCCVENTURE. ALL COPYRIGHTS RESERVED.


Connect with us
Popular content
Contact to us
Address: 8th Floor, Bach Dang Complex Building, 50 Bach Dang Street, Hai Chau Ward, Da Nang City, Vietnam.
Phone: 1900 1509
Gmail : sp_contact@hccventure.com
Disclaimer: The information on this website is for informational purposes only and should not be considered investment advice. We are not responsible for any risks or losses arising from investment decisions based on the content here.
TERMS AND CONDITIONS • CUSTOMER PROTECTION POLICY
ANALYTICAL AND NEWS CONTENT IS COMPILED AND PROVIDED BY EXPERTS IN THE FIELD OF DIGITAL FINANCE AND BLOCKCHAIN BELONGING TO HCCVENTURE ORGANIZATION, INCLUDING OWNERSHIP OF THE CONTENT.
RESPONSIBLE FOR MANAGING ALL CONTENT AND ANALYSIS: HCCVENTURE FOUNDER - TRUONG MINH HUY
Read warnings about scams and phishing emails — REPORT A PROBLEM WITH OUR SITE.