On-chain analysis week 42/2025: Bitcoin and marginal connection
The market suffered a ~$19 billion derivatives deleverage – one of the largest in history. The shock broke through the $117k–$114k cost-basis cluster, putting some recent peak buyers into losses, exposing short-term fragility.
10/20/20259 min read
Summary of the situation
URPD and real price distribution show a thick liquidity cushion at $117k–$114k with next support at $110k–$108k ; above, the $126.1k zone is still quite thin on historical supply, so only a recovery in marginal demand is enough to trigger a revaluation . STH-MVRV(155D) narrows to ~1.0 – a typical pattern of a leverage reset , not a “capitulation”. This confirms that total net profit (NUPL/MVRV) is only shrinking from euphoria , not reaching the pessimistic extremes of a cycle reversal phase.
LTH Net Position Change (3D) gradually moved to neutral after many weeks of net selling: distribution momentum slowed down . When the structural supply was no longer selling strongly , the price sensitivity to each marginal demand unit increased significantly. The "orderly selling" spot flow and mainstream selling on some floors were absorbed by the corresponding spot demand, and the net withdrawal trend from the floor on the 12-month frame was still maintained → thin free-float , reducing the risk of chain sell-offs.
In the last week, ETF spot net -2.3k BTC , reflecting the slowdown in institutional demand at the right time when the market needs "end buyers". However, the current context is favorable for capital efficiency , leverage has been washed out, free-float is low. Therefore, just need ETF to return to positive position to trigger the upward repricing without the need for high leverage as before.
Estimated Leverage Ratio fell to a multi-month low while funding dropped to a similar level to FTX-2022, almost confirming that forced position cleaning had occurred. Options OI/volume recovered quickly , vol 76% , short-term skew +17% (put-rich) then gradually neutralized ; dealer gamma approached balance , reducing the risk of hedging chasing prices .
Market Summary
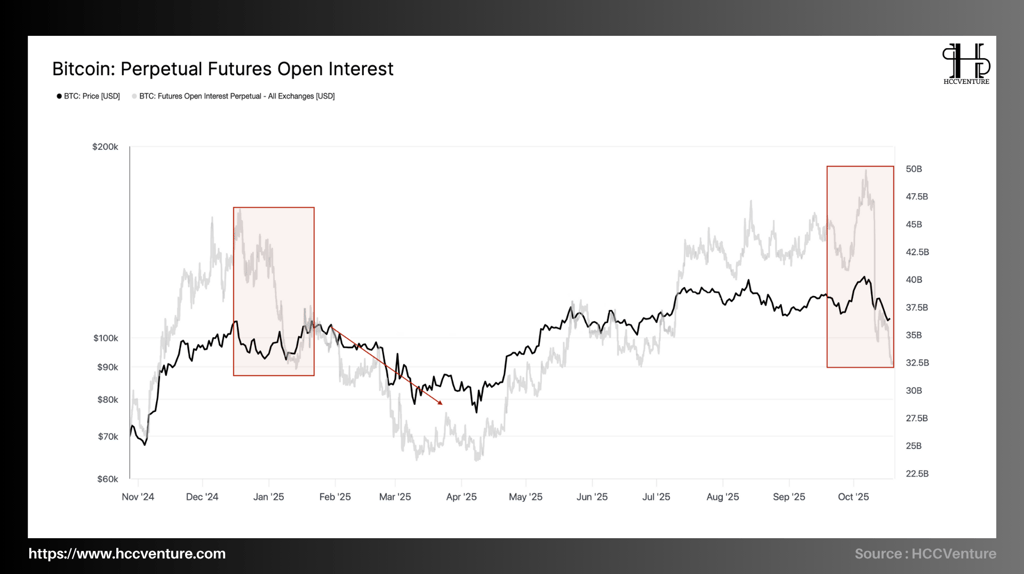
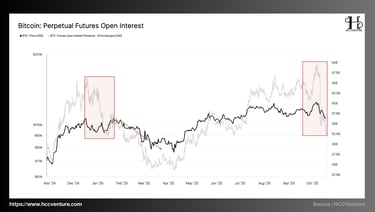
During the strong growth period from June to September 2025, Open Interest continuously escalated, peaking at ~47.5 billion USD along with Bitcoin price approaching the $126,000–$127,000 range . This was the highest level since the 2021 bull cycle. However, in early October, the market witnessed a sudden deleverage , bringing Open Interest to the bottom of ~33 billion USD – the lowest since April 2025. This pattern repeated almost exactly the scenario of Q1/2025, when leverage flow was withdrawn from the system after the overheating period.
It is worth noting that the BTC price only dropped moderately (~10–12%) , while the OI dropped by almost 30% , implying that the drop was more of a “technical cleanup” than a fundamental sell-off. In other words, most of the contract closures were not due to systemic fear, but rather forced closures as funding rates plummeted and exchanges tightened margins.
When compared to the January–March 2025 period (first red box on the chart), the current pattern shows clear symmetry. Both periods started from a high leverage peak – a sustained positive funding rate – OI exceeding $45 billion , and both ended with a strong “drag” that reduced OI by around 25–30%. After the early-year cleanup, the BTC market entered a 6-month recovery phase, with the price rising from ~$75,000 to ~$126,000.
According to this model, the October 2025 cleanup could play a similar role to the early-year rebalancing phase – a necessary “leverage wash” to establish a foundation for the next rally. The similarity is that after each sharp OI drop, funding returns to neutral levels, derivatives liquidity is rebuilt, and weak speculative positions are removed from the system, helping the market return to a healthy state.
In the context of the ELR (Estimated Leverage Ratio) and OI falling together, the price reaction shows that the sensitivity to leverage has decreased sharply , which means that the two-way amplification risk of derivatives has been neutralized. Spot data from major exchanges such as Coinbase and Bitstamp shows that buying volume remains stable, while BTC withdrawals from exchanges remain at a net level of -18,000 BTC/month - proving that the actual selling pressure from the spot has not increased. Thus, this OI drop does not reflect capital flight, but rather a reasonable cooling period of the derivatives market after a high leverage cycle .

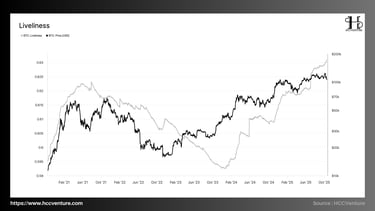
Bitcoin Liveliness is currently hovering around ~0.625 (highest since 2021, but below its historical peak of ~0.63). After hitting a cycle bottom of ~0.596 in the first half of 2023 (a strong accumulation phase), the index rose steadily throughout 2024–2025 as the market revalued, then started to flatten in recent weeks.
Definition: Liveliness = Coin Days Destroyed / (Coin Days Destroyed + Coin Days Created).
The increase shows that many “coin-days” are destroyed leading to spend/distribution dominating over hold/accumulation .
Decrease shows the “age” of accumulated UTXOs leading to consolidation , free-float shrinks.
Currently (Q4/2025), the Liveliness index is at ~ 0.625 , increasing compared to 2024 but the slope has slowed compared to Q2-III/2025. This is consistent with other distribution indicators shifting to neutral (LTH Net Position Change 3D), implying disciplined distribution has passed the peak. However, high but flat Liveliness shows a slowing spend . Combined with the 12-month net withdrawal trend from the exchange and LTH-Supply ~14.5 million BTC maintaining the peak area, the amount of supply available for sale is still not large .
When Liveliness is no longer climbing, the “coin-day” does not collapse massively and cause Accumulation to return to the margins. In a context of washed-out derivatives leverage , a steady spot/ETF buying flow is enough to trigger repricing . Historically, the cyclical sell signal has been accompanied by a sustained steep rise in Liveliness and a break above the extreme threshold , but this condition does not exist now .
Liveliness is at a high level but has “cooled down”, showing that the distribution of long-term wallets is cooling down , while the supply base is still controlled by LTH . With a thin free-float, the system leverage has been rebuilt at a safe level and Liveliness has not created a new peak , the basic scenario for the medium term is to accumulate and recompress , waiting for ETF/spot to return to net buying to re-evaluate to a new high .
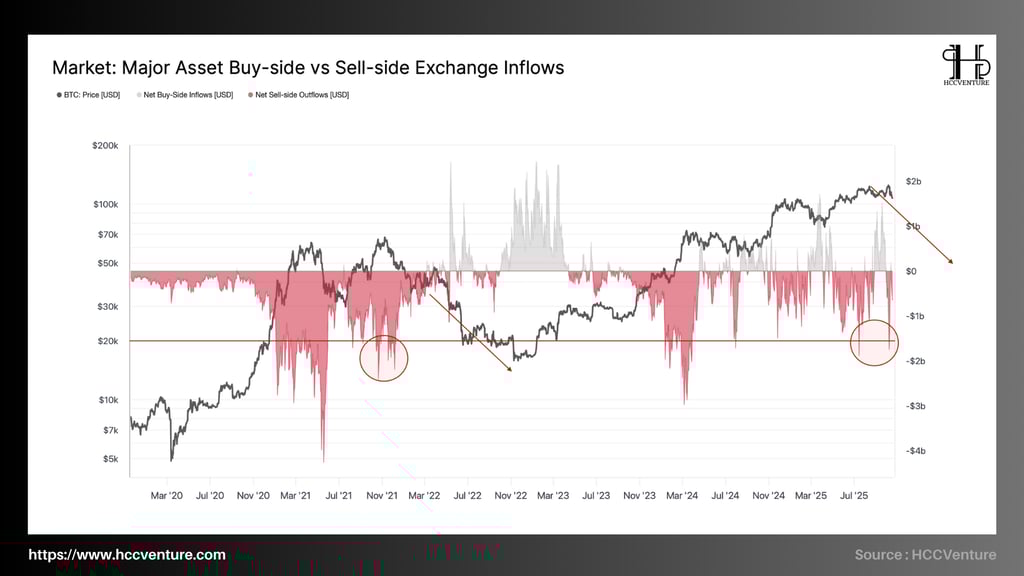
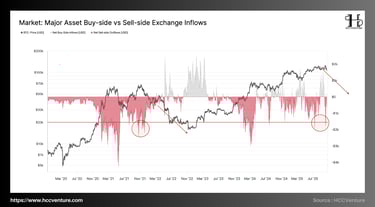
The Buy-side vs Sell-side Exchange Inflows indicator reflects the difference between the amount of capital deposited into the exchange for selling and the amount of capital withdrawn for long-term holding. Looking at the latest data, the period from late Q3 to early Q4/2025 , the Bitcoin market is witnessing a strong negative outflow , similar to the correction phases of 2021 and 2022.
In the chart, the deep red zone represents a sharp increase in sell-side inflows , reaching the equivalent of -$1.8 to -$2.0 billion/day during the peak sessions – a similar scale to the sell-offs in May 2021 and November 2022. However, the important difference is that the current price reaction is significantly more stable: instead of breaking the medium-term bullish structure, the price has only corrected shallowly around the $115k–$117k region.
Compared to the previous cycle, the 2021–2022 net sell-off was accompanied by a liquidity collapse and a sharp outflow from ETFs, leading to a full capitulation phase. In contrast, in the current phase, the selling pressure was absorbed relatively smoothly by spot demand and neutral accumulation institutions, indicating a more sustainable supply–demand structure.
On the other hand, buy-side inflows have been virtually absent in the past two weeks, reflecting the “stay-out” mentality of institutional investors and ETFs after a period of strong market volatility. However, this absence also creates the premise for a quick “repricing” if cash flows return.
The current thin liquidity structure makes each marginal demand unit capable of pushing prices significantly higher than before — similar to the early 2023 period when supply on the floor hit bottom and prices rebounded sharply without sudden capital inflows.
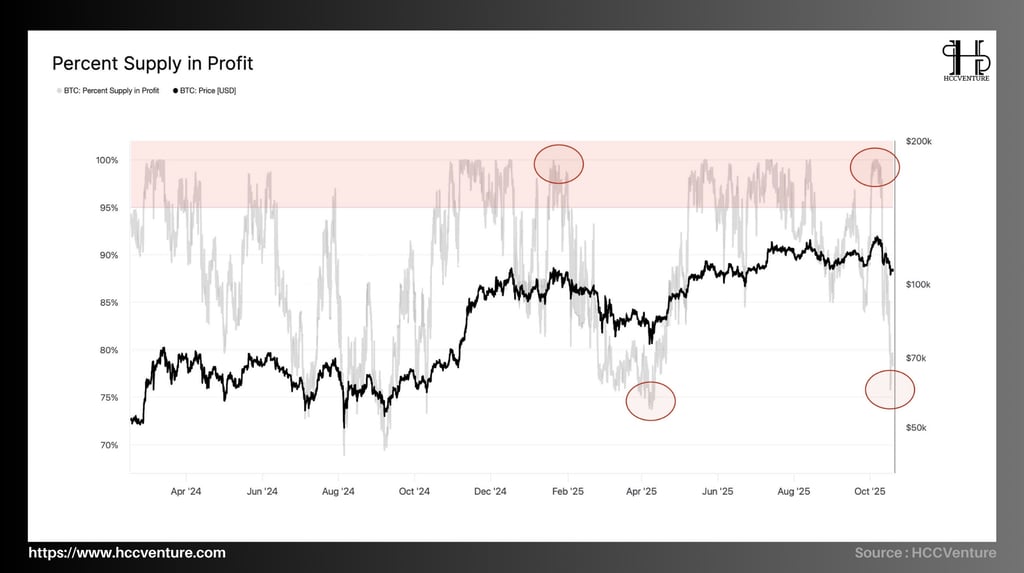

The Percent Supply in Profit (PSiP ) has just withdrawn from the >97–99% zone (the “profit saturation zone”) to ~75–77% after the correction to the $117k–$114k cluster . This contraction is equivalent to the “resets” in early Q2/2025 and Q4/2024 , but is still significantly higher than the historical panic bottom (≤60%). The structure shows that the market is shifting from excitement to rebalancing and has not recorded any signs of breaking the system profit.
Definition: PSiP = % of UTXOs whose realized price is lower than the current market price.
PSiP ≥97–99% indicates saturated profits leading to easy profit taking and large margin fluctuations.
PSiP 70–85% indicates balance–accumulation, healthy distribution of profits, recovering risk appetite.
PSiP ≤60–65% indicates extreme pessimism/capitulation.
PSiP drops ~22–24 percentage points from the saturation peak to the equilibrium zone, but remains above the neutral threshold of 70%, where network profits are moderately eliminated , without creating a spillover effect. As PSiP leaves the 99% zone to 75–77%, the amount of “profit-taking-sensitive” UTXOs drops sharply, combined with the LTH Net Position Change moving to neutral, the available supply for sale is no longer large

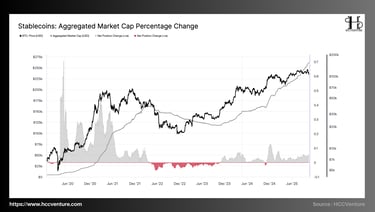
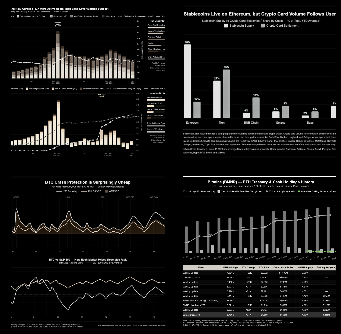
The total capitalization of the stablecoin group is now around $275 billion , marking a sharp increase compared to the 2022–2023 decline period when the total market size fell below $150 billion . The Aggregated Market Cap Percentage Change index reflects the net change in capital flows in the stablecoin system – representing potential liquidity ready to return to the crypto market.
The steady increase in stablecoin capitalization throughout the second half of 2024 and maintaining a positive growth rate into the fourth quarter of 2025 represents a sustainable recovery of USDized capital flows, acting as liquidity fuel to support the new growth cycle of Bitcoin and risk assets.
Historical observations show that each period of strong stablecoin market capitalization expansion has been preceded by a prolonged Bitcoin bull run. Specifically, the 2020–2021 bull run saw the stablecoin market capitalization increase from $30 billion to nearly $180 billion , coinciding with BTC’s rise from $10,000 to $69,000 .
In the period of 2022-2023, when the capitalization of the stablecoin group decreased by nearly -25% , the market fell into a deep correction cycle. Currently, this index is in the strongest expansion zone since the beginning of 2021, with a stable net increase rate of around +0.6-0.7%/month , corresponding to the continuous flow of new USD into the market through USDT, USDC and new stablecoins such as FDUSD, USDG and mUSD.
The expansion of stablecoin capitalization reflects two main drivers: (1) systemic liquidity is being reallocated from traditional assets to digital assets, and (2) strong demand for stablecoin liquidity reserves in crypto exchanges, OTC platforms, and ETFs.
The persistently positive inflows over the medium term confirm that institutional investors are still sitting on cash rather than completely withdrawing from the market – a key sign that cyclical confidence is still intact. Additionally, the ratio of net stablecoin inflows to the total crypto market capitalization is currently around 13–15% , the highest in over two years, creating a potential “liquidity buffer” for a BTC and ETH recovery when the immediate bridge returns.
Evaluation and Conclusion
Bitcoin’s rally to a historic high of $126.1k reversed as macro stress combined with a ~$19 billion derivatives deleverage – one of the largest in history. Price broke through the $117k–$114k cost-basis cluster , putting some near-peak buyers in the red and exposing short-term fragility. On-chain data shows cooling demand and continued LTH distribution , while spot ETFs weakened ; however, the spot market sell-off was orderly , and derivatives cleaned out leverage , keeping systemic risk low.
After weeks of net selling, LTH Net Position Change (3D) gradually moved to neutral , showing a slowing distribution rate. STH-MVRV(155D) contracted to ~1.0 (break-even), a true “de-leverage” pattern rather than a cycle capitulation. URPD shows a thick liquidity cushion at $117k–$114k and the next level at $110k–$108k ; above $126.1k is a thin layer of historical supply, so only a return of marginal demand is enough to trigger a revaluation .
Derivatives and options. Estimated Leverage Ratio falls to multi-month low ; funding drops deeply to the same area as FTX-2022 , confirming forced position cleaning . In options, open interest/volume recovers quickly , volatility jumps to ~76% , short-term skew flips to put-rich ~+17% then gradually neutralizes; dealer gamma returns to near balance , reducing the risk of hedging "price chasing". The micro level is therefore no longer fragile .
The system has reset risk (deleverage ~$19B, ELR & funding bottom), the supply structure is still controlled by LTH and the structural selling pressure has subsided ; therefore, the mid-term base case is accumulation-recompression in the $114k–$117k range and then continue the uptrend as ETF/spot net inflows reverse and on-chain indicators maintain accumulation. The prerequisite for a new repricing is no longer leverage, but entirely dependent on institutional spot flows .
Disclaimer: The information presented in this article is the author's personal opinion in the cryptocurrency field. It is not intended to be financial or investment advice. Any investment decision should be based on careful consideration of your personal portfolio and risk tolerance. The views expressed in this article do not represent the official position of the platform. We recommend that readers conduct their own research and consult with a professional before making any investment decisions.
API & Data: Glassnode
Compiled and analyzed by HCCVenture
Join HCCVenture here: https://linktr.ee/holdcoincventure
Explore HCCVenture group
HCCVenture © 2023. All rights reserved.


Connect with us
Popular content
Contact to us
E-mail : sp_contact@hccventure.com
Register : https://linktr.ee/holdcoincventure
Disclaimer: The information on this website is for informational purposes only and should not be considered investment advice. We are not responsible for any risks or losses arising from investment decisions based on the content here.
TERMS AND CONDITIONS • CUSTOMER PROTECTION POLICY
ANALYTICAL AND NEWS CONTENT IS COMPILED AND PROVIDED BY EXPERTS IN THE FIELD OF DIGITAL FINANCE AND BLOCKCHAIN BELONGING TO HCCVENTURE ORGANIZATION, INCLUDING OWNERSHIP OF THE CONTENT.
RESPONSIBLE FOR MANAGING ALL CONTENT AND ANALYSIS: HCCVENTURE FOUNDER - TRUONG MINH HUY
Read warnings about scams and phishing emails — REPORT A PROBLEM WITH OUR SITE.