On-chain analysis week 42 / 2024 : Check the average
After experiencing a price correction of 10%, the Bitcoin market has rebounded back to $63,000 in an effort to reclaim the cost basis for short-term holders. This recovery demonstrates a positive move from investors, particularly those holding short-term positions, as they strive to maintain the price above their purchase costs.
10/11/20249 min read
Introduce
In the current upward trend, price corrections remain shallow and consistent with previous growth cycles. This indicates similarities and sustainability in the current cycle, alongside strong support from investors.
The positioning and spending behavior of short-term investors have significantly improved as the spot price attempts to surpass the cost basis of $62,500. Sustaining levels above this threshold could reinforce confidence among investors and support the upward trend.
However, a substantial amount of futures contracts remains open, posing a risk of deleveraging and potential cascading liquidations if significant volatility occurs. This could lead to selling pressure and negatively impact the market.
With Bitcoin returning to $63,000 after the correction, the question arises whether this signifies a sign of sustainable recovery or merely a temporary bounce before facing further corrections.
Factors such as inflows from large institutions, macroeconomic conditions, and overall market sentiment will be crucial in determining Bitcoin's trajectory in the near future.
On-chain metrics
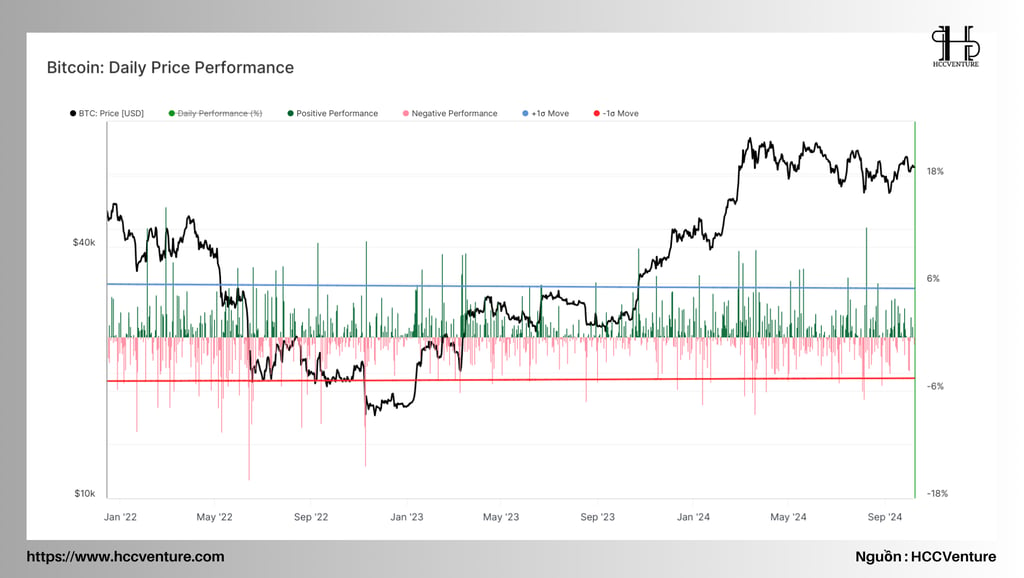
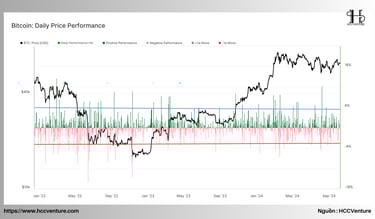
The Bitcoin market presents a unique feature with its deep liquidity, even during hours when traditional markets are closed. With the ability to trade across all time zones and regulatory environments, Bitcoin allows investors to express views, trade, and speculate at any given moment. This often leads to significant price volatility over the weekend, as traditional markets are halted and liquidity may be lower.
The recent drop to around $60,000 occurred over the weekend and was recorded as one of the deepest one-day sell-offs since the cycle low in 2022. This event resulted in considerable volatility and tested the market's resilience.
Despite typically lower trading volumes over the weekend, the market quickly recovered to finish the week at $63,500. This rebound demonstrates the potential strength of the Bitcoin market, particularly its capacity to withstand short-term shocks and maintain critical price thresholds.
Overall, this resilience not only reflects investor confidence but also highlights Bitcoin's unique positioning as a constantly accessible asset, capable of navigating and recovering from market fluctuations effectively.
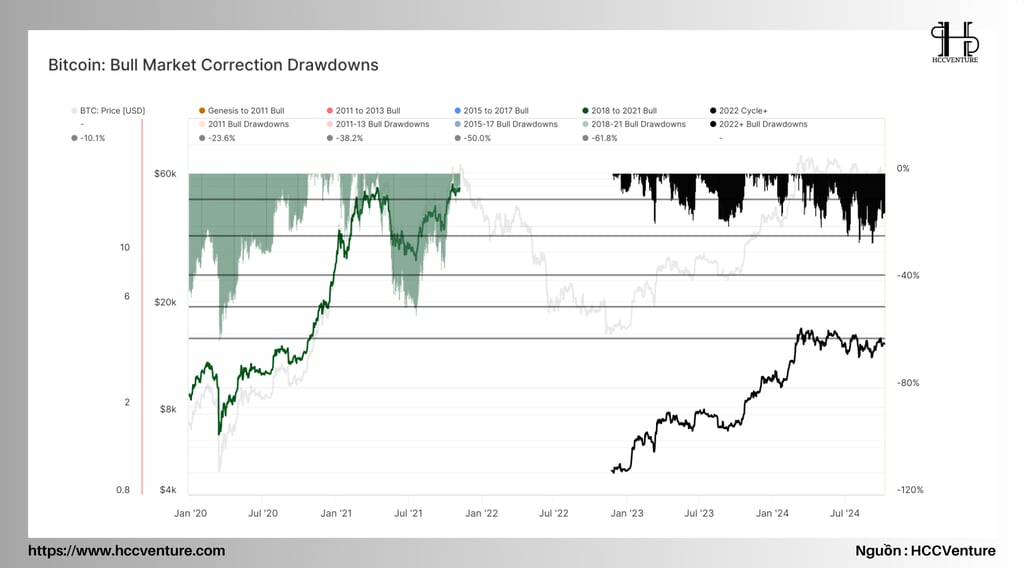
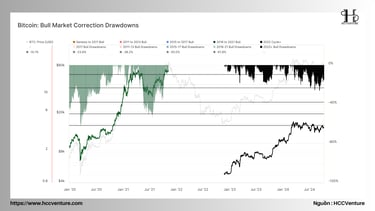
When assessing the depth of corrections from local peaks during bullish markets, the correction pattern observed in 2023-24 largely aligns with previous growth cycles, indicating a stable market model.
This period also showcases significant resilience from the demand side, with a maximum decline reaching -26% based on closing prices. This drop is relatively shallow compared to typical corrections in prior cycles, suggesting that investors maintain a strong buying interest even amid adjustments.
However, the past few months have marked the deepest phase of decline in this bullish cycle, highlighting it as one of the most challenging periods since the collapse of FTX at the end of 2022.
This situation indicates that, while demand remains strong, the market is currently facing increased pressures, potentially due to macroeconomic uncertainties or shifts in investor sentiment. These conditions underscore the market's resilience but also reveal its vulnerability to deeper corrections during periods of heightened volatility.
Investors should remain cautious and attentive to the evolving market landscape, as external factors could significantly influence future price movements and overall market stability.
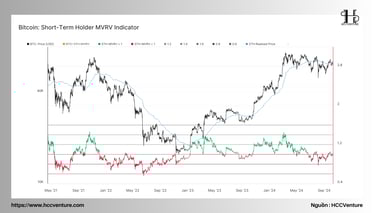
An important tool in on-chain analysis is the ability to assess the average cost basis of different investor groups. This provides insights into the financial pressures these groups face, as measured by unrealized gains or losses.
The Short-Term Holder group is particularly significant for understanding short-term price movements, as they are often viewed as a new source of demand in the market. Currently, the spot price has surpassed and maintained above the crucial cost basis level of $62,500, indicating a positive signal for recovery potential.
However, if the market fails to hold above this level, a large group of new investors may face increasing pressure, especially considering the challenging conditions of the past few months. A decline below this cost basis could trigger a panic selling mentality, as short-term investors may begin to reduce their risk exposure to avoid significant losses.
Maintaining the price above this threshold will be a key factor in sustaining growth momentum in the market amidst the current volatility. Investors will need to watch these price levels closely as they approach potential turning points in market sentiment and activity.
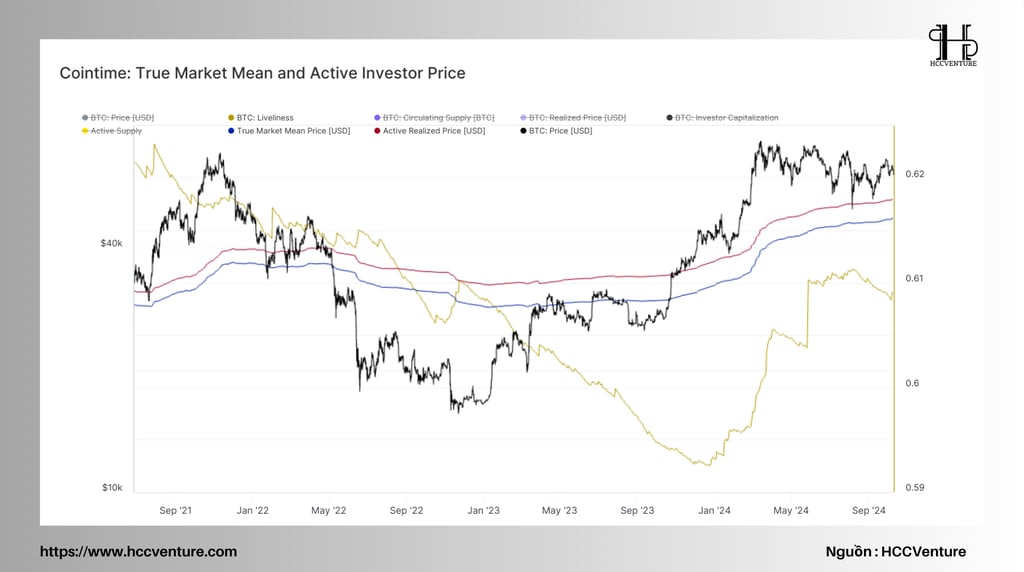
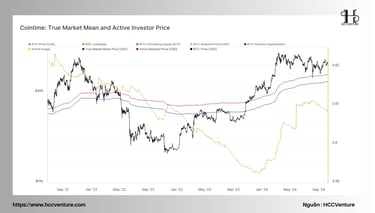
We can assess broader macroeconomic prospects by utilizing the Market Value (currently at $47,000) and Active Investor Price (currently at $52,500). Both of these metrics provide estimates of the average cost basis for active investors within the current cycle by excluding lost or long-dormant supply.
The position of the spot price relative to these two key levels can be viewed as a critical area delineating bullish (uptrend) and bearish (downtrend) markets. This year, the spot price has largely remained above both levels, with the exception of a brief dip below the Active Investor Price on August 5. This behavior suggests a relatively strong market, as these price levels tend to provide support during corrections, allowing demand to re-emerge in downturn periods.
The trend of maintaining prices above these levels indicates that investors are inclined to retain confidence in the market's recovery. Protecting these price thresholds could be crucial for sustaining macro growth momentum, while any decline below these levels may be a potential indicator of a deeper correction or the emergence of a long-term downtrend.
Overall, these price analyses offer valuable insights into market dynamics and investor sentiment, reinforcing the importance of monitoring key support and resistance levels as the market evolves.
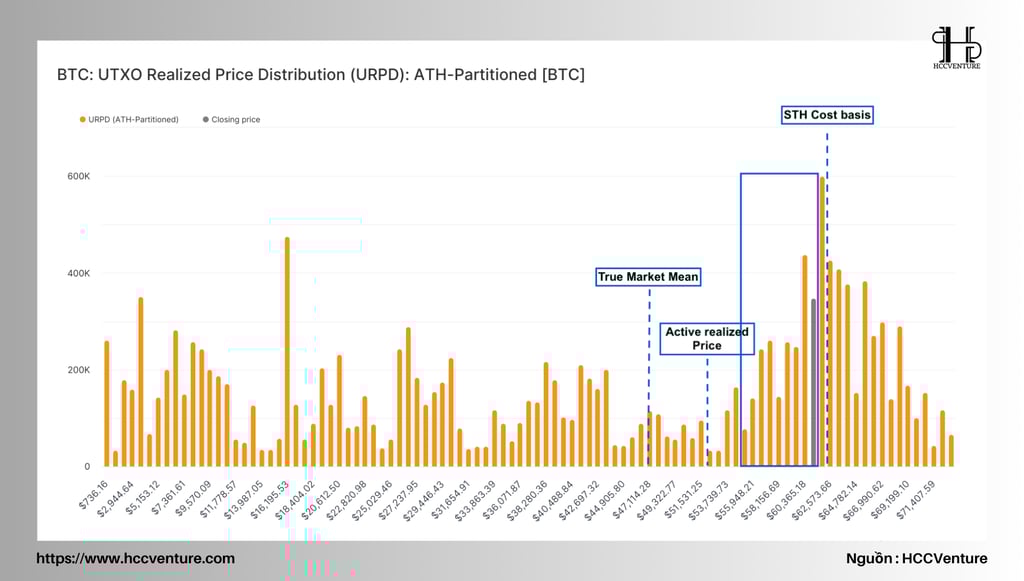
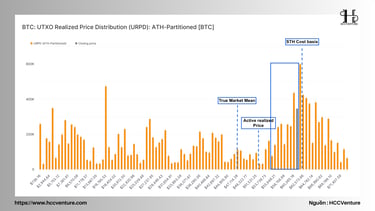
The Unspent Realized Price Distribution (URPD) index is an incredibly useful tool that helps us identify the current cost basis of the circulating coin supply. The spot price is currently within a large cluster of coins, indicating that small price fluctuations could significantly impact the profitability of a substantial number of investors.
Based on the URPD chart and the previously mentioned key price levels, several important observations can be drawn:
Cost Basis of Short-Term Holders (STH): The cost basis of short-term investors is located at the center of this dense coin cluster, emphasizing its crucial role in assessing short-term investor sentiment. This indicates that fluctuations around this price level could quickly alter the attitudes of recent investors.
Large Supply Clusters: Two other significant supply clusters exist at the Market Value and Active Investor Price levels, highlighting their importance as key support levels. If the price can maintain above these thresholds, the market could sustain a more positive sentiment and limit selling pressure.
Air Gaps: There are large gaps near these key price levels, where very few transactions have occurred—referred to as "air gaps." This suggests that in the event of a significant market downturn, these points could become areas of interest, where the risk of abrupt drops is elevated.
Overall, the current market is in a fragile state, with a large amount of supply likely to be sensitive to volatility. If substantial price movements occur, many investors may react strongly, resulting in swift changes to supply and demand dynamics. The market’s ability to hold above crucial price levels will be a key factor in maintaining stability in the near future.
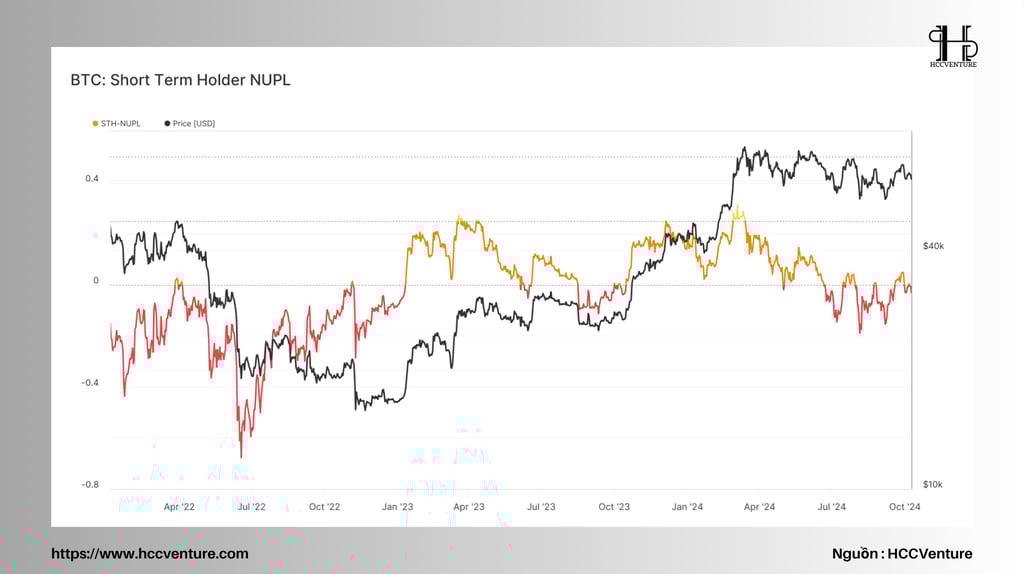
The Short-Term Holder group plays a crucial role in determining short-term price volatility. Monitoring the ratio of their supply that is in profit or loss can help identify positive or negative turning points in the market.
According to this metric, there is a clear dominance of profit among the short-term investor group, with the profit ratio reaching 1.2. Notably, this ratio has recently surpassed one standard deviation above the 90-day average, indicating an initial positive boost to investor sentiment. This outperformance may reflect increasing confidence, as short-term investors are witnessing profits from their positions.
This signal suggests that the market is likely to receive a positive impetus in the short term, as higher profits often encourage holding behavior and reinforce confidence in future price increases. However, it is crucial to monitor whether this profit ratio can remain elevated, as a sudden decline could reverse the recovery in market sentiment.
Overall, keeping an eye on the dynamics within the short-term holder group will be important for assessing potential price trends and understanding the broader market sentiment as conditions evolve.
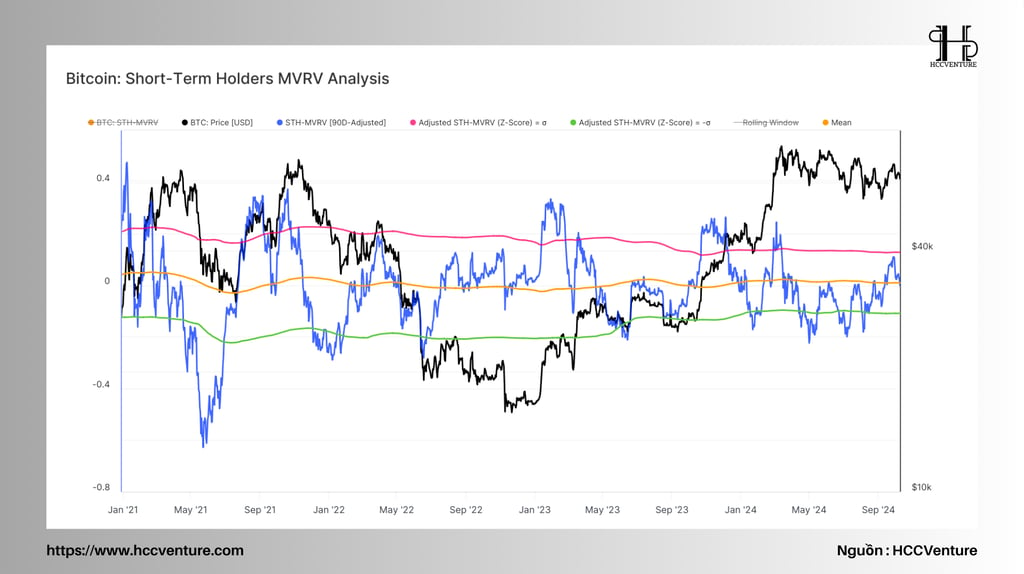
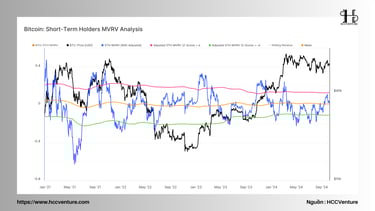
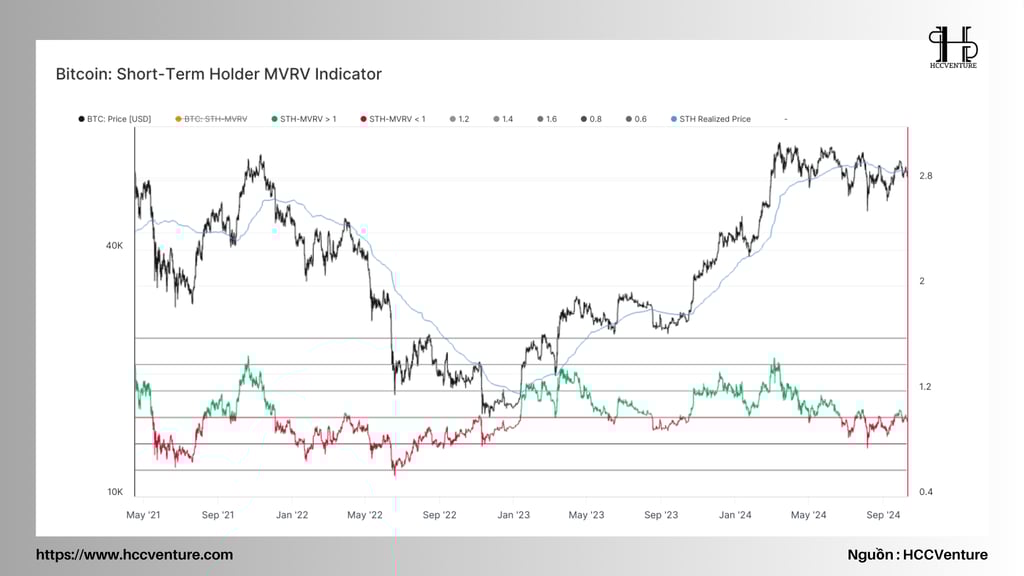
From the perspective of unrealized profit/loss among the Short-Term Holder (STH) group, we can employ a similar analytical framework using the STH-MVRV (Market Value to Realized Value) ratio. This tool measures the level of unrealized gains or losses that this group holds, averaged across all short-term investors.
Recently, there has been a notable improvement in the profitability of new investors, with the STH-MVRV ratio rebounding from lows experienced during the unwinding of yen-carry trades in early August. Notably, the STH-MVRV ratio has surpassed the 90-day moving average, providing another positive signal.
This recovery reflects the optimistic sentiment among short-term investors as their profits have improved following a challenging period. When the STH-MVRV ratio is above the long-term average, it typically indicates that many short-term investors are currently in a profitable position, thereby increasing the likelihood that the market will continue to sustain its upward momentum. However, for this trend to remain sustainable, the market must maintain MVRV levels above the average, helping to reinforce confidence and enhance profitability for short-term investors in the current cycle.
Overall, the behavior of the STH group, particularly in terms of MVRV, will be crucial for forecasting potential price movements and understanding broader market dynamics as conditions evolve.

Cryptocurrency Market Analysis
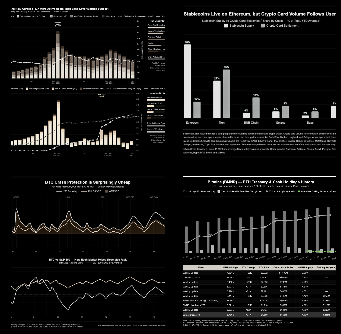
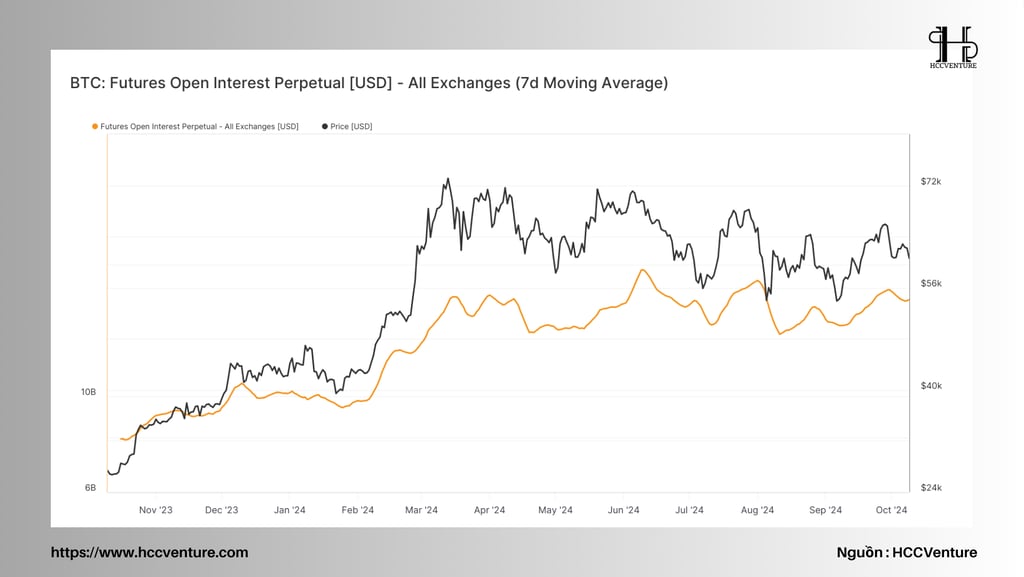
The emergence of derivative tools for Bitcoin has become a crucial part of the market structure, growing significantly in recent years. While daily-expiring futures contracts, particularly through CME Group, are on the rise, perpetual swaps remain the favored choice for traders and speculators in the cryptocurrency sector.
We can gauge the speculative activity of futures investors by assessing the total amount paid by the long side to the short side over the past seven days. At the historical peak (ATH) in March, leverage costs reached approximately $120 million per week. Since then, this figure has dropped to only $15.3 million per week, reflecting a decrease in buying speculation as the market stabilizes.
Despite the notable decline in bullish sentiment, the spread costs have increased again and surpassed the +1σ threshold. This indicates a potential return of speculative interest. When spread costs exceed this level, it may signal a rebound in speculative activity, with investors beginning to accept leverage risks in anticipation of potential growth trends. Monitoring this development can provide insights into shifts in market sentiment and potential new trend formations in the near future.
Conclusion and Assessment
Over the past month, short-term investors have reported significant improvements in profitability as the spot price recovered and exceeded their cost basis at $62,500. This has bolstered market sentiment, with the STH-MVRV ratio reaching 1.2, surpassing the 90-day moving average. These metrics indicate that the short-term investor group, crucial for short-term price direction, may support further price increases in the near future.
With the current spot price hovering around $63,000, the market is highly sensitive to fluctuations, especially as it is close to the cost basis of a significant portion of the circulating supply. Data from the URPD index indicates that most coins are clustered around this price range, particularly at the Market Value ($47,000) and Active Investor Price ($52,500). A decline in the spot price below these levels could trigger substantial sell pressure, as a majority of investors would be under financial stress.
Despite approximately $2.5 billion in contracts being forcefully closed during the recent price increase, total leverage costs have significantly decreased from $120 million to $15.3 million per week. This suggests that while bullish speculation has diminished, the market remains susceptible to sharp movements due to leverage and increasing speculative activity, as indicated by open interest recently surpassing +1σ.
Both the investment positioning and spending behavior of short-term investors have shown marked improvement in profitability over the past month as the spot price has recovered above their cost basis. However, given the fragile position of the current price relative to the cost basis of a large volume of circulating supply, this situation could create an advantage for buyers and help solidify bullish sentiment.
Nevertheless, speculative activity is showing signs of increasing in the futures market, with a substantial amount of open interest still maintained. In light of the unclear macro outlook for the market, it remains vulnerable to volatility. Pressures from deleveraging and potential liquidations could drive significant changes in either direction as investors look to adjust their positions in this sensitive and risky market environment.
Join the HCCVenture community to get the latest market information. Once again, we give our opinion on potential projects in the crypto market. This is not investment advice, consider your portfolio. Disclaimer: The views expressed in this article are solely those of the author and do not represent the platform in any way. This article is not intended to be a guide to making investment decisions.
API & Data : Glassnode
Compiled and analyzed by HCCVenture
Join our telegram community: HCCVenture
Explore HCCVenture group
HCCVenture © 2023. All rights reserved.


Connect with us
Popular content
Contact to us
E-mail : sp_contact@hccventure.com
Register : https://linktr.ee/holdcoincventure
Disclaimer: The information on this website is for informational purposes only and should not be considered investment advice. We are not responsible for any risks or losses arising from investment decisions based on the content here.
TERMS AND CONDITIONS • CUSTOMER PROTECTION POLICY
ANALYTICAL AND NEWS CONTENT IS COMPILED AND PROVIDED BY EXPERTS IN THE FIELD OF DIGITAL FINANCE AND BLOCKCHAIN BELONGING TO HCCVENTURE ORGANIZATION, INCLUDING OWNERSHIP OF THE CONTENT.
RESPONSIBLE FOR MANAGING ALL CONTENT AND ANALYSIS: HCCVENTURE FOUNDER - TRUONG MINH HUY
Read warnings about scams and phishing emails — REPORT A PROBLEM WITH OUR SITE.