

On-chain analysis week 41/2026: Bitcoin's mature structure
Bitcoin is operating within a market structure where selling pressure from groups of investors who bought at high prices continues to limit its breakout potential, while on-chain indicators suggest that the underlying support level remains intact.
PHÂN TÍCH
10/19/202614 min read


On-chain analysis week 41/2026: Bitcoin's mature structure
Bitcoin is operating within a market structure where selling pressure from groups of investors who bought at high prices continues to limit its breakout potential, while on-chain indicators suggest that the underlying support level remains intact.
Analysis • October 19, 2026


Market Summary
Bitcoin has yet to break above the cost basis of approximately $88,000 for those holding for 6-12 months and $100,000 for those holding for 1-2 years. These are areas where investors can take advantage of rallies to reduce their holdings as the price approaches break-even. Conversely, the price remains above the True Market Mean of around $78,000 and the average cost basis of spot Bitcoin ETFs in the US of around $81,500. The simultaneous existence of upper resistance and lower support levels suggests the market is testing the strength of demand, rather than having confirmed a new uptrend.
Regarding the quality of the recovery, the most noteworthy signal is not only Bitcoin holding its key price levels, but also the decline in loss-making activity and the shift towards profit-making. However, ETF inflows have returned to net selling after the improvement at the end of September. Therefore, the on-chain structure currently leans towards the possibility that the market is building a base, but still needs strong new demand to absorb the supply from investors who bought at high prices.
The cost structure by holding period shows that Bitcoin is under significant supply pressure from two groups of investors who bought in previous periods. Those holding for 6-12 months have an average cost of approximately $88,000, while those holding for 1-2 years have a cost of nearly $100,000. Bitcoin has maintained its daily closing price above the True Market Mean and Short-Term Holder Cost Basis since September 18th. Regarding the ETF cost, the market briefly broke below it on October 8th and 13th, but closed back above it. According to reports, daily closing prices since September 21st have remained above the ETF cost of $81,500.
At the bottom in June 2026, the amount of Bitcoin spent at a loss was approximately 12 times higher than the amount spent at a profit. By the end of August, the balance had reversed. The most recent data in the report shows that the amount of coins spent at a profit reached approximately 4 coins for every 1 coin spent at a loss, meaning the ratio between the two groups has changed dramatically compared to the bottom.
Analyzing on-chain metrics
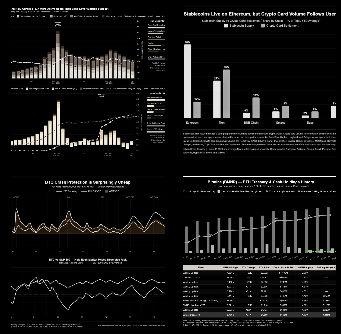
Days Since Last All-Time High (ATH) measures the number of days Bitcoin has passed since its last all-time high price. According to the HCCVenture chart, at the time of recording, Bitcoin has experienced 374 days since its last ATH. Recent cycles have shown that Bitcoin's periods of inability to surpass ATHs typically last from several months to several years, but the duration of each cycle is not fixed.


Historical data shows that the time between major Bitcoin all-time highs (ATHs) varies significantly. The December 2017 cycle peak was surpassed in December 2020, meaning it took approximately 1,079 days for the closing price to return above that previous peak according to historical data. After the November 2021 ATH, Bitcoin took approximately 846 days to surpass the peak with a closing price in March 2024. Notably, after the March 2024 ATH, the market only took about 571 days to set a new high in October 2025.
With 374 days since its all-time high (ATH), the current cycle is still relatively early compared to the entire time it took for Bitcoin to surpass its past historical peaks. However, this timeframe cannot be used in isolation to infer the timing of a recovery. A cycle could form a bottom before completing a year of correction, or continue to accumulate for a longer period if capital flows and macroeconomic conditions are not favorable.


The Bitcoin Price and the Nasdaq Composite Index Correlation reflects the degree of correlation between Bitcoin and the Nasdaq Composite index, thereby helping to assess the sensitivity of BTC to changes in risk appetite in traditional financial markets. The Nasdaq Composite has a large weighting of technology and growth companies, so its performance is often influenced by expectations of rising interest rates, liquidity, corporate earnings, and asset valuations.
The HCCVenture chart records the period from approximately October 2025 to October 2026, including the price of Bitcoin, the Nasdaq Composite, and the correlation coefficient. A notable feature is that the correlation is not stable but fluctuates sharply, experiencing periods of high correlation during some upward movements, declining to near zero or even into negative territory when the two assets performed differently, and then recovering towards the end of the chart.
Considering the entire period shown, Bitcoin underwent a correction from above $120,000 to below $60,000 before recovering to around $80,000-$86,000. Meanwhile, the Nasdaq maintained a significantly higher price level compared to the beginning of the data series. The difference in volatility suggests that while the two assets may move in tandem, Bitcoin possesses its own greater volatility characteristics due to its continuous market activity, high leverage, and different liquidity structure compared to traditional stock markets.
However, correlation indicators are not direct valuation metrics and do not determine the future direction of Bitcoin. The correlation coefficient only indicates the degree to which two chains move in the same direction over a given period. It does not prove that Nasdaq is causing BTC volatility, nor can it determine whether an asset is overvalued or undervalued. However, the current correlation level is still below its peak on the chart and is not yet sufficient to conclude that Bitcoin has fully become an asset reflecting the performance of technology stocks.


The Bitcoin Perpetual Market Pressure Index chart from September 16th to October 15th shows that market pressure went through three distinct phases: a sharp increase in an upward direction in the latter half of September, maintaining a relatively positive zone at the beginning of October, and then significantly weakening in the final sessions. The current price structure reflects a decline in momentum after the strong upward movement, while the pressure indicator has not yet shown a clear enough recovery to confirm that buying pressure has returned to dominance.
Although prices recovered in subsequent sessions and approached $84,000 around October 12th, the pressure indicator did not return to its previous peak. By the end of the chart, the 30-day SMA had fallen to around 40%, near the level marked as a bearish pressure zone. This signals that buying momentum in the futures market has weakened significantly compared to the beginning of October.
This shift indicates that the index has not yet returned to its weakest point at the beginning of the period, but it also no longer maintains the buying momentum that supported the rally at the end of September. In other words, the futures market is moving from a state of strong buying pressure to a weaker equilibrium, where buying power is no longer dominant enough to sustain a short-term uptrend.


Historical Bitcoin Percent Supply in Profit data from HCCVenture shows that during bear market bottoms, the percentage of profitable Bitcoin supply typically drops to around 40-45%, a pattern seen in previous downturns where more than half of the supply fell into a loss-making state. During the June 2022 sell-off, the index also fell to nearly 50%, reflecting strong correction pressure and a redistribution of supply.
However, the 68.8% level is still significantly lower than the 90-100% range seen during periods of strong bull markets. During times when Bitcoin approaches the peak of its cycle, a large portion of the supply has a cost basis lower than the market price, resulting in very high profit margins. Therefore, the current index is somewhere between two extremes: it has recovered significantly from the bottom, but has not yet returned to the widespread profit margins typically seen when prices approach historical highs.
As the proportion of profitable supply increases from low levels, the forced selling pressure due to losses may gradually decrease. However, as the index moves to higher levels, the amount of profitable supply also increases, creating conditions for increased profit-taking if prices encounter resistance. Therefore, the improvement of the index is a positive signal regarding the profitable state, but it does not automatically mean that prices will continue to rise.


The Bitcoin NVT Price Model currently reflects a cooling valuation compared to the periods of strong upward movement in the previous cycle, but without extreme negative signals similar to some historical lows. The NVT Z-Score is around -0.3, below the central reference level, while the 28-day NVT Price is around $35,000-$37,000, significantly lower than the BTC price of approximately $85,000. This suggests that the market price is still trading above the reference level from the NVT model, rather than being in a clearly undervalued state.
In the coming period, it is necessary to closely monitor the movement of the NVT Z-Score and the rate of change of the NVT Price relative to the BTC price. If the price continues to rise while the NVT Z-Score and NVT Price do not recover correspondingly, the gap between market valuation and network trading activity may continue to widen, increasing the need to verify the sustainability of the upward momentum. Conversely, a simultaneous recovery of on-chain trading activity and the NVT price curve would further strengthen the argument that the platform using the network is catching up with market valuation.


Hashrate Drawdown is an indicator reflecting the percentage decrease in hashrate compared to its previous peak. When the indicator moves deeper into negative territory, it suggests that the network's computing power has significantly decreased from its peak; when the indicator returns to near 0%, the hashrate is recovering and approaching its peak. This indicator does not necessarily reflect the rate of miners leaving the network, as hashrate can fluctuate due to equipment performance, operating conditions, electricity prices, and the distribution of mining power.
According to HCCVenture's chart, the Hashrate Drawdown decreased from near 0% at the end of 2025 to an estimated low of around -18% in August 2026, the deepest decline during the period shown, reflecting significant pressure on the network's computing capacity. After hitting this low, the index began to recover in September and October 2026, with an estimated end-of-period drawdown of around -9% to -10%. Thus, the decline narrowed by approximately 8-9 percentage points from the most recent low, indicating that the hashrate recovery is underway but not yet complete.
However, both hashrate and difficulty remain significantly lower than their peaks at the end of 2025. This suggests that the recovery of mining infrastructure is not yet complete, even though Bitcoin's price has recovered from its mid-year lows. In the short term, the key indicator to watch is whether True Hashrate continues to rise and Hashrate Drawdown approaches 0%. If hashrate maintains its recovery momentum while difficulty gradually increases, this would be further evidence that mining capacity is being re-established on a large scale.


Research and Analysis
Market Summary
Analyzing on-chain metrics
Days Since Last All-Time High (ATH)
Bitcoin Price and the Nasdaq Composite Index Correlation
Bitcoin Perpetual Market Pressure Index
Bitcoin Percent Supply in Profit
Bitcoin N/A Price Model
Hashrate Drawdown
Bitcoin Drawdown
Bitcoin Daily Miner Revenue and Network Hashrate
Assessment and Conclusion
Following the surges in 2024-2025, the 30-day CDD (Continuing Value of Deposit) declined significantly in 2026. On the chart, the indicator at times retreated to the 200-300 million coin-days range, much lower than the historical peaks exceeding 1 billion coin-days. This represents a relatively low activity level in recent observations, suggesting that the rate of coin-days destruction has slowed compared to periods of significant long-term BTC movement.
Although CDD has recovered from its 2026 lows, the index remains significantly lower than its peaks exceeding 1 billion coin-days. This suggests that long-term asset movement has resumed but has not yet reached the extreme levels of previous periods. There is insufficient evidence from this chart alone to conclude that long-term investors are widely distributing BTC or are shifting to more aggressive accumulation.
The main indicator is that long-standing BTC trading activity has recovered from its recent lows but has not yet reached the extreme levels of previous cycles. This provides a basis for monitoring changes in the behavior of long-accumulated supply, but it is not enough to confirm a widespread distribution or accumulation trend. In the near future, if CDD continues to rise sharply and simultaneously sees an influx of BTC onto exchanges with high realized profits, evidence of profit-taking pressure will become clearer. Conversely, if CDD remains moderate and the inflow of funds onto exchanges does not increase proportionally, the impact of trading activity on the supply of sell-offs may be more limited.


The current Bitcoin drawdown reflects a recovery phase following the deep correction in 2026. The lowest drawdown of the fourth cycle approaches -50%, while the end of the chart narrowed to around -30% to -40%. Compared to the historical low of approximately -85% to -90% in the first cycle, the current drawdown has not reached the same extreme depth. However, compared to the historically high -25% threshold, the current drawdown still indicates a significant risk of further correction.
The gap between the current drawdown and the nearest low suggests the market has partially recovered, but the accumulated decline from the peak remains significant, a crucial factor in assessing portfolio risk: an asset may rebound strongly from a short-term low but still be far from its previous peak. Therefore, focusing solely on the percentage increase from the low can easily lead to an overestimation of the recovery without considering the remaining drawdown.


Bitcoin mining activity is recovering from its mid-2026 lows, evidenced by improvements in both revenue and hashrate. However, revenue remains below the late 2025 highs, and computing power has not yet returned to its peak, suggesting the recovery is not yet complete. In the next phase, it's crucial to monitor whether revenue continues to increase and hashrate sustains its recovery; simultaneously, data on hashprice, mining difficulty, and operating costs need to be combined to assess whether the revenue improvement translates into sustainable profitability for miners.
Revenue and hashrate both weakened during certain periods, particularly from late 2025 to mid-2026, before showing signs of recovery towards the end of the period. However, the two curves are not entirely identical. Revenue can change rapidly with BTC price and transaction fees, while hashrate reflects miners' power operating decisions and typically adjusts to economic conditions over a longer period.
The period around June 2026 clearly shows pressure on mining operations, with revenue decreasing to approximately $22-25 million per day, while hashrate remains low compared to its peak at the end of 2025. As revenue declines without corresponding adjustments to operating costs, some miners may reduce capacity or temporarily shut down low-efficiency equipment. However, the chart lacks sufficient data to accurately determine how much hashrate leaves the network due to profitability issues, and it cannot separate the impact of BTC price, transaction fees, and operational factors.
Our assessment and conclusions
The price of BTC has recovered from its recent lows and is holding around the $80,000-$85,000 range at the end of the analyzed charts. However, this price recovery has not been accompanied by a complete consensus signal from network valuation indicators, long-term investor activity, and the economic efficiency of mining operations.
Bitcoin Drawdown data shows the deepest correction of the current cycle approaching -50%, lower in depth than the early cycles which recorded drawdowns of around -85% to -90%. Although the drawdown has narrowed from the most recent low, the price of Bitcoin has not yet fully returned to its reference peak. This reflects a partial recovery, but not enough to confirm that the price structure has shifted to a stable long-term uptrend.
From a network performance perspective, True Hashrate recovered from its estimated low of 890-910 EH/s to approximately 96-980 EH/s; Hashrate Drawdown narrowed from around -18% to -9%-10%; Mining Difficulty also increased from 127-130T to approximately 132-34T. For the Miner Profit/Loss Sustainability index, the chart shows a shift from a deep negative range of around -35 to -40 in June 2026 to high positive levels in August-September. However, the index continued to fluctuate sharply around the zero line at the end of the period. Since the normalized formula of the index has not been fully determined from the chart, these levels cannot be interpreted as actual profit margins for miners.
Therefore, the appropriate analytical approach at this time is to prioritize confirming the quality of the recovery momentum rather than assuming the price has bottomed out in the long term. The price of BTC needs to be evaluated in conjunction with improvements in on-chain activity, the sustainability of mining revenue, and supply dynamics from long-term holders. While the indicators are not yet clearly concurring, concluding with certainty that Bitcoin is either overvalued or has the potential for undervaluation is beyond the available evidence.
Disclaimer
This report was prepared by HCCVenture Research with the aim of providing information, research, and market analysis. The entire content of the report is based on publicly available data, on-chain data, market data, venture capital (Venture Capital) data, macroeconomic data, and HCCVenture's internal research methodologies at the time of publication. Data sources are compiled from numerous reputable research platforms and organizations, including but not limited to Glassnode, CoinGecko, TradingView, Dune Analytics, CoinGlass, CryptoRank, RootData, PitchBook, DefiLlama, CryptoQuant, Messari, Token Terminal, Artemis, CoinMarketCap , public blockchain data, reports from financial institutions, investment funds, blockchain companies, and other publicly available information sources. HCCVenture strives to select reliable data sources and applies a verification and cross-checking process throughout its research. However, HCCVenture does not guarantee the completeness, accuracy, timeliness, or error-free nature of all data due to differences in statistical methods, data collection scope, update times, or adjustments from data providers.
All opinions, assessments, valuation models, cyclical analysis, on-chain data, capital flow analysis, Venture Capital activity, ETFs, Digital Asset Treasury Companies (DATs), technical indicators, macroeconomic indicators, and scenarios presented in this report reflect only the research views of HCCVenture Research at the time of publication, based on available assumptions and data. These contents are not investment advice, financial advice, legal advice, accounting advice, tax advice, brokerage advice, portfolio management advice, or recommendations to buy, sell, or hold any digital asset, security, financial product, investment fund, blockchain protocol, or business. The digital asset and blockchain markets are highly volatile and are influenced by global liquidity, monetary policy, regulatory regulations, macroeconomic conditions, and many other unpredictable factors. Therefore, the trends, patterns, correlations, or historical cycles mentioned in this report are not guaranteed to repeat in the future and should not be considered reliable predictions of market developments. Readers should conduct their own independent research ( DYOR – Do Your Own Research ) and consult with qualified financial, legal, tax, or investment professionals before making any decisions. Any investment decisions or actions arising from the use of information in this report are the sole responsibility of the reader.
HCCVenture, its affiliates, research team, personnel, or related parties may own or will own digital assets, invest in blockchain projects, investment funds, technology companies, or maintain commercial, research, media, consulting, or collaborative relationships with the organizations, protocols, businesses, or platforms mentioned in this report. These relationships may create actual or potential conflicts of interest, although HCCVenture always applies internal research standards to maintain objectivity and independence in its analysis. Nothing in this report is construed as an offering, brokerage, promotion, fundraising, or provision of investment services as regulated by any country or territory. The entire content of this report is protected under intellectual property and copyright law. It is strictly prohibited to copy, modify, reproduce, distribute, or use all or part of this report for commercial purposes in any form without the written consent of HCCVenture. Accessing, using, or quoting this report signifies that the reader has understood, accepted, and agreed to the entire content of this disclaimer.
Explore HCCVenture group
HCCVENTURE QUANT JSCO
© 2026 HCCVENTURE. ALL COPYRIGHTS RESERVED.


Connect with us
Popular content
Contact to us
Address: 8th Floor, Bach Dang Complex Building, 50 Bach Dang Street, Hai Chau Ward, Da Nang City, Vietnam.
Phone: 1900 1509
Gmail : sp_contact@hccventure.com
Disclaimer: The information on this website is for informational purposes only and should not be considered investment advice. We are not responsible for any risks or losses arising from investment decisions based on the content here.
TERMS AND CONDITIONS • CUSTOMER PROTECTION POLICY
ANALYTICAL AND NEWS CONTENT IS COMPILED AND PROVIDED BY EXPERTS IN THE FIELD OF DIGITAL FINANCE AND BLOCKCHAIN BELONGING TO HCCVENTURE ORGANIZATION, INCLUDING OWNERSHIP OF THE CONTENT.
RESPONSIBLE FOR MANAGING ALL CONTENT AND ANALYSIS: HCCVENTURE FOUNDER - TRUONG MINH HUY
Read warnings about scams and phishing emails — REPORT A PROBLEM WITH OUR SITE.