


On-chain analysis week 41/2025: Repositioning or bad prognosis for Ethereum
Ethereum is entering a particularly important phase in the development of the ecosystem. After a short correction in Q2/2025, the Ethereum network has shown a strong recovery.
10/13/202512 min read
Summary of the situation
From a technical perspective, major upgrades such as Dencun and Pectra have made fundamental progress in improving network performance. The implementation of EIP-4844 (blob transaction) significantly reduces data costs for Layer-2 networks, while stabilizing L1 operations through dynamic charging mechanisms.
At the same time, optimizing the fee market and staking yield is forming a more balanced economic structure, where burn rates and staking rewards interact closely to maintain high network security while ensuring a gradually shrinking ETH supply.
Total Supply in Loss has hit its lowest low since 2022 – a signal that the correction is almost complete. From an investor behavior perspective, HODL Cave and URPD (UTXO Realized Price Distribution) both show high accumulation density in the $4.1–4.6k cost price area, while the upper $4.8k area is almost empty of liquidity.
Fee Ratio Multiple (FRM) and Burn Rate (Base Fee) are meaningful. FRM continues to stay above the 10–12x range, showing a high level of fee income relative to network security value, while the burn remains steady, although not as explosive as during DeFi Summer.
Net Realized Profit/Loss has moved from a negative to a stable positive oscillation since Q2/2025, demonstrating that new capital is absorbing profit-taking without causing strong downward pressure on prices, “ redistribution ” cycles – when long-term holders start to distribute a small portion, while new investors absorb with medium- to long-term expectations.
Analyzing on-chain metrics
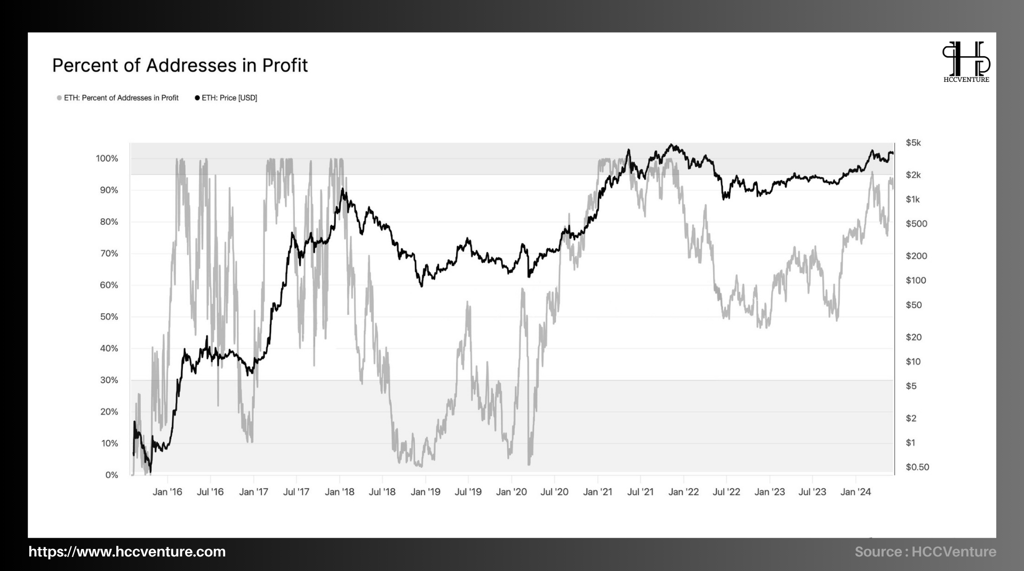
The percentage of addresses in profit is one of the most reliable measures of trend “ breadth ” on the Ethereum blockchain. The more addresses in profit, the higher the likelihood of a sustainable price base forming as forced selling pressure decreases.
The latest data shows that the majority of investors have recovered profits, in line with record network usage and a thickening security base (thermocap, staking). Combined with the post-EIP-4844 fee structure and institutional capital inflows, this indicator is confirming a broad revaluation cycle , strengthening ETH's bullish outlook in the medium-long term.
Observation shows profitable addresses near historical maximum:
The Percent of Addresses in Profit is currently around ~97% – the highest level since the 2021 peak. This number reflects the profit margin that has spread almost across the network , instead of being concentrated in just a few investor clusters.
Spot prices have been hovering around $4.5–4.7k over the past week, fitting the “broad but not overheated” picture.
The 2018–2020 exhaustion bottom saw only ~2.8% of addresses remaining profitable , highlighting the cycle reversal from extreme pessimism to the current bullish envelope.
With ~97% of addresses in profit , ETH price around $4.5–4.7k , usage and security steadily increasing, Ethereum is in a rebalancing phase and preparing for an extended uptrend . Only when the percentage of profitable addresses rapidly declines to <85% will there be a risk of a large-scale distribution.
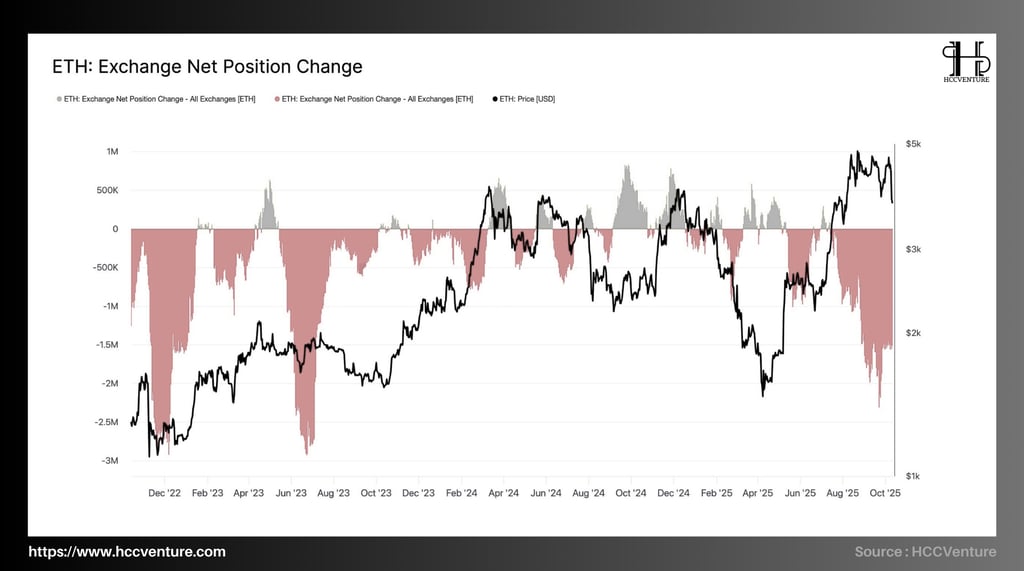
Ethereum’s Exchange Net Position Change (ENPC) – which measures the 30-day net flow between exchange and off-exchange wallets – is recording a very strong net withdrawal trend , while ETH price remains in a high zone ( ~4.5–4.8k USD ). The current net withdrawal intensity is approaching historical extremes , confirming the supply-demand structure on exchanges . When assessing the overall:
Negative data indicates a net outflow as the free-float supply on the exchange decreases .
When the data is positive, it signals net buying and potential selling pressure increases .
Currently (Q4/2025), the 30-day ENPC band is deeply negative , around ~-2.2 to -2.7 million ETH/30D – the thickest and longest net withdrawal since the beginning of the year, in line with the price breakout to a new peak.
The end of 2022 recorded about -2.8 to -3.0 million ETH/30D (system panic bottom). The key difference is that the price dropped deeply at that time , while the current high price is stable , showing that the net withdrawal motive is long-term accumulation/holding , not withdrawal due to concerns about floor risks.
Supply absorption mechanism but net capital withdrawal is creating pressure:
~ 30% of total supply is staked, narrowing free-float ; staking rewards are recycled into contracts/DeFi instead of being put on exchanges.
The proportion of ETH held in wallets with very low spending histories continues to increase , consistent with the persistent negative ENPC.
Record absolute gas (~1.6×10¹¹ gas/day) and large contribution from DeFi/stablecoin/infrastructure shows ETH is used and held in smart contracts, not returned to exchanges.
Fees/FRM after EIP-4844, unit cost reduced, L2 ecosystem expanded → operating volume increased but no fee shock , helping investors prioritize holding .
The persistent negative ENPC indicates that investor confidence in accumulation remains overwhelming. This flow is paralleled by high gas usage and a steady increase in Thermocap , reflecting substantial network expansion rather than short-term speculation.
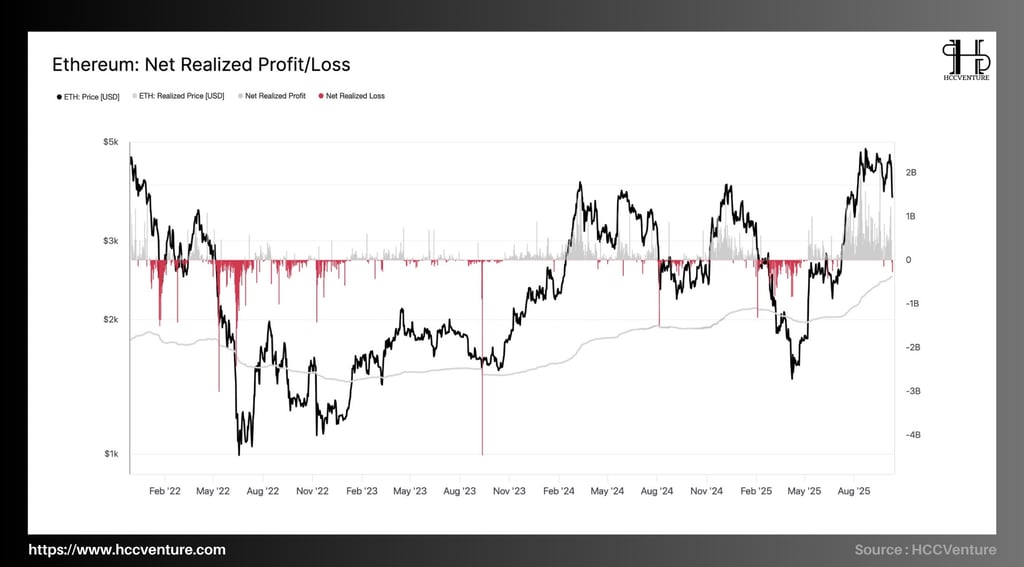
Net Realized Profit/Loss (NRPL) is one of the core tools in analyzing the macro behavior of Ethereum investors, reflecting the actual profit or loss flow recorded on the chain . Different from the market price, this index shows the level of profit-taking or loss-cutting of the entire network at a specific time, thereby helping to determine the psychological state – accumulation or distribution – of investors.
As of mid-October 2025, Ethereum’s price remained around $4,500–$4,800 , while the Realized Price – the average cost at which the last ETH coins moved – was only around $2,300 , representing an average realized profit margin of nearly 100% . This is the highest level since early 2021, showing that the majority of investors are in a net profit.
NRPL shows that realized profits almost completely overwhelm the red (realized losses) throughout Q3 and early Q4/2025. The recorded profit volume reaches an average of 1.2–1.5 billion USD/day , compared to previous deep corrections (late 2022 and mid-2024) when the market had to record net losses of over -2.5 to -3.5 billion USD/day .
Notably, the ETH price line has now remained above the Realized Price for more than 15 consecutive months – a long bullish cycle rarely seen in Ethereum’s history. From a quantitative perspective, when the price remains above this line, the network is typically in a controlled accumulation – expansion – profit-taking phase , reflecting the overall financial health of on-chain investors .
The shift from “realized loss” to “steady realized gain” also means that the speculative ETH supply has been fully absorbed . Short-term investors (STH) are currently recording an average return of around 25–30% , but the majority are still holding. Meanwhile, long-term investors (LTH) continue to accumulate, with an LTH-NUPL of ~0.5 , indicating high confidence but not yet in the extreme euphoria zone.
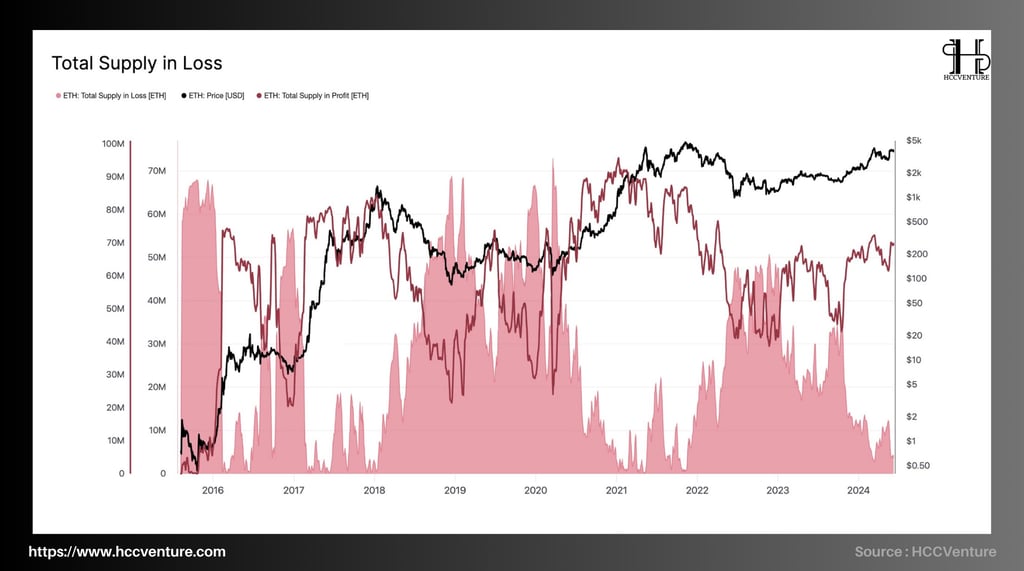
Total Supply in Loss measures the total amount of ETH that is priced higher than the current price. This is an indicator of the “depth” of potential selling pressure. The lower the “depth”, the smaller the overhang and the stronger the underlying trend.
ETH's profitable supply ratio is currently at ~96–97% (7DMA, updated to 10/09/2025). This means that the supply in the hole is only ~3–4% of the total circulating supply. Of which, the total circulating ETH supply is currently around 120.7 million, resulting in ~3.6–4.8 million ETH being “negative” compared to cost price (estimated by percentage above).
Total Supply in Loss has contracted to cycle lows , while prices remain elevated—a configuration that only occurs when holding demand prevails. During historical bottoms (2018–2020; early 2023), the fraction of supply in profit fell very low, implying that the majority of supply was in a loss . In contrast, the current timeline on the same dataset shows the fraction in profit approaching its maximum , causing Total Supply in Loss to contract to its minimum margin. This means:
Forced selling pressure decreased sharply (few addresses had to sell).
Increased trust thickness (unrealized profits are retained instead of being released immediately).
Any positive marginal flows (spot ETFs, DeFi/L2 demand) have large price pass-through due to thin free-float.
Ethereum Total Supply in Loss is at a cycle bottom (only ~3–4% of total supply, or ~3.6–4.8 million ETH). With structural selling pressure weakening as it is now, while price remains anchored high and on-chain demand remains at record levels, the base case for the coming period is continued accumulation at high levels and then an extended uptrend .
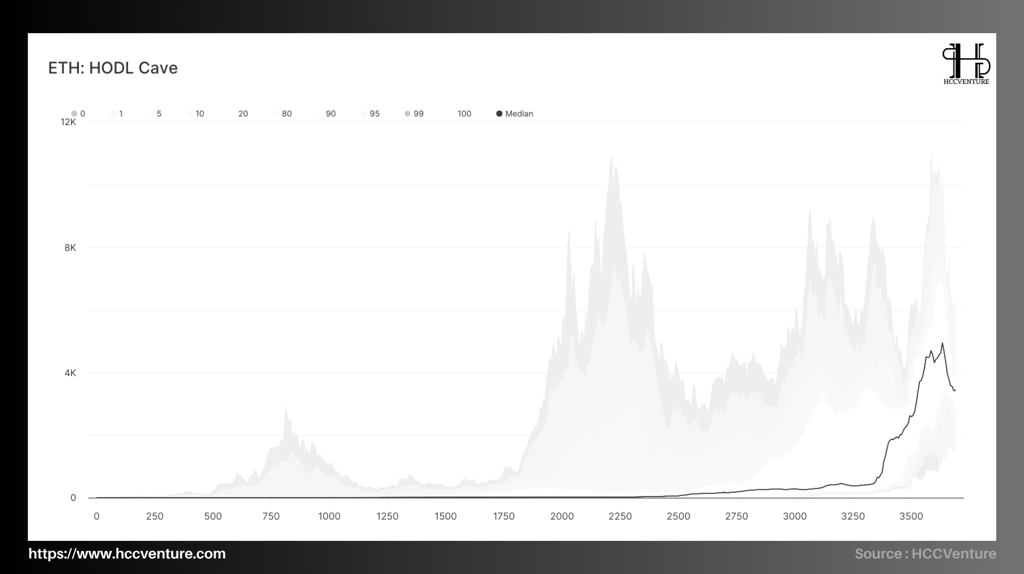

HODL Cave is an age distribution that shows how much ETH is “sleeping” over a period of time. Unlike price, which is cyclical, HODL Cave measures a thickening of the underlying supply structure, a reduction in mechanical selling pressure, and a more sustained price increase. The updated data shows that Ethereum’s long-term supply has increased to a cycle high, in tandem with record staking and network usage.
In the $4,500–$4,800 price range, Ethereum is maintaining a remarkable level of stability with staking supply accounting for around 30% of the total supply – reflecting the long-term confidence of investors that has not decreased compared to the previous quarter. Notably, the “old” supply (≥1 year) accounts for 60–65%, while the “very old” supply (≥2 years) reaches around 40%, and the ≥3 year group still maintains 25–28% of the total supply.
The steady increase in these age bands, together with the upward trend in the median coin age from mid-2024, confirms that the supply rotation in the market is slowing down significantly: the majority of ETH is now in staking, DeFi contracts or infrastructure structures, no longer circulating heavily through exchanges.
In historical terms, this structure is in stark contrast to the 2018–2020 exhaustion period, when short-term holders (≤3–6 months) dominated and supply continued to rotate to cut losses. Currently, the long-term band (≥1 year) dominates, while the short-term band only expands temporarily when breaking the top and then quickly contracts.
This is a structural signal – demonstrating that the “capitulation” cycle has completely ended and the network is entering an “active holding” phase, where investors act based on long-term conviction rather than short-term reactions to price movements.
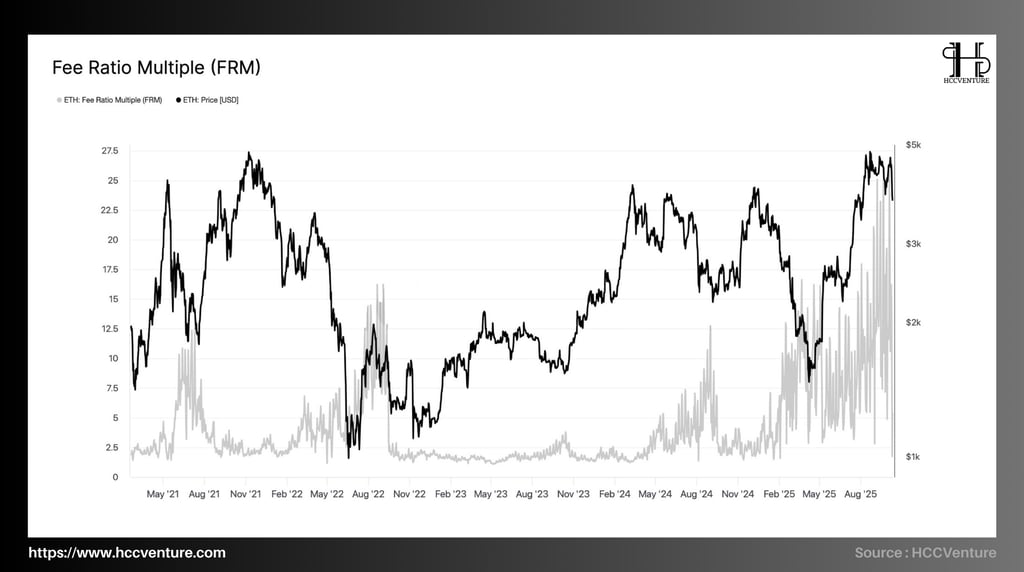

Fee Ratio Multiple (FRM) – the ratio between security spending (issuance + validator fees) and L1 fees – is holding at historically high levels of ~20–25 with ETH trading around $4.5–4.8k . The high but stable FRM level confirms that the network is not reliant on L1 “fee shocks” to maintain valuation; security spending is well funded by staking + consolidation fees (L1 + blob/L2) . The current configuration suggests healthy accumulation on top , not distribution.
Low FRMs typically occur when L1 fees are explosive (e.g., 2021 peaks), implying euphoric risk. Conversely, high FRMs reflect a low share of L1 fees in total security spend ; post The Merge and EIP-4844, this is the new normal as activity shifts to L2/blobs , making unit costs for users cheaper but consolidated security revenue resilient.
Currently, in the fourth quarter of 2025, Ethereum's Fee Ratio Multiple (FRM) fluctuates around 20-25 , even surpassing 25 in many sessions , while ETH price remains stable in the $4,500-$4,800 range . This is a structure that represents a sustainable balance between network performance and fee pressure - a rare factor in previous cycles. If compared to the peak in 2021, when ETH price reached ATH but FRM dropped sharply to a low zone due to congestion and a spike in L1 transaction fees, it can be seen that the quality of the current bull cycle is much better. At that time, low FRM reflected system overload - speculative demand overwhelmed real demand, creating a short-term peak of excitement.
FRM remains high and shrinks slightly to the average zone as on-chain activity continues to expand (merge fees increase moderately). This is a bullish continuation pattern after accumulation . The signal to be cautious is only when FRM falls rapidly with L1 fees exploding and MVRV/NUPL entering extremes , then there will be a risk of a similar 2021 cycle distribution .
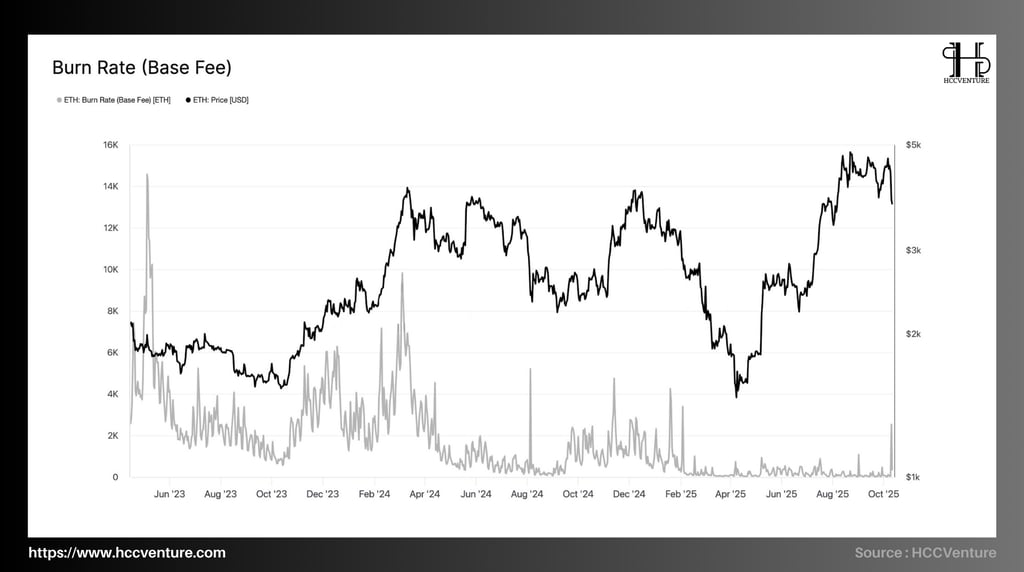
Burn Rate (Base Fee) measures the amount of ETH burned per day according to EIP-1559 (base fee per transaction). The latest update shows that the burn rate is at a very low historical level after scaling upgrades (EIP-4844/Dencun, Pectra).
On October 4, 2025 , daily burn bottomed out at ~21 ETH – the lowest since EIP-1559 was implemented; while the historical peak was ~71,718 ETH/day on May 1, 2022. Cumulative burn exceeded ~5.3 million ETH since the London fork.
EIP-1559 separates fees into base fee (burned) and priority fee (tip for validator) ; thus Burn Rate reflects the “supply-suction” pressure according to network activity . After EIP-4844/Dencun and Pectra , data is moved to blob with its own fee mechanism in 1559 style; the sharp increase in blob/block capacity causes the unit cost for rollup to drop sharply , pulling the base fee on L1 to a very low level.
Low L1 fees (small base fee) does not mean weak demand; in fact, Ethereum's absolute usage volume is growing strongly thanks to L2/Blob, while consolidated security revenue (staking + fees) remains strong. (ref: EIP-4844/Pectra expands blob capacity).
As the network becomes congested, the base fee increases, pushing up the Burn Rate (which has been >70k ETH/day), rapidly shifting the supply balance to net deflation in the short term. The current low fee environment sets the stage for user expansion , creating room for a “demand-driven” fee burn cycle when activity explodes.
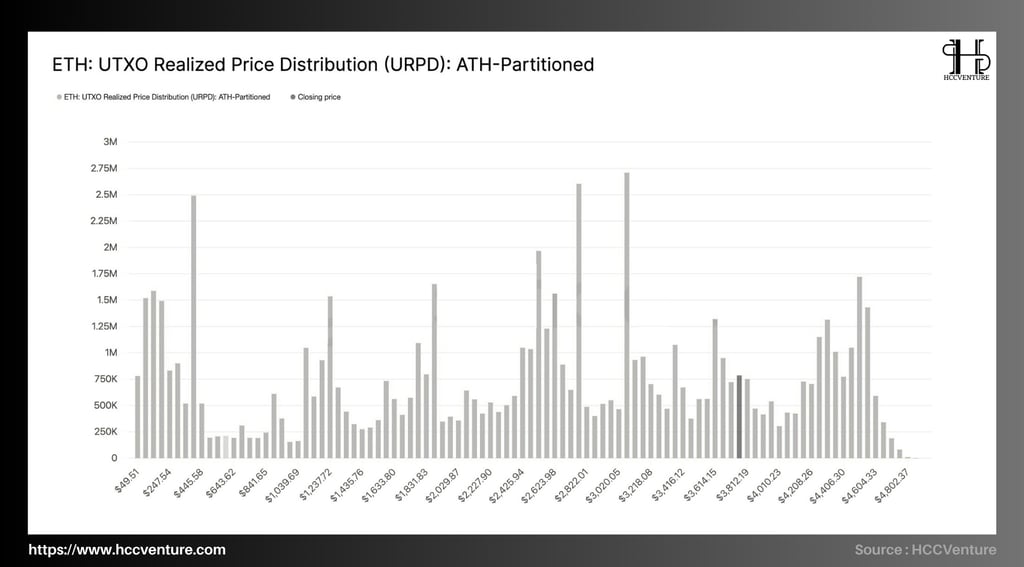
URPD – UTXO Realized Price Distribution shows where the realized supply is concentrated, thereby deducing the “thickness” of on-chain support/resistance. ETH’s current distribution shows the thickest clusters of realized supply at $ 2.55–2.65k , $2.95–3.20k , and especially $4.10–4.60k ; above the new ATH , the supply is almost thin . This pattern confirms that the market has accepted the high price (price acceptance), creating a stair-step support base below and leaving a “liquidity gap” above – the standard condition for an uptrend continuation phase .
In the 2021 cycle, URPD was concentrated in the $3-4k range and sparse in the >ATH range , then the price declined sharply because overhang quickly appeared when old investors sold. Currently, the $4.10-4.60k range has become the new cost-basis for most capital flows, while there is no equivalent thick band above . This shows acceptance of high valuations rather than "collective peak chasing"; the risk of systematic selling at the peak is lower than in 2021.
ETH URPD is building a ladder support base at $4.10–4.60k → $3.0–3.2k → $2.55–2.65k , while there is no thick supply block above the top. With the consensus on-chain structure (net withdrawal from exchanges, long-term HODL increase, valuation not overheated), the high probability scenario for the near term is a continuation of the increase after accumulation above .
Evaluation and Conclusion
Ethereum’s current on-chain picture reflects a comprehensive recovery structure across economic fundamentals, investor behavior, and network performance. When combining key metrics, it can be seen that Ethereum is operating in a state of increasingly sustainable supply-demand rebalancing – a phenomenon that often occurs before entering a strong cyclical price expansion phase.
First of all, the Percent of Addresses in Profit has returned to the 96–98% range , its highest level since the 2021 peak. This means that most on-chain investors are in profit, while the amount of holdings in the loss zone has almost completely disappeared. Unlike the early stages of the bull run, this ratio is currently not accompanied by large-scale profit-taking signals, indicating that investors are holding on to the expectation of continued growth.
In parallel, Exchange Net Position Change continues to show the strongest trend of ETH withdrawals from exchanges since early 2024. The amount of ETH withdrawn from exchanges reached millions of units, reflecting the confidence of long-term and institutional investors in value accumulation instead of short-term trading.
At the same time, Net Realized Profit/Loss shows that the market is in a healthy distribution phase : recent profit realizations have not caused sharp price declines, but have been fully absorbed by new capital flows.
In terms of price structure, URPD (UTXO Realized Price Distribution) shows that the area where investors' capital expenditure is concentrated is in the range of $4,000 - $4,600 . This is the intrinsic value area of the market - where most of ETH is bought and is being held, and is also the "liquidity lock" area for the next breakout.
In the medium term, ETH is likely to maintain the $4,000-$4,500 range to absorb liquidity before entering the next expansion phase towards $5,000 . In the long term, the combination of technological improvements (Layer-2 rollups, staking yield optimization) and deflationary supply structure will continue to strengthen ETH's intrinsic value.
Disclaimer: The information presented in this article is the author's personal opinion in the cryptocurrency field. It is not intended to be financial or investment advice. Any investment decision should be based on careful consideration of your personal portfolio and risk tolerance. The views expressed in this article do not represent the official position of the platform. We recommend that readers conduct their own research and consult with a professional before making any investment decisions.
API & Data: Glassnode
Compiled and analyzed by HCCVenture
Join HCCVenture here: https://linktr.ee/holdcoincventure
Explore HCCVenture group
HCCVenture © 2023. All rights reserved.


Connect with us
Popular content
Contact to us
E-mail : sp_contact@hccventure.com
Register : https://linktr.ee/holdcoincventure
Disclaimer: The information on this website is for informational purposes only and should not be considered investment advice. We are not responsible for any risks or losses arising from investment decisions based on the content here.
TERMS AND CONDITIONS • CUSTOMER PROTECTION POLICY
ANALYTICAL AND NEWS CONTENT IS COMPILED AND PROVIDED BY EXPERTS IN THE FIELD OF DIGITAL FINANCE AND BLOCKCHAIN BELONGING TO HCCVENTURE ORGANIZATION, INCLUDING OWNERSHIP OF THE CONTENT.
RESPONSIBLE FOR MANAGING ALL CONTENT AND ANALYSIS: HCCVENTURE FOUNDER - TRUONG MINH HUY
Read warnings about scams and phishing emails — REPORT A PROBLEM WITH OUR SITE.