


On-chain analysis week 4 / 2025: High liquidity, search for low price zone
After two months of consolidation, Bitcoin broke out of its stable price range and surged, setting a new all-time high (ATH) at $109,000. This article analyzes the market conditions and signals that indicate a potential move ahead of this rally.
1/25/20257 min read
Market Summary
Bitcoin inflows continue to remain positive , indicating that interest and confidence in the asset remain strong. However, since Bitcoin first hit $100,000 , the volume of inflows has decreased slightly, signaling that the market is entering a short-term rebalancing phase.
The decline in capital flows does not mean market weakness, but rather reflects a reduction in sell-side pressure as the market stabilizes around a new equilibrium.
Selling pressure from long-term investors is decreasing significantly, a sign that those who have held Bitcoin for a long time are more inclined to maintain their positions instead of selling at current prices.
The volume of Bitcoin transferred to exchanges for sale has dropped sharply, indicating that selling pressure from investors has also weakened.
Bitcoin is currently trading in a very tight price range, specifically over the past 60 days , the price range has been at an all-time low. This is often a signal that the market is preparing for a major move.
On-chain metrics analysis
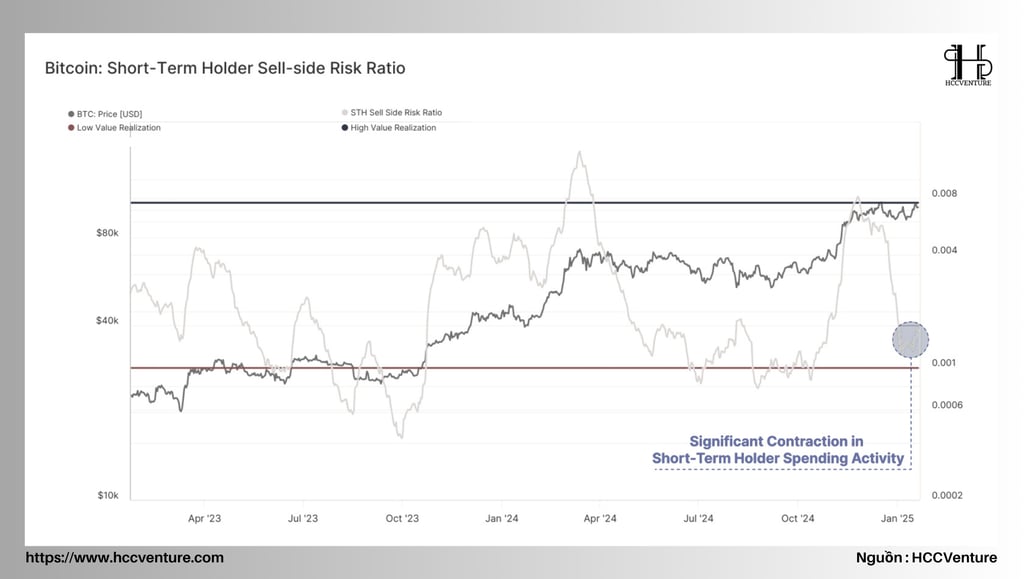
Recently, spending activity from short-term investors has dropped sharply, causing the Sell-Side Risk Ratio to contract very rapidly .
This is a signal that the majority of short-term investors have taken their intended profits or losses, and the market has gone through a “ profit/loss exhaustion ” phase .
A low Sell-Side Risk Ratio indicates that the market is near the local equilibrium point of 0.001 .
The potential profits and losses within the current price range have been almost fully realized.
History shows that when the Sell-Side Risk Ratio drops sharply and remains low, the market is usually preparing for a new strong price movement . This usually happens when the equilibrium is broken by a major catalytic event.
Exhaustion of profit-taking and stop-loss activity is a sign that the market is ready for the next move , usually a major breakout or correction.
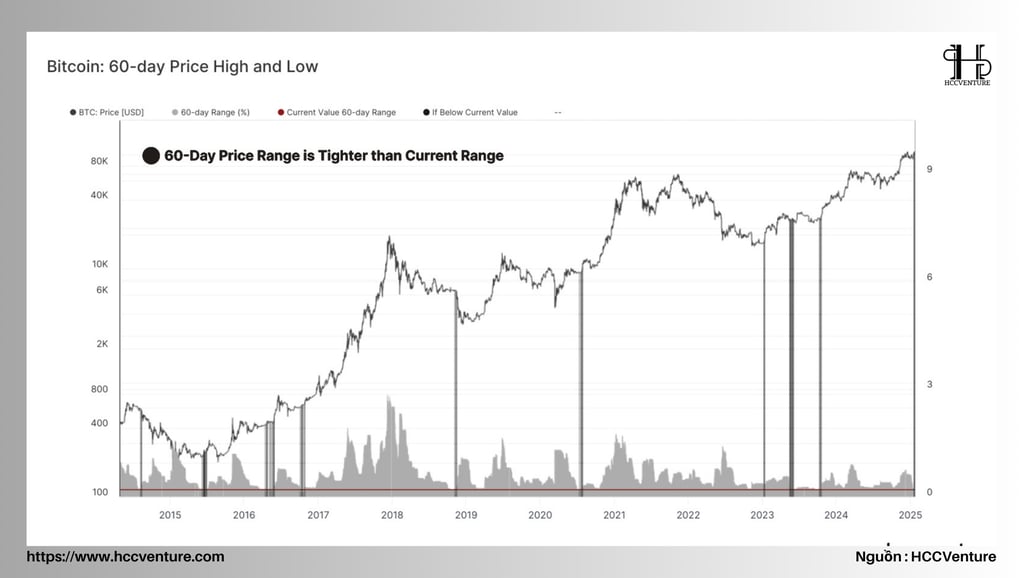
The 60-day price range is currently very narrow , reflecting a market consolidation in a period of low volatility. This event is a typical signal of the stages before a market explosion in volatility , seen in both bull markets and capitulation stages in bear markets.
All previous cycles with tight 60 day price ranges like the current one have resulted in large volatility breakouts.
Early bull markets: During these periods, narrow price ranges reflect accumulation sentiment, with sharp price increases soon after as market confidence returns.
Late-stage capitulations: Conversely, in bear cycles, narrowing ranges occur before the final sharp sell-offs as the market finds a bottom.
If the price range is broken to the upside, the market could enter a strong bullish phase , especially if important resistance levels like $108k (ATH) are broken. In the event of a sell-off, this narrow 60-day price range could usher in a final capitulation .
The narrow 60-day price range coupled with positive signals from on-chain indicators are suggesting that the market is about to enter a period of high volatility.
Support: $94.4k (consolidation bottom), $88.4k (STH cost basis).
Resistance: $108k (recent ATH), $112.6k (2σ threshold of MVRV Z-score).
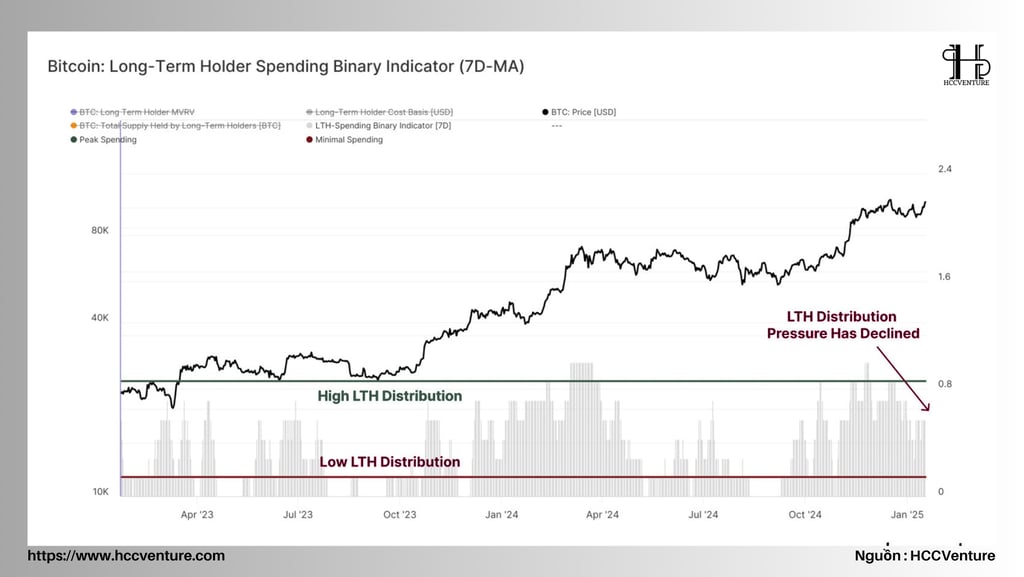
When Bitcoin price reached $100k in December 2024, the total supply of LTH decreased sharply, which coincided with significant selling pressure from long-term investors, as they took profits after a period of significant growth.
Currently, the total supply of LTH has started to increase slightly again, showing that the accumulation and holding behavior of long-term investors is more dominant than the distribution pressure.
The weakening in the rate of decline of LTH Supply suggests that the long-term investor group may have completed most of the profit-taking in the $100k price range.
This helps reduce supply pressure on the market, especially in the context of strong demand from institutions and ETFs.
If the LTH accumulation trend continues, this will create a strong support base for the Bitcoin market. Low selling pressure from LTHs could help the market maintain its bullish structure, especially as circulating supply decreases while institutional demand increases.

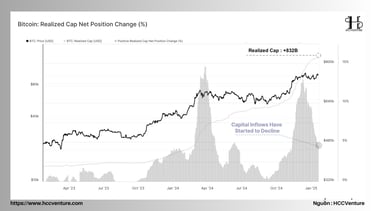
Realized Cap is currently at an all-time high (ATH) of $832B , representing the total realized value paid for the entire current Bitcoin supply.
Realized Cap is growing at a rate of $38.6B/month , showing that capital inflows into the market are still relatively strong despite decreasing in intensity from the peak.
As capital flows decline to lower levels, the amount of capital required to maintain prices within the current range also declines, indicating that the market is finding a new equilibrium at higher prices.
Bitcoin inflows have slowed since hitting the $100k peak, but are still strong enough to keep the price within the current accumulation range. Realized Cap has hit an all-time high, reflecting the steady growth of the Bitcoin network's real value, reinforcing the long-term bullish structure.
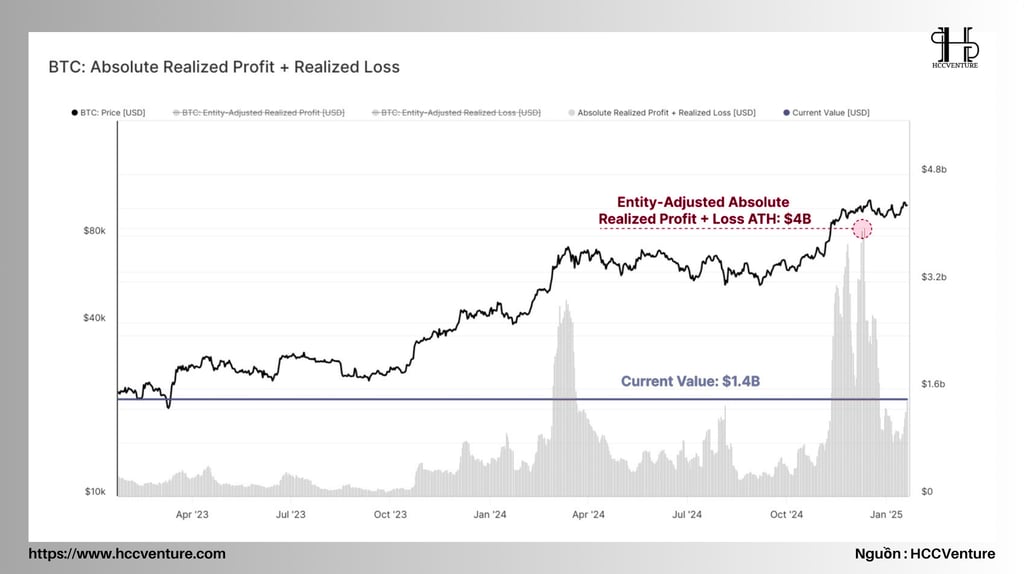
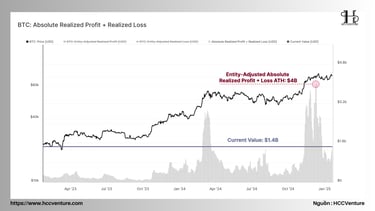
Total Realized Profit + Realized Loss has dropped from an all-time high (ATH) of $4B to $1.4B , a -65% drop .
Despite the sharp drop, current values are still well above historical averages, highlighting the volume of trading and capital flows during bull market conditions.
Strong trading activity with high Realized Profit shows good capital absorption from new and institutional investors, despite heavy profit-taking pressure.
Although the total Realized Profit and Loss value is down -65% from the peak, the current value remains high compared to history, reflecting the size and strength of the current bull market.
Selling pressure from investors is gradually decreasing, indicating that the market may be moving into an accumulation phase before entering a new growth phase.
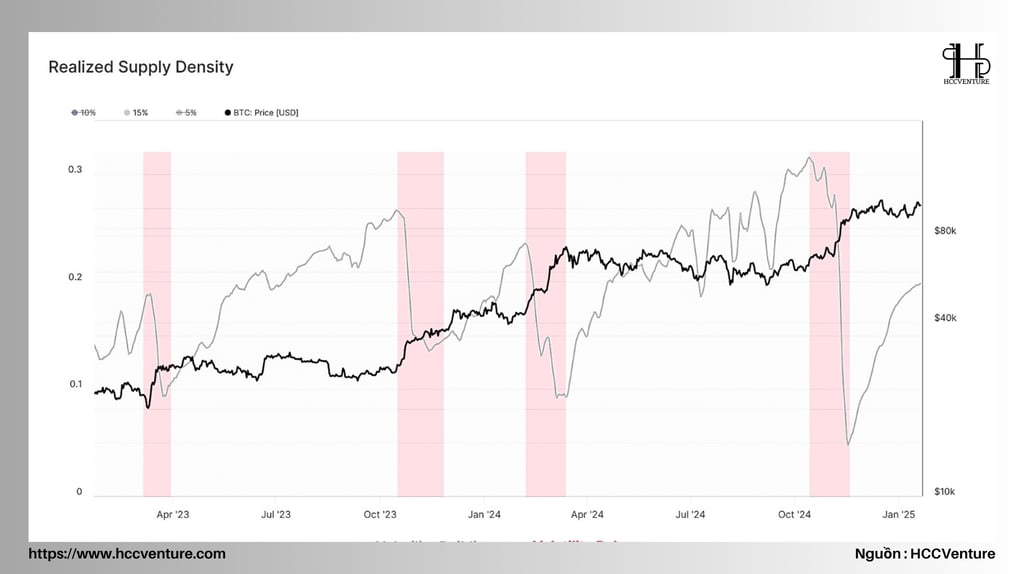
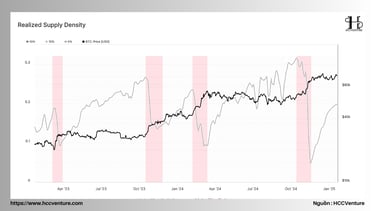
Measures the concentration of supply trading within a ±15% range around the current price.
20% of the total Bitcoin supply is being accumulated and trading within a ±15% price range around the current spot price.
This indicates a high level of supply concentration , reflecting investor accumulation behavior.
With 20% of supply within a narrow range around the current price, small fluctuations can have a large impact on an investor's profit/loss ratio, thereby creating increased price volatility.
This phase can become a strong support platform for the next bull cycle, but also comes with the potential for high price volatility when the price breaks out of this range.
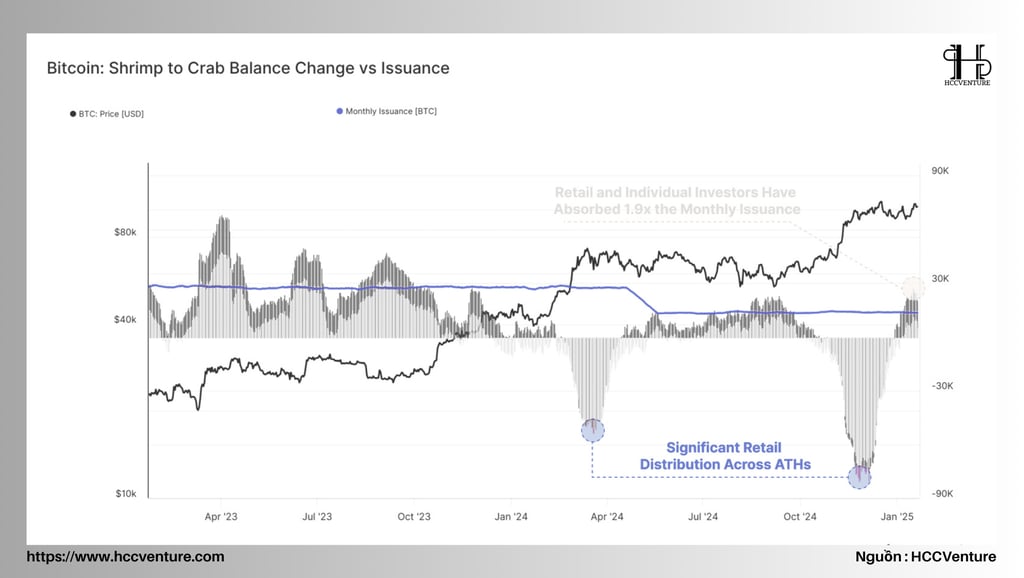
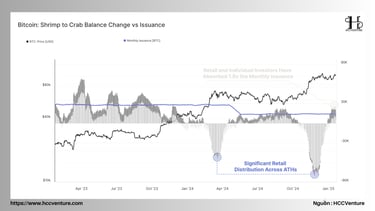
The Shrimp-Crab group consists of investors holding <10 BTC , representing retail and individual investors. The most recent data shows that:
Total BTC absorbed by Shrimp-Crab group: +25.6k BTC .
Monthly issuance of BTC: +13.6k BTC .
Result: Shrimp-Crab group absorbed 1.9x the amount of newly mined BTC , showing that the level of buying far exceeded the new supply from main production.
As the Shrimp-Crab group continues to absorb large amounts of BTC, the available supply on the market will decrease, allowing the price to remain higher. The buying behavior of this group creates a foundation for long-term price support.
The 1.9x absorption of new supply shows that the supply from miners is not enough to meet the demand from retail and individual investors. This could be a sign of a potential bull cycle .
Conclusion and evaluation
Bitcoin experienced strong intraday price volatility, reaching a new all-time high (ATH) of $109,000, then falling sharply and finally stabilizing above $100,000. This strong price volatility reflects the level of uncertainty in the market , especially in the challenging and uncertain macroeconomic environment, as the US Presidential inauguration approaches.
In this article, we analyze and evaluate the conditions that led to this strong but volatile price movement. We provide a framework for identifying signs of upcoming volatility, through a combination of the following factors:
Declining on-chain transaction volume : A decline in market activity, indicating that the market is lacking new speculative capital.
Capital Flows : Capital flows into Bitcoin remain positive but trending downward, indicating that speculative interest is waning.
Narrowing Price Range : A narrowing in the price range of Bitcoin over the past 60 days, is usually a sign of increasing volatility.
Despite the uncertainty, the current market structure remains bullish, with key support levels holding and selling pressure relatively light. Although Bitcoin has entered an accumulation phase, its behavior continues to suggest the possibility of further upside as these factors continue to develop.
The market has entered a critical phase where the interaction of falling capital flows, narrowing price ranges and mild selling pressure points to an upcoming volatility outbreak . Investors need to remain vigilant, as the current environment could be the backdrop for both short-term volatility and a continuation of the long-term trend. The macroeconomic backdrop, especially political events such as the US Presidential inauguration, will also play an important role in shaping future market conditions.
Join the HCCVenture community to get the latest market information. Once again, we give our opinion on potential projects in the crypto market. This is not investment advice, consider your portfolio. Disclaimer: The views expressed in this article are solely those of the author and do not represent the platform in any way. This article is not intended to be a guide to making investment decisions.
API & Data : Glassnode
Compiled and analyzed by HCCVenture
Join our telegram community: HCCVenture
Explore HCCVenture group
HCCVenture © 2023. All rights reserved.


Connect with us
Popular content
Contact to us
E-mail : sp_contact@hccventure.com
Register : https://linktr.ee/holdcoincventure
Disclaimer: The information on this website is for informational purposes only and should not be considered investment advice. We are not responsible for any risks or losses arising from investment decisions based on the content here.
TERMS AND CONDITIONS • CUSTOMER PROTECTION POLICY
ANALYTICAL AND NEWS CONTENT IS COMPILED AND PROVIDED BY EXPERTS IN THE FIELD OF DIGITAL FINANCE AND BLOCKCHAIN BELONGING TO HCCVENTURE ORGANIZATION, INCLUDING OWNERSHIP OF THE CONTENT.
RESPONSIBLE FOR MANAGING ALL CONTENT AND ANALYSIS: HCCVENTURE FOUNDER - TRUONG MINH HUY
Read warnings about scams and phishing emails — REPORT A PROBLEM WITH OUR SITE.