


On-chain analysis week 39/2025: Bitcoin's full cycle?
Bitcoin has moved from euphoria to correction after the FOMC-triggered rally, with long-term investor profit realization (LTH) reaching ~3.4 million BTC, while spot ETF inflows have weakened significantly.
9/29/202510 min read
Summary of the situation
Realized Cap data shows ~$678B cumulative inflows in the current cycle, but LTH alone has realized ~3.4M BTC in profits . Compared to the strongest distributions in 2017 and 2021, the current absolute size is significantly larger , emphasizing profit-taking supply as prices approach new historical highs.
The ~8% on-chain correction depth is still “mild” compared to the -15% to -25% cooldowns that have occurred after large-scale LTH distributions; this suggests that the supply pressure has not been fully absorbed .
Net inflows into spot ETFs – the “buffer” that absorbs supply during previous uptrends – decelerated sharply at the same time LTH increased distribution. As a result, the supply-demand balance became fragile , making prices more sensitive to liquidity shocks.
Large-scale distribution from LTH, ETFs are no longer absorbing supply quickly enough , derivatives are turning to defense , and STH's psychological balance threshold at $111k is being tested by fire. With this structure, the scenario with a high probability is not an immediate re-acceleration , but a longer cooling/adjustment phase to rebalance supply-demand.
Analyzing on-chain metrics
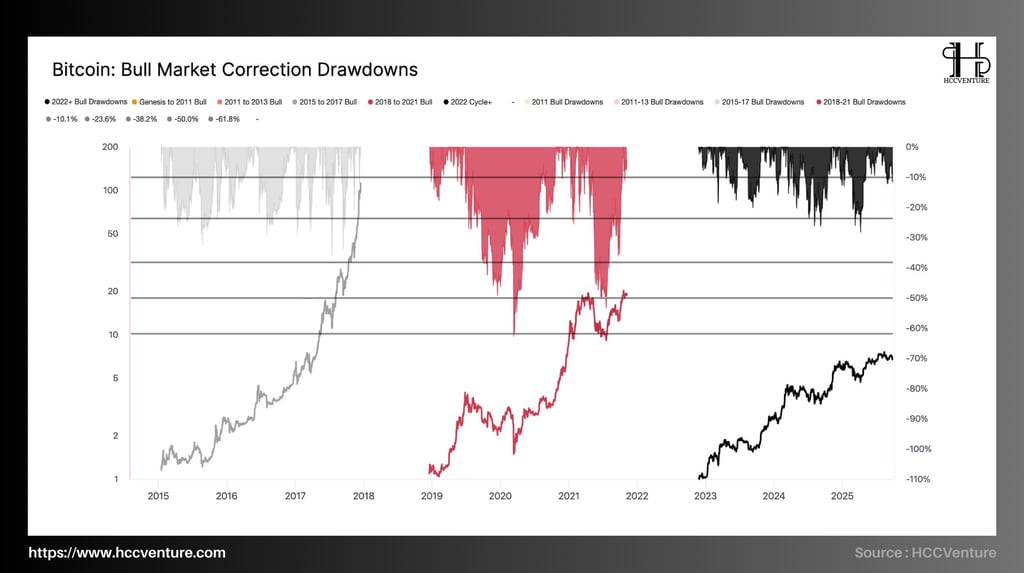

Each cycle sees deep corrections, but the general trend is for volatility to decrease over time, reflecting the market's increasing maturity and liquidity.
In previous cycles, Bitcoin has seen average corrections of -30% to -60% , with some extremes exceeding -80% during liquidity crises. For example, the 2018–2021 period saw declines of over -61.8% , indicating extreme volatility. In contrast, the current cycle (2022–2025) has seen a completely different structure: the largest correction was only -23.6% , and most of the declines were around -10% to -15% , significantly lower than historical levels.
From the recent peak of $124,000 , the correction to the $113,700 area represents only about -8% , a very modest figure in the context of previous cycles. The gradual decrease in the drawdown amplitude shows the maturity of the Bitcoin market. Abundant liquidity, increasing participation of institutional investors, along with derivatives and ETFs have significantly reduced the possibility of liquidity shocks like in the early cycles. On the other hand, the distribution structure of long-term holders shows controlled profit-taking behavior, instead of massive sell-offs, helping to maintain stability for the long-term growth trend.
It is worth noting that although the market is in a correction phase, on-chain data remains positive: the ratio of supply held in profits remains above 90% , ETF inflows remain in a net absorption state, and short-term price volatility is at its lowest level in years.
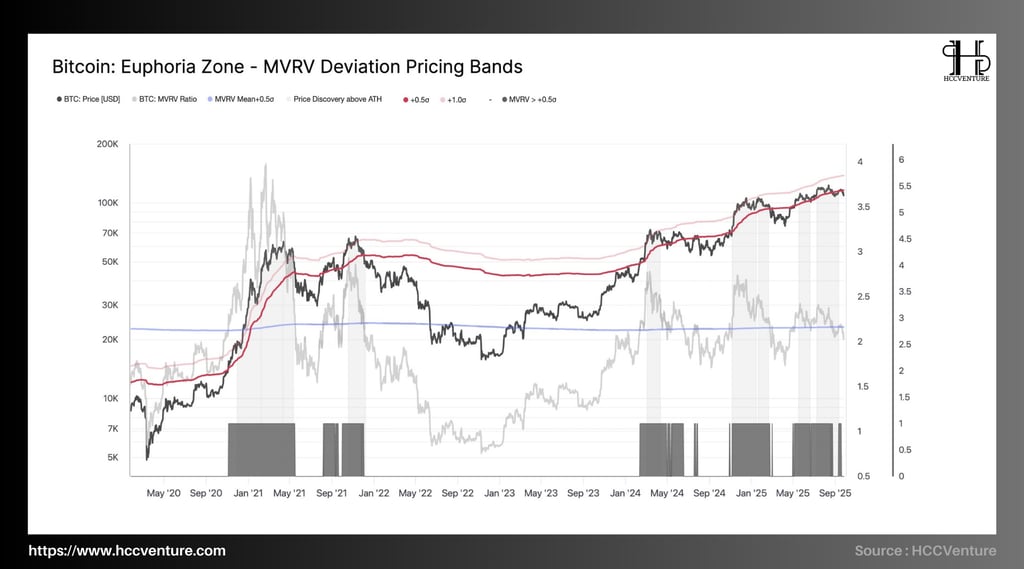
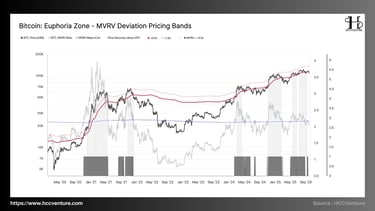
MVRV (Market-Value-to-Realized-Value) is currently above the +0.5σ band and oscillating around 3.2–3.6 , which corresponds to a controlled euphoria . The spot price is closely following the upper band of the model (+1.0σ band), while the +0.5σ band acts as the balance axis of the cycle.
Compared to historical peaks (MVRV >4.5) in 2021, the current "overheating" level is significantly lower , confirming a mature uptrend , lower volatility and a tendency to escalate in steps rather than "extremely blowing out candles". One thing to note is that when MVRV goes above +0.5σ but has not reached the extreme zone , the bullish structure is sustainable , the correction mainly serves to redistribute from short-term holders to new cash flows, instead of reversing the trend.
During price discovery phases (shaded area), MVRV typically compresses around the +1.0σ band before breaking out. The series of retests of this band in recent weeks has been accompanied by profit-taking pressure from the 1–3 month group, but has not pulled MVRV through +0.5σ , implying:
(1) Spot demand is still sufficient to absorb.
(2) Derivative leverage has decreased compared to hot peaks, making the adjustment not as amplified as previous times.
Compared to 2021 (MVRV repeatedly exceeded 4.5-5.0 ), the phenomenon of "overvaluation spike" has not appeared; therefore, the risk of creating an end-of-cycle peak is not yet qualified .
The MVRV structure confirms that the main uptrend is still valid . The market is in a moderately excited state , but not yet overheated . Therefore, the consistent thesis is: maintain the bullish bias , prioritize buying strategy when adjusting to the +0.5σ range (~109–112k) , and activate the extension of the uptrend when closing the candle above 118–120k (+1.0σ range). Only when MVRV loses +0.5σ , it is necessary to reduce risk and wait for deeper re-accumulation around 105–108k .
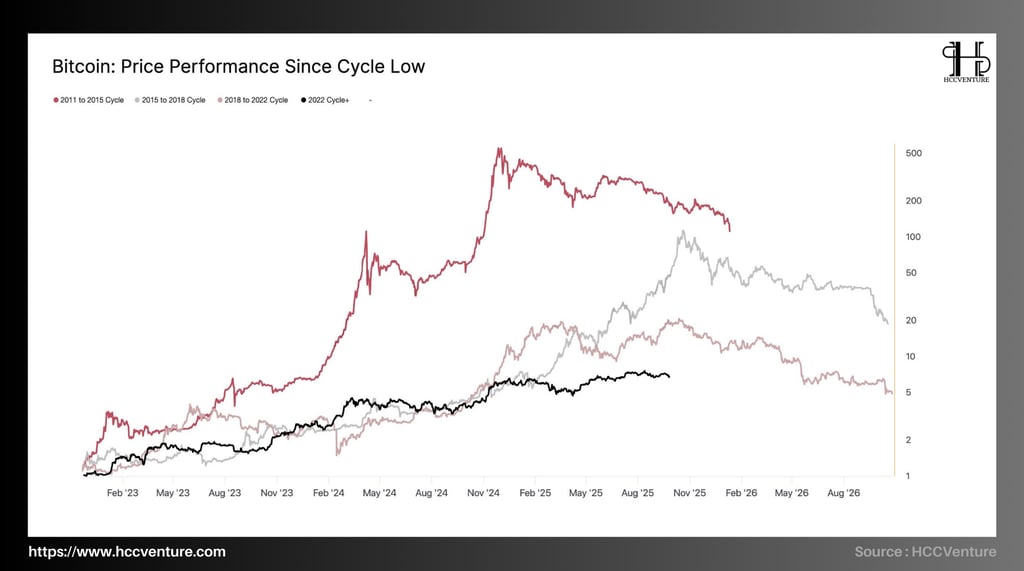
Overlaying four cycles shows that the 2022–present cycle trajectory closely follows the previous two cycles in terms of duration but with significantly lower returns . With the cycle peak at ~124.0k (to date), the current cycle duration is ~1,030 days from the November 2022 bottom—almost identical to the ~1,060 days of the 2015–2018 and 2018–2022 cycles.
In terms of the magnitude of the price increase from the bottom, the current cycle is at ~7–8x (from ~15.5k to ~124k), much lower than the ~20–22x of the 2018–2021 cycle and >80x of the 2015–2017 period. The conclusion is undisputed: the 2022+ cycle has entered the mature phase, with both yield and volatility margins declining.
In the first 1,000 days from the bottom, the black performance line (current cycle) trails below the two light gray lines (previous two cycles) in slope, reflecting a slower but more consistent accumulation rate. At the same time point, the cumulative performance of the 2022+ cycle is ~60–70% worse than the peak performance of the 2018–2021 cycle and worse compared to 2015–2017.
The current cycle length approaching 1,060 days —the “normal” number for the last two cycles—confirms that Bitcoin is in the final stages of its primary bull phase . At this stage, yield slopes are decreasing , new rallies are more dependent on exogenous flows (ETFs, spot inflows), and technical corrections are more frequent but shallower in depth than in the past—consistent with a picture of declining volatility across the cycle.
The cyclical context forces investors to prioritize managing expectations:
Maintain medium-term bullish bias but do not pursue "multiply" expectations like the first cycles ;
Take advantage of pullbacks to the 105-112k support range to rebalance, and only increase risk when the closing price stabilizes above 120k with a clear improvement in spot cash flow;
For long-term investors, the current slightly sloping sideways yield curve is characteristic of late-cycle advance , consistent with a strategy of holding core positions, rotating the margins rather than looking for a “nonlinear breakout”.
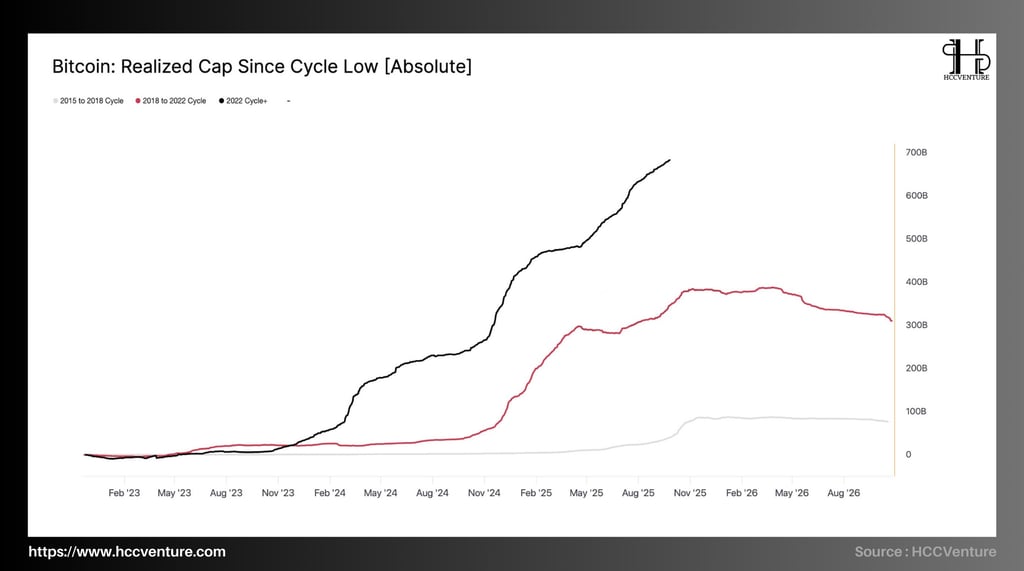
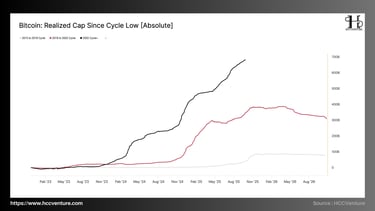
Realized Cap (RC) measures the total “on-chain cost” of circulating supply—each coin valued at its last move. Since the November 2022 cycle bottom, Bitcoin’s RC has increased by ~$678 billion , far exceeding the ~$383 billion of the 2018–2022 cycle, ~$85 billion of 2015–2018, and ~$4.2 billion of 2011–2015. This means that the size of net capital absorbed in the current cycle is ~1.8x larger than the previous cycle.
The black RC line (cycle 2022+) is steadily increasing, with almost no prolonged RC deflation phase like the second half of 2021–2022 (red line). This slope reflects two simultaneous factors:
(1) High new buying intensity in increasingly large price zones.
(2) Weak net capital withdrawal pressure —even with profit taking, capital still circulates within the cycle instead of fleeing the system.
It took ~1,000+ days for RC in the previous cycle to peak at ~383B, while the current cycle has reached ~678B in the same timeframe—a quantum leap in cash flow efficiency . As RC increases, the average cost of capital of the network moves up, pushing the structural floor up as well. This makes deep corrections less likely to last , because each time the price retreats, a large number of investors who have just returned to the no-loss zone are ready to reabsorb supply .
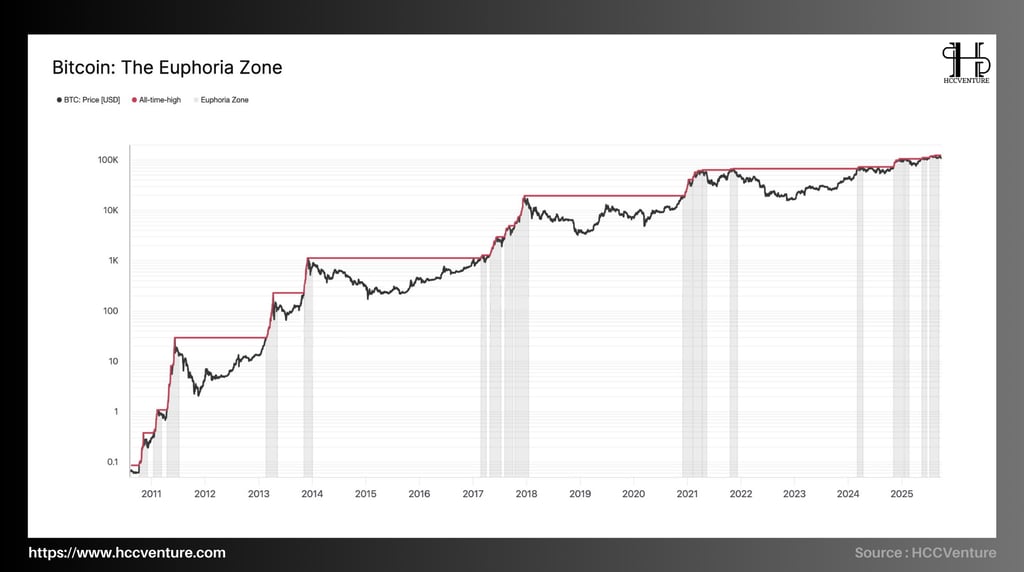
“ Euphoria Zone ” is a concept that marks periods when the closing price breaks above the historical high (ATH) and maintains it — that is, entering price discovery . On the chart, the red ladder line represents a series of new ATHs, while the gray bands are the accompanying euphoria periods.
In previous cycles (2013, 2017, 2021), euphoria was often accompanied by a strong increase in amplitude but also led to deep corrections afterwards. The current cycle is different in that: the acceleration of the price increase is smaller, but the duration of the euphoria band is longer and the ATH ladder is formed in a "climbing" style .
After surpassing the old ATH of ~69k (2021) and setting a new ATH in Q1/2024, Bitcoin continued to step up to ATH of ~100k and then ~124k in 2025. The price is currently fluctuating around 114-116k , which is only ~8% lower than the full peak - a very shallow correction compared to the -25% to -40% swings seen between euphoria phases in previous cycles. Thus, the market is still in the Euphoria Zone , with no signs of leaving this zone on the weekly chart.
In the historical view of the “Euphoria Zone”, the most recent ATH (~100k) acts as a boundary of the regime . Keeping the weekly close above 100k means maintaining euphoria and continuing the exploration process to higher levels. Losing 100k would be an exit from the euphoria regime , putting the market into a re-accumulation phase at the top instead of continuing the trend of pushing the top.
When in the Euphoria Zone where the correction depth is shallow and the duration is long , the risk of a cycle reversal is significantly reduced; instead, the market tends to go “stair-step” : breakout –> new price base –> further breakout.
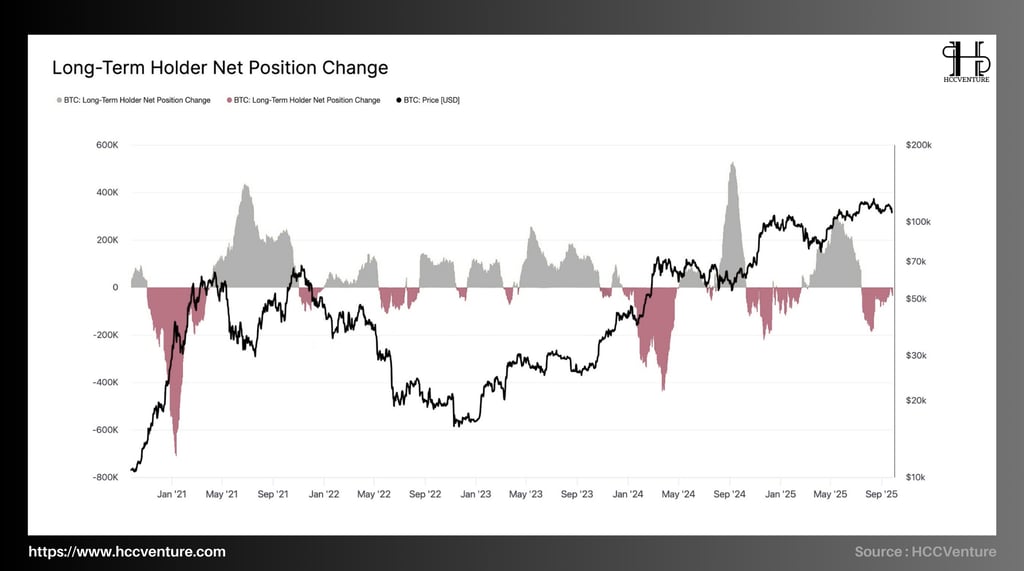
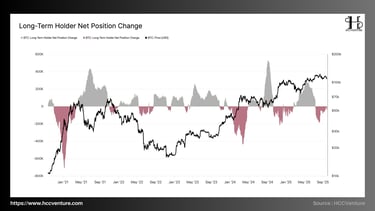
After the FOMC-driven rally, the on-chain structure shifted to a deliberate distribution phase for Long-Term Holders (LTH) : the LTH Net Position Change indicator turned negative, indicating that long-term treasuries are net sellers; at the same time, the Profit Realization ratio just left an extreme peak (≈90% of moving coins are in profit).
In previous cycles, LTH typically delivered in a single “big wave” as prices entered the euphoric phase. The current cycle is distinct in that it has three consecutive multi-month injections (Q4-2024, Q1-2025, and post-FOMC 9/2025), each of which has pushed LTH Net Position Change into deep negative territory.
The cumulative net selling volume of LTH in the most recent period is estimated at around 150k–200k BTC , lower than the 2021 distribution peak (which exceeded 300k–400k BTC in 6–8 weeks), but the prolonged nature makes the supply pressure not explode but trickle down —enough to restrain the increase when the new money flow slows down.
Realized Profit/Loss Ratio recorded three times above the threshold of ~0.9–0.95 (≈90% of UTXO moves are profits) corresponding to the three capital waves mentioned above. Each of these times in history marked a local top and opened a correction/sideways phase lasting several weeks to several months.
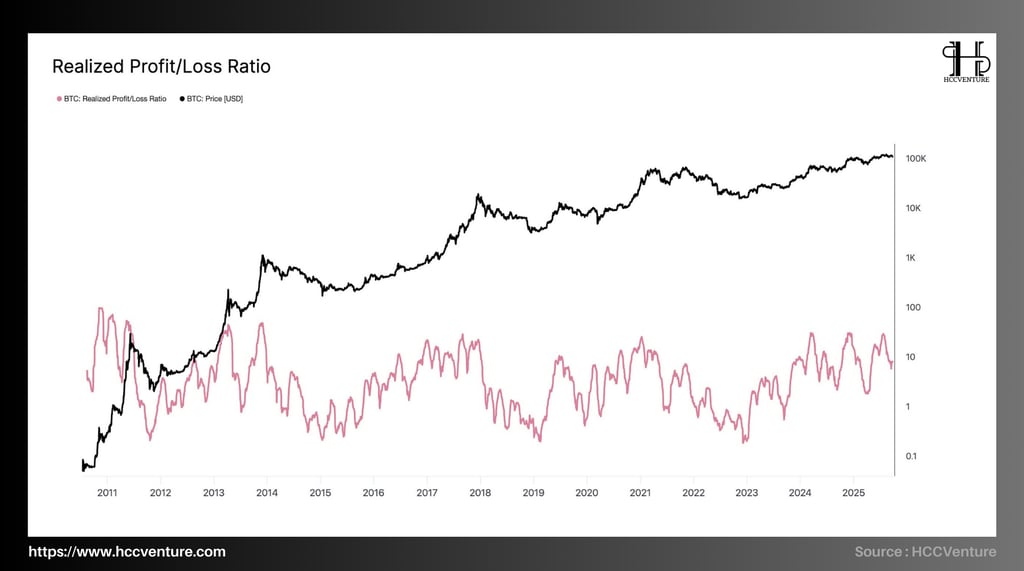
The Realized Profit/Loss Ratio (RPLR) is retreating from the euphoric zone (the ratio of profitable transactions is overwhelming), coinciding with LTH increasing profit-taking and the US spot ETF flow weakening to around ±500 BTC/day (SMA-14) . The off-chain picture - ETF absorbing supply versus LTH distributing - is deciding the price amplitude to compress the upward momentum when there is strong net absorption, but also supporting the bottom when funds are still buying steadily.
History shows that every time RPLR spikes to an extreme level (most coins move in profit), the market usually enters a correction/sideways movement to rebalance profits. After the FOMC, RPLR cooled down , while BTC fell from a peak of ~$124k to ~$113.7k (drawdown only ~8% , much shallower than the cycle's peak of ~28% ).
Long-Term Holders turned net short in three extended “waves” (Q4-2024, Q1-2025, post FOMC 9/2025). Each wave coincided with a local peak of RPLR , representing profit rotation rather than explosive euphoria, but still enough liquidity cushion to limit the depth of the correction. When net absorption increased back to >2–3k BTC/day , recent history shows that the bullish momentum reactivated very quickly .
Evaluation and Conclusion
After a strong rally fueled by the recent FOMC decision, Bitcoin has entered a “ buy the rumor, sell the news ” correction. The bullish momentum has begun to wane, as evident from on-chain indicators and derivatives market behavior.
With a drawdown of only -8% from its all-time high, the market shows that the strength of capital flows remains strong. This confirms that the current growth trend is still sustainable, and the decline in volatility is a sign that Bitcoin is increasingly approaching the role of a global macro asset , rather than just a cyclical speculative instrument.
One of the notable features was the strong distribution from long-term holders (LTHs) . A total of 3.4 million BTC were realized in profits during this period, marking one of the largest distributions in history.
Spot volumes spiked during the sell-off, accompanied by strong futures deleveraging . Liquidation clusters emerged in both directions, making the market vulnerable to short-term swings. At the same time, the options market showed a marked increase in demand for hedging, with skew rising sharply and puts being priced higher.
The overall picture shows that Bitcoin is entering a period of weakening momentum after a hot streak. The current 8% drop is small compared to history, but in the context of large distributions from LTHs and slowing ETF inflows , the risk of a deeper correction cannot be ignored.
Disclaimer: The information presented in this article is the author's personal opinion in the cryptocurrency field. It is not intended to be financial or investment advice. Any investment decision should be based on careful consideration of your personal portfolio and risk tolerance. The views expressed in this article do not represent the official position of the platform. We recommend that readers conduct their own research and consult with a professional before making any investment decisions.
API & Data: Glassnode
Compiled and analyzed by HCCVenture
Join HCCVenture here: https://linktr.ee/holdcoincventure
Explore HCCVenture group
HCCVenture © 2023. All rights reserved.


Connect with us
Popular content
Contact to us
E-mail : sp_contact@hccventure.com
Register : https://linktr.ee/holdcoincventure
Disclaimer: The information on this website is for informational purposes only and should not be considered investment advice. We are not responsible for any risks or losses arising from investment decisions based on the content here.
TERMS AND CONDITIONS • CUSTOMER PROTECTION POLICY
ANALYTICAL AND NEWS CONTENT IS COMPILED AND PROVIDED BY EXPERTS IN THE FIELD OF DIGITAL FINANCE AND BLOCKCHAIN BELONGING TO HCCVENTURE ORGANIZATION, INCLUDING OWNERSHIP OF THE CONTENT.
RESPONSIBLE FOR MANAGING ALL CONTENT AND ANALYSIS: HCCVENTURE FOUNDER - TRUONG MINH HUY
Read warnings about scams and phishing emails — REPORT A PROBLEM WITH OUR SITE.