On-chain analysis week 38/2025: Bitcoin and the final growth wave
Bitcoin is in a solid consolidation phase after a strong rally, with a healthy on-chain structure and derivatives market playing a key role in stabilizing the trend especially after the FOMC meeting.
9/21/202510 min read
Market Summary
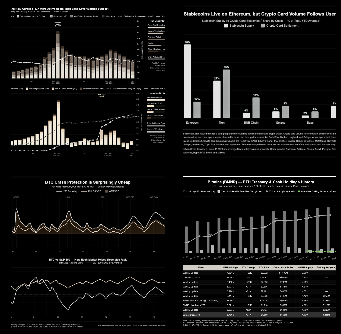
Spot liquidity remains under moderate selling pressure, but has largely been absorbed through a short squeeze in the perpetual market. Perpetual Open Interest peaked at 395,000 BTC before correcting to around 380,000 BTC , indicating a healthy rebalancing after the strong volatility.
On the volatility front, the Implied Volatility – Realized Volatility (IV–RV) spread widened significantly ahead of the FOMC, suggesting that the market had repriced risk, but at the same time dealer positioning was acting as an anchor, helping to reduce the likelihood of a deep decline.
On-chain, ~95% of supply is in profit ; the URPD price distribution structure shows that the $108–116k zone has been filled by buy-the-dip demand, creating a thick liquidity cushion. In the derivatives market, perpetual contract open interest ~380k BTC and options open interest hit a record ~500k BTC ahead of quarterly expiry, while funding ~0.01%/8h remained neutral.
STH’s “age” capital base holds key points; spot prices on all three baselines result in the majority of recent cycle buyers being profitable , the axis of interest is aligned towards holding.
Analyzing on-chain metrics
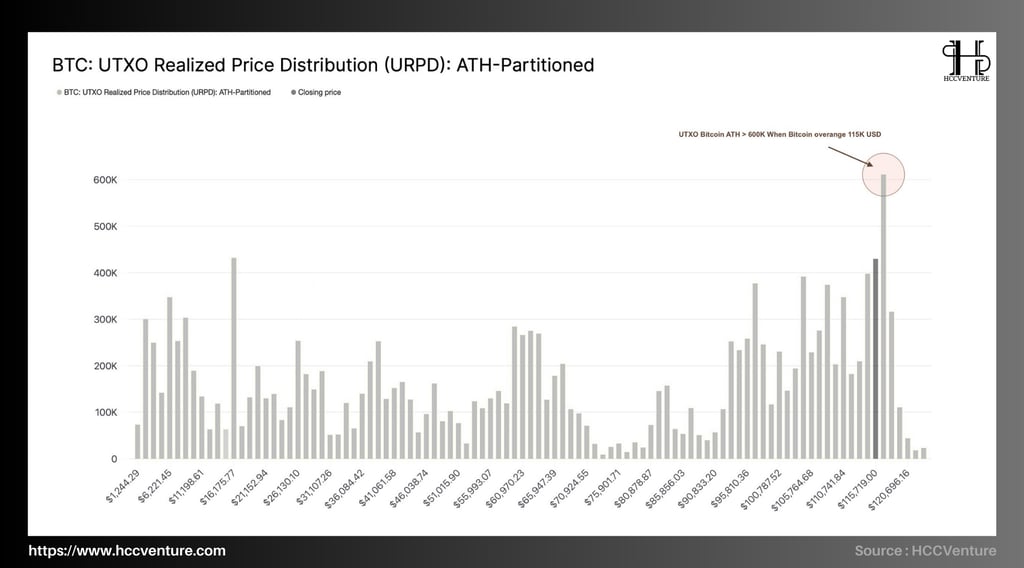
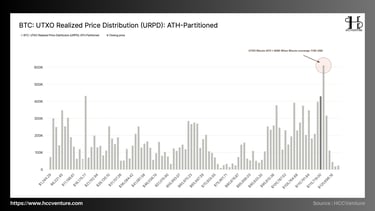
URPD (UTXO Realized Price Distribution) shows how much coin is “settled” at each purchase price, reflecting where the market has more breakeven, profit taking, or potential stop loss pressure. With Bitcoin trading around $115–116k after the post-FOMC bounce, the question is “has the short-term supply been absorbed enough to sustain the uptrend with the hanging supply ready to crush the price?”
URPD shows that the densest distribution cluster is currently located right next to the new historical peak, concentrated at 115-121k USD. The highest bar that surged above 600k BTC around the price of around 115k USD, is a typical trace of “filling the air-gap” when both spot and ETF/derivative capital bought to fill the liquidity gap above after the price made ATH, turning the 110-121k USD zone from resistance to a large cost base cluster .
Below, the $98–106k band still has a significant “pedestal” with multiple ~200–300k BTC columns , and deeper still, the $60–70k historical cluster of ~250–300k BTC size remaining from the previous cycle. Compared to the 2022 bottom phase around $15.5k, the URPD structure has shifted upwards almost entirely: the majority of circulating supply is in a profitable state , and the “pain points” (loss clusters) have narrowed significantly.
The current URPD structure confirms the continuation of the bullish bias . The amount of coins “anchored” tightly around 110–121k USD is evidence of post-ATH supply absorption , turning this entire range into a strategic price base instead of a distribution peak. Once firmly above 115.2k USD , the probability of a boundary extension to 118–121k USD is high; if the upper boundary is broken by spot/ETF buying or gamma pressure from options, the market will enter a “zero gravity” zone due to the thin URPD ahead. The risk of correction is only significant if 110k USD is lost , then inertia will pull back to 105–106k USD before the demand in the lower cluster rebalances.
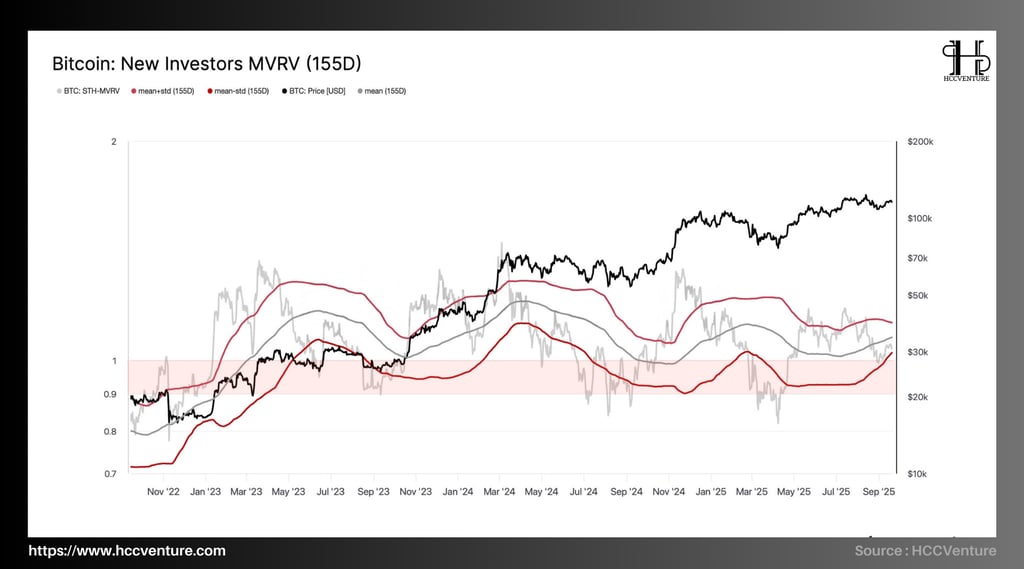
STH-MVRV (155D) measures the ratio between market price and “real cost” of young supply ≤155 days , which is a barometer of new investor returns:
>1 means most STHs are profitable (reduced incentive to sell).
<1 is in the tension/hole zone (easy to cause stock outage).
The 155-day statistical range allows for a mean period normalization around 1.00, with an amplitude of ±1σ approximately 0.93–1.10.
After the post-FOMC bounce, STH-MVRV (155D) alone stood above 1.0 , currently around 1.03–1.05 . This position is higher than average but has not yet reached +1σ , indicating that new investor profits are just positive enough to reduce selling pressure , but have not yet caused overheating . If converted in reverse, the average cost of STH 155D is around 110–112 thousand USD ; this matches the “anchor points” on the on-chain cost-basis by age group (1–3 months ~112.8–113.8 thousand; 6 months ~108.3 thousand).
In terms of supply structure, the recent URPD shows a thick distribution cluster of 110-121k USD , especially thick at 115-121k , confirming that spot capital has "filled the air-gap" right at the historical peak. On that basis, the fact that STH-MVRV maintains >1 is a signal of accumulation above , showing that most new buyers have slight profits and are willing to hold rather than sell at all costs.
In the previous euphoric periods, STH-MVRV (155D) expanded to 1.12–1.16 (approaching +1σ), then corrected to 0.95–0.98 in Q2–Q3/2025 , marking a “cold” period when new investors simultaneously suffered slight losses. However, the current index returning above 1 but not yet overshooting shows a different picture from the previous euphoric peaks because the profit yield is moderate and the distribution has not exploded .
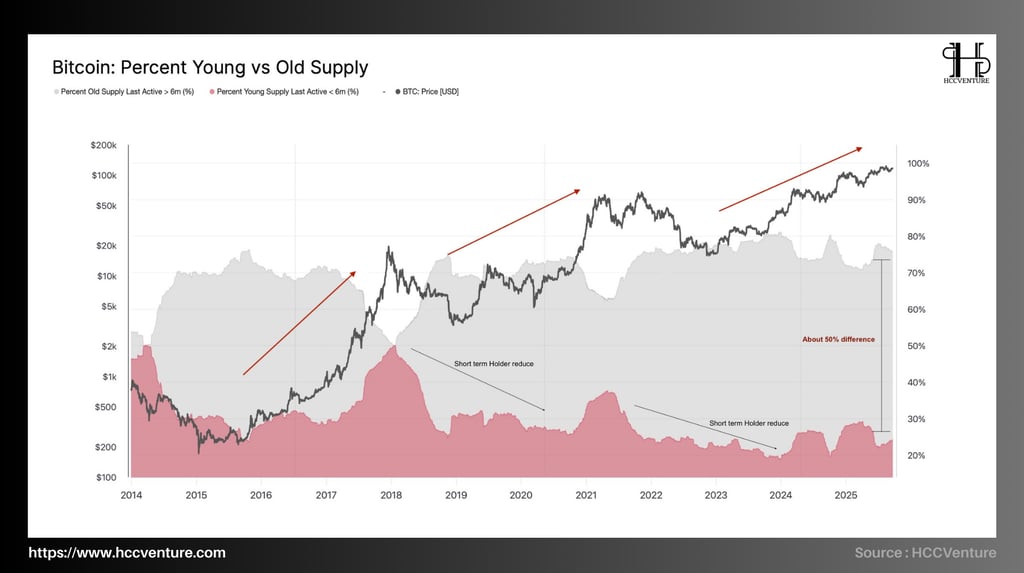
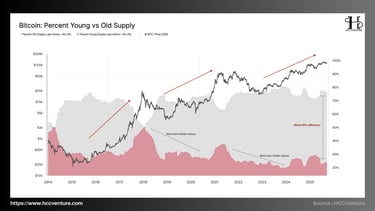
Young to Old Supply Ratio measures the percentage of BTC that has moved in the last 6 months (Young) compared to inactive ≥6 months (Old) , early-mid bull phases are often accompanied by rapid increases in young supply (strong distribution), while sustained base accumulation phases show overwhelming dominance of old supply (shrinking “float” available for sale). At the current price range it shows:
The supply older than 6 months accounts for ~74–76% of the total circulating supply.
The supply of children under 6 months is approximately 24–26%.
The Old–Young gap is approximately 50 percentage points – the largest of the current growth cycle and equivalent to the solid base periods (2015, 2019, late 2022).
Compared to the first half of 2024, young supply has decreased by ~8–10 percentage points while old supply has increased symmetrically , reflecting the net re-accumulation process after distribution waves around the historical peaks in March and August. Behaviorally, the proportion of young does not break out to >30% as in previous overheating phases; on the contrary, the profit margin of new buyers remains moderately positive (STH-MVRV 155D around 1.03–1.05 ) and ~95% of the total network supply is profitable .
The advantage of old supply implies a tightening of the actual tradable supply : coins are in the hands of holders less sensitive to volatility, which lowers the supply elasticity . When marginal demand (spot/ETF/moderate leverage) returns, the price slope tends to increase more effectively due to the thin “float”. This state also reduces the probability of a widespread active sell-off : to sell on a large scale, the old group must move to the young – a process that always takes time and higher prices. Therefore, the current structure is inclined towards accumulation at the top , not distribution at the top.
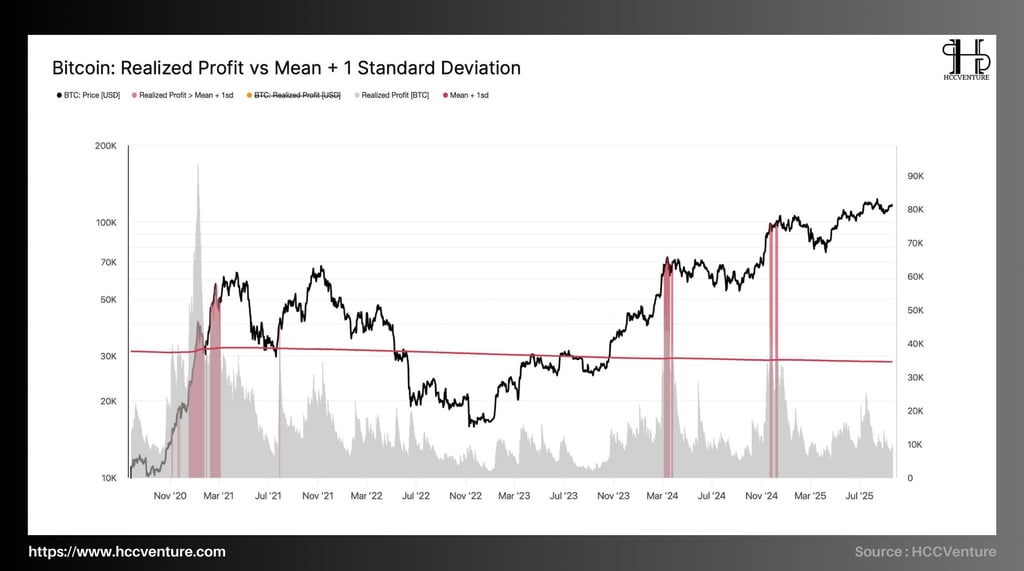
The Realized Profit vs Mean +1σ metric shows that the network profit-taking pressure is moderate, below the overheating threshold. Current profit margins are being smoothly absorbed by both spot and derivatives flows; the risk of a “mass sell-off” is significantly lower than the March 2024 , November 2024 , and March 2025 booms .
7D-SMA Realized Profit is significantly lower than the Mean +1σ threshold. The average realized profit size per day is around 10–12k BTC equivalent to ~1.15–1.35 billion USD at current price levels, while the Mean +1σ threshold for this cycle fluctuates around ~28–30k BTC/day (equivalent to ~3.2–3.5 billion USD ).
No new dark red band appeared after the recent recovery; the profit columns remained in the light gray zone → there was no sign of massive exit from profitable investor groups. When comparing the history and cycle intensity, we see:
The three most recent “overheated clusters”: March 2024, November 2024, March 2025 all recorded profit spikes >1σ with daily peaks of 45–70k BTC ; prices then all went through 12–22% corrections to absorb short-term supply.
In Q3-IX/2025 , although the price maintains a record high, Realized Profit does not exceed 1σ and the bottom of the model gradually increases → characteristic of accumulation at high levels : investors take profits with discipline, offset by real demand (ETF/spot) and moderate leverage room in derivatives.
The discipline of taking profits “steadily” instead of exploding shows good elasticity of demand : the amount of coins taken for profit is absorbed by the market without causing price slippage. The slope of the Mean +1σ threshold line gradually decreases over time (due to a thicker cycle base), making the conditions for triggering the warning increasingly strict ; not reaching the threshold in the context of high prices shows that the active selling force from the profitable group is not enough to create a shock .
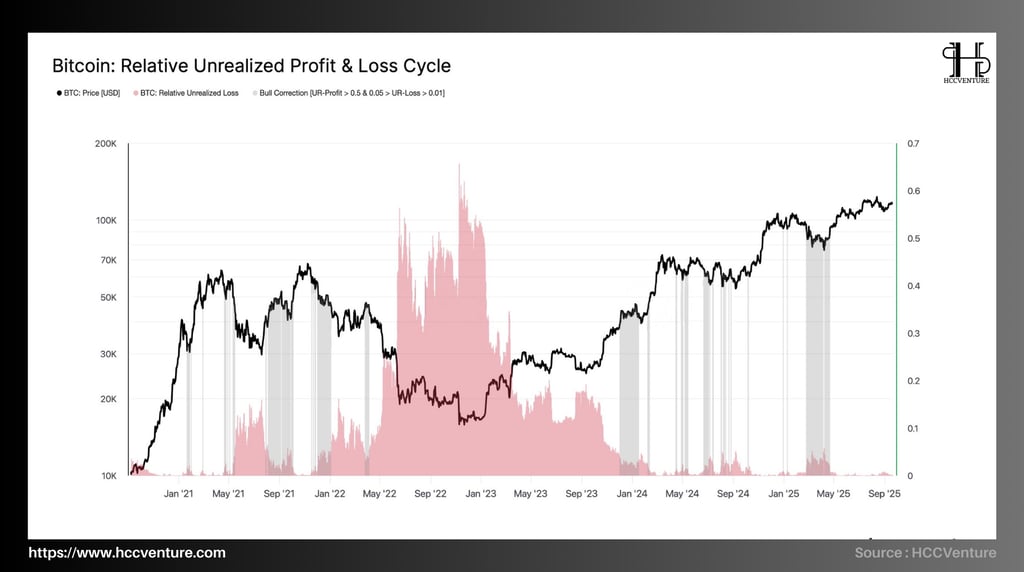

unrealized loss hovering around ~0.5% of market cap — dozens of times lower than the 2018–2020 and 2022–2023 exhaustion phases (typically >30% ). The thin loss margin suggests that forced selling pressure is absent , while risk appetite is supported by widespread profits ( 95% of supply is profitable ).
RUPL normalizes the size of unrealized gains/losses by market capitalization, allowing for comparisons of expected health across cycles. On the chart, the gray zone marks “bull corrections” when unrealized gains (UR-Profit) > 0.5 and unrealized losses (UR-Loss) are in the 1%–5% range —those are dips in an uptrend.
During the recent correction, UR-Loss fluctuated 0.3%–0.8% and then quickly narrowed when the price recovered to >115k . Compared to the 2022 panic peak (UR-Loss exceeded 30% for many consecutive weeks), the current pain is ~98% lower in relative terms. Even compared to the deep “bull corrections” in the 2020–2021 cycle (UR-Loss usually 3%–5% ), the 2025 structure is still significantly milder .
Low UR-Loss shows that most holders are “sitting on profits” and are not under pressure to sell. Short-term pullbacks are mainly due to derivatives rebalancing or disciplined profit-taking , not panic.
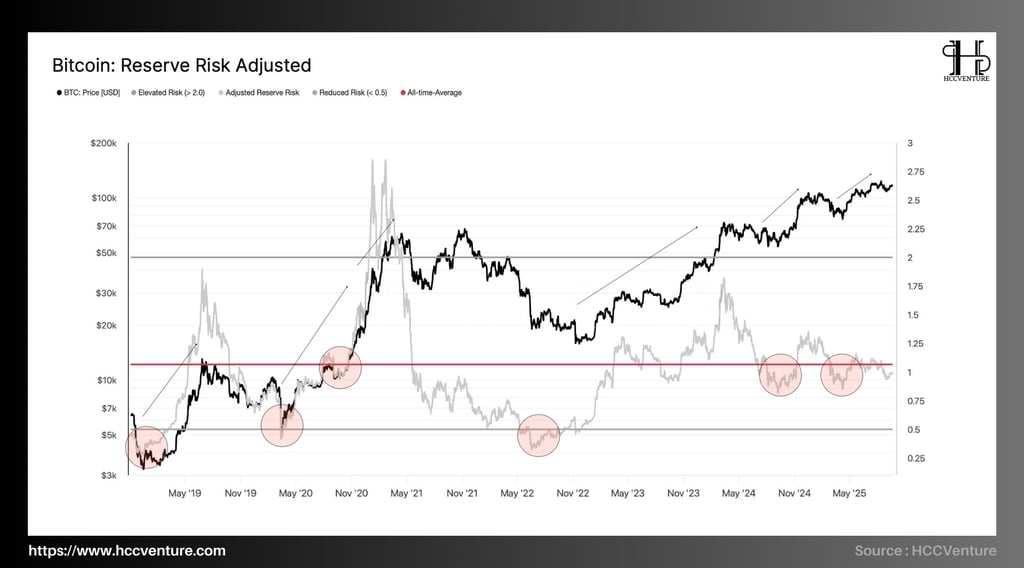
Reserve Risk (adjusted) is anchored at approximately 1.0 – right at the historical average and far from the high risk zone >2.0 . At the price range of ~115–116k USD/BTC , the risk-reward structure over the cycle is clearly tilted towards continued accumulation , with no signs of “overheating” like the 2021 peaks.
Currently, the Adjusted Reserve Risk line has maintained 0.95–1.10 for many months, confirming the mid-bull cycle state and new capital still has to pay a reasonable “risk premium” to buy back coins from steadfast holders, but has not been squeezed by the boom sentiment.
Under the Reserve Risk ~1.0 condition , the probability of an uptrend extension is the base case, which is worrisome when:
Accumulation bias is maintained as long as the index ≤1.2 and the price holds the capital cluster 112–116k USD (thick URPD area).
Increase vigilance when Reserve Risk moves rapidly towards 1.5–2.0 (cyclical profit-taking signal begins to form).
Reloading opportunities are available if there are contractions to 0.8–0.9 while the network profit/loss structure remains shallow, as history shows that “risk-off dips” in uptrends often create new medium-term bottoms.
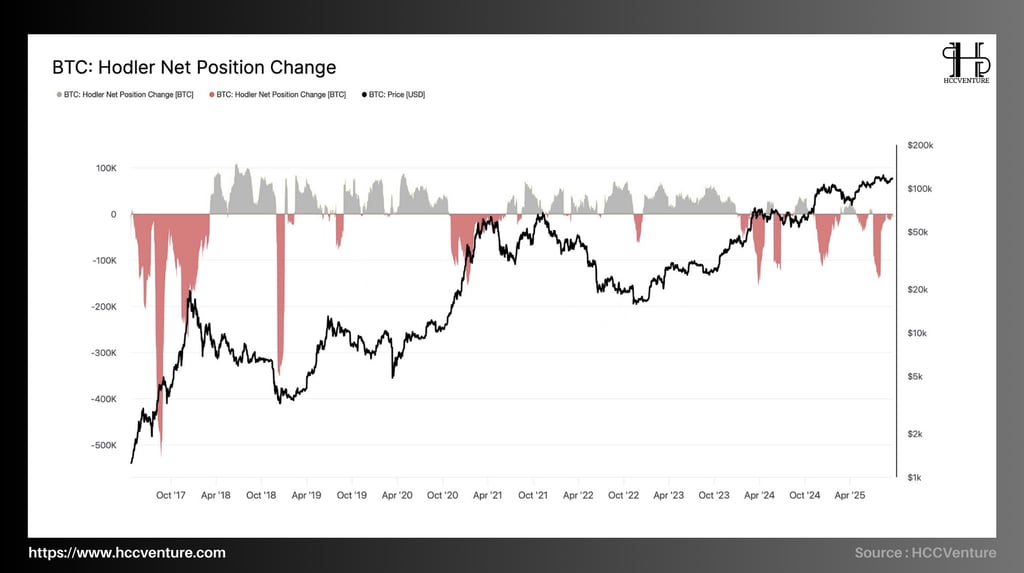

Hodler Net Position Change (HNPC) – an indicator that measures the net position flow of long-term investors (LTH) on a 30-day basis – remains below zero , reflecting a disciplined distribution from long-term holders to new buyers. The current intensity of –60k to –90k BTC/month , far below historical peak dumps, suggests that the selling pressure is not systematic and is being absorbed by the market.
Historical comparison reinforces the above statement:
2017–2018 when HNPC touched –450k to –500k BTC/month when forming the cycle peak – followed by a multi-quarter decline.
Q1–Q2/2021 “overheated” peaks also recorded –200k to –300k BTC/month .
The current cycle (2024–2025) has a distribution amplitude 2–5 times smaller than previous peak cycles, a shorter negative duration , and appears interspersed with equilibrium segments around 0 – more characteristic of reallocation during an uptrend than at the end of a cycle.
HNPC is negative at neutral levels , reflecting reallocation rather than structural divestment . Only if HNPC expands to < –150k BTC/month and SOPR < 1 (realized loss spread) would it imply a phase shift to a multi-week correction. Given current data, the path of least resistance remains to the upside , prioritizing holding/stepping up exposure at 112–116k test cycles , and only raising caution when HNPC + synchronized return metrics deteriorate .
Evaluation and Conclusion
URPD is favoring the scenario of accumulation above to break out , with the control axis at 115.2 thousand USD . Holding this axis, Bitcoin maintains its bullish advantage; losing it, the market only retreats to the “pedestals” that have been accumulated densely – where, according to statistics, the probability of a counterattack by the buyer is still superior.
STH-MVRV 155D confirms bullish bias , not overheated and supported by a thick supply base just below the price. Holding 115.2k helps maintain the advantage, while defending 112-113k is enough to keep the bullish structure intact. Bitcoin's path-of-least-resistance in the short-medium term is still sideways accumulation and then breaking through 118-121k USD.
During the 2017 and 2021 euphoria peaks, young supply typically exceeded 35–40% , while the Old–Young gap narrowed to ≤20 percentage points before reversing. Currently, the ~50 percentage point gap confirms that the market has not entered the maximum distribution phase , and the “blow-off top” risk remains low .
Maintaining Realized Profit < Mean +1σ could lead to the base scenario expanding to the liquidity cluster 118–121k , then 125–128k when marginal money flow increases. Warning only appears when Realized Profit breaks >1σ for many consecutive sessions and the price fails to hold 115.2k ; then “take-profit” pressure could pull retest 112–113k .
The Reserve Risk Adjustment is framing Bitcoin in a sustained bull run , where valuations are unstretched , holding confidence is high , and forced selling pressure is largely absent . With the above operating thresholds, the path of least resistance remains up , favoring a disciplined holding/accumulation strategy with step-wise profit taking.
Bitcoin is stabilizing around $115–116k after the post-FOMC euphoria. On-chain, ~95% of supply is in profit ; the URPD price distribution structure shows the $108–116k zone has been filled with buy-the-dip demand, creating a thick liquidity cushion.
Disclaimer: The information presented in this article is the author's personal opinion in the cryptocurrency field. It is not intended to be financial or investment advice. Any investment decision should be based on careful consideration of your personal portfolio and risk tolerance. The views expressed in this article do not represent the official position of the platform. We recommend that readers conduct their own research and consult with a professional before making any investment decisions.
API & Data : Glassnode
Compiled and analyzed by HCCVenture
Join HCCVenture here: https://linktr.ee/holdcoincventure
Explore HCCVenture group
HCCVenture © 2023. All rights reserved.


Connect with us
Popular content
Contact to us
E-mail : sp_contact@hccventure.com
Register : https://linktr.ee/holdcoincventure
Disclaimer: The information on this website is for informational purposes only and should not be considered investment advice. We are not responsible for any risks or losses arising from investment decisions based on the content here.
TERMS AND CONDITIONS • CUSTOMER PROTECTION POLICY
ANALYTICAL AND NEWS CONTENT IS COMPILED AND PROVIDED BY EXPERTS IN THE FIELD OF DIGITAL FINANCE AND BLOCKCHAIN BELONGING TO HCCVENTURE ORGANIZATION, INCLUDING OWNERSHIP OF THE CONTENT.
RESPONSIBLE FOR MANAGING ALL CONTENT AND ANALYSIS: HCCVENTURE FOUNDER - TRUONG MINH HUY
Read warnings about scams and phishing emails — REPORT A PROBLEM WITH OUR SITE.