


On-chain analysis week 37/2025: Bitcoin and the market silence
Bitcoin is in a relatively large air-gap phase, after a correction of more than 11% from the ATH of 124k USD in August. The collected data shows that the gap is still widening and the price structure is filled with strong buying.
9/15/202510 min read
Market Summary
Liquidity in the Bitcoin market is clearly shifting. Current ETF/ETP flows are hovering around ±500 BTC per day, well below the boom periods in March and December 2024. In the perpetual market, Funding and Long-Side Premiums are hovering around ~$0.36 million/hour, above the cycle equilibrium threshold ($0.30 million/hour) but still well below the overheated peaks above $1 million/hour. This reflects a not-too-hot state, but still poses a risk if demand weakens.
In terms of unrealized profits, the unrealized loss ratio is only ~0.5% of the market capitalization, while deep bear markets in the past often exceeded 30%, the market is still far from the “ systemic surrender ” zone. The 7-day adjusted SOPR is around 1, indicating that the majority of the money flowing on the network is at break-even, without a large-scale wave of selling at a loss.
Short-term holders remain the key factor shaping short-term supply and demand. The proportion of STH supply in profit dropped sharply from over 90% to just 42% when the price fell to $108k, but then recovered to ~60% when the price rebounded to $112k, a neutral but fragile state.
Historically, the current correction of 11.4% from ATH is clearly much milder than previous mid-cycle phases. The biggest risk right now comes from STH’s break-even selling sentiment as prices trade below the 1–3 month cost zone. However, this is a factor that could self-destruct if prices sustainably close above $114,000–$116,000, as short-term supply pressure is largely absent.
On-chain metrics analysis

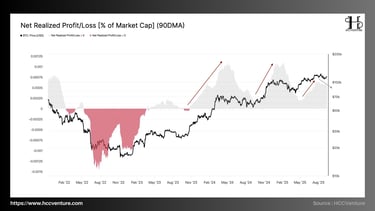
Bitcoin’s on-chain liquidity is maintaining an effective absorption state against both profit-taking and loss-booking forces. The Net Realized Profit/MCap (SMA-90) metric peaked at 0.065% during the August rally and cooled off but remains above its cycle average , confirming that net capital inflows are still flowing into the network .
With URPD filling the $108k–$116k cluster , SOPR (7D, adj.) ≈ 1.00 , unrealized loss ~0.5% cap , current liquidity structure is building and bullish . The thesis is that when price stays above $108k, the accumulation momentum continues and the probability of resuming the uptrend is dominant .
The liquidity measurement framework for absorbing selling through Net Realized Profit/MCap (SMA-90) maintained a peak of 0.065% in August, reflecting the period when new money is ready to buy back large-scale profit-taking supply . Currently cooling down but still high , meaning that net inflow is enough to support the price, and there has not been any "liquidity exhaustion" on the chain. Compared to the breakout period in March & December 2024 , the inflow intensity is currently lower , but more stable , reducing the risk of "overheating and then reversing".
Net Realized Profit/MCap acts as the velocity of “real capital” on-chain. When this metric maintains a higher-than-average zone where SOPR≈1 and unrealized loss is low , we have a sufficient set of conditions for profit/loss taking to be absorbed without breaking the equilibrium . At the same time, the thick URPD in the dominant zone turns the $108k–$116k zone into a liquidity buffer , reducing the volatility amplification from derivatives to spot.
Therefore, the bottleneck is no longer in “lack of liquidity”, but in the activation of expectations : as long as the closing price ≥ $116k , the network will synchronize the interest expectations of STH, leading to positive leverage (funding remains neutral, basis expands moderately, ETF returns net positive) → the uptrend continues .
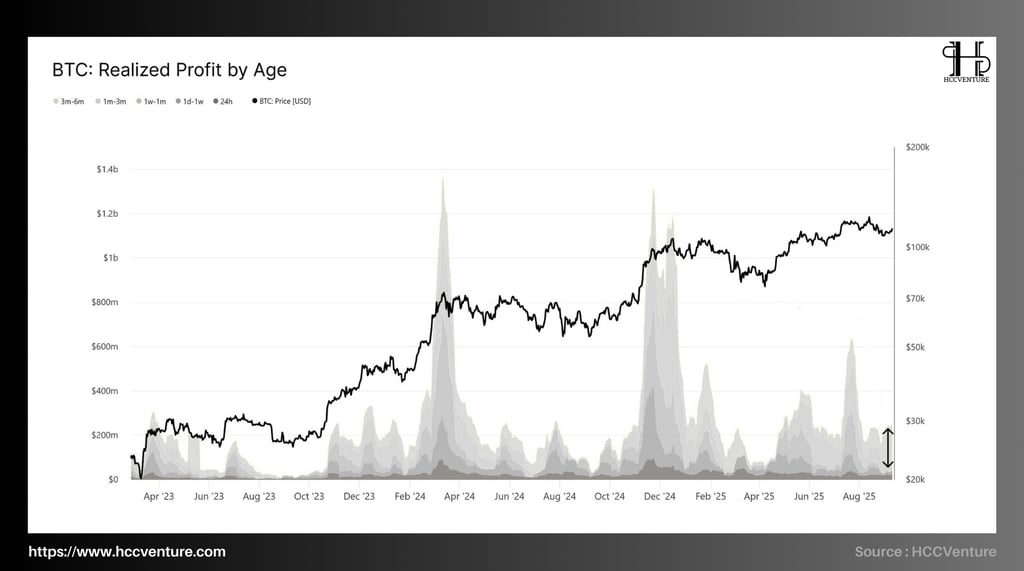
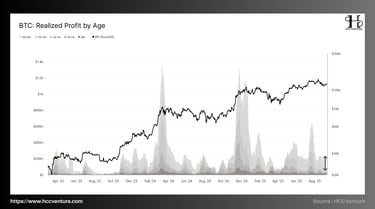
In the most recent period, the group of investors with 3–6 months accounted for the largest proportion of profit realizations, with an average of $180–190 million USD/day (based on 14-day SMA). This is a significant supply force, as investors who bought in the bottom area in February–May 2025 took advantage of the recent recovery to take profits.
The group of small investors aged 1-3 months also started to sell, but on a smaller scale, around $40-60 million USD/day . This reflects a defensive state rather than widespread selling pressure. The group aged under 1 week and 24 hours was almost insignificant during this period, showing that short-term speculative activities have not yet erupted strongly.
Total realized profits across the market peaked at nearly $1.2 billion USD/day during the August rally, then fell to the $300–400 million USD/day range , reflecting cooling capital flows.
During the 2021 bull run, the index reached $1.4–1.5 billion/day , mainly from the 6–12-month and long-term groups. Compared to now, the selling pressure from “seasoned holders” (long-term investors) has not yet broken out. In May–June 2022 (bear market), realized profits almost hit the bottom, showing that investors sold mainly at a loss. Currently, the difference is clear: profit-taking is the main flow, showing that Bitcoin is still in the mid-term growth phase.
Selling pressure is coming from the 3-6 month group, but not enough to break the growth structure. The rotation behavior between the cohort from the Medium-term Group is selling while the new capital is being absorbed. This is a healthy signal because the market does not record a state of panic selling but rather a capital shift.
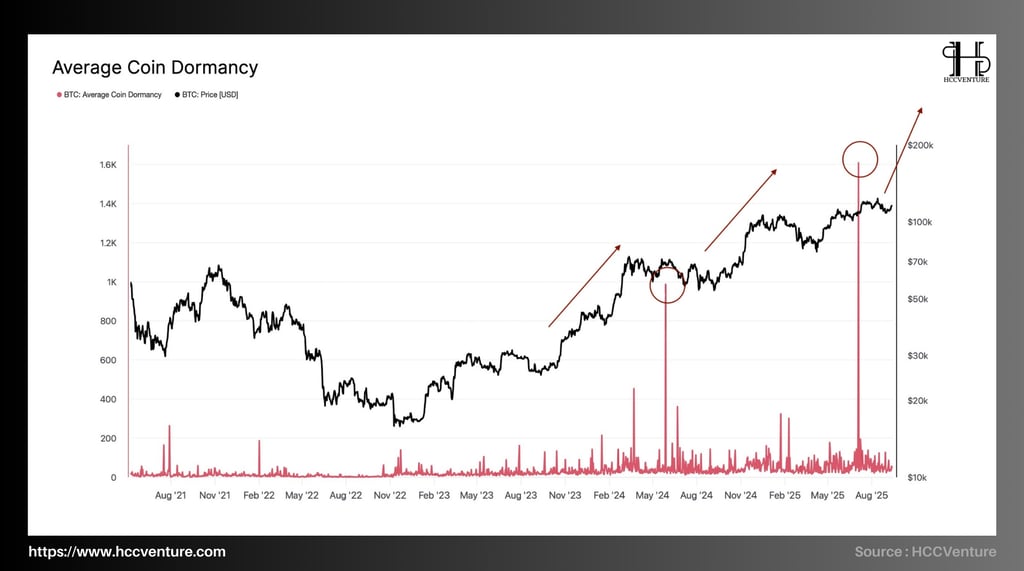
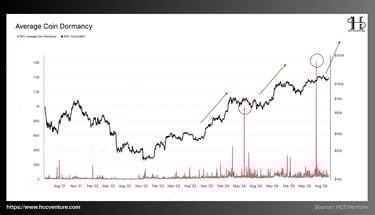
Average Coin Dormancy has experienced several large swings, coinciding with important Bitcoin price milestones:
Short-term peak in late 2021 : Dormancy surged above the 1,000-day moving average, accompanied by a sharp sell-off as BTC corrected from the $65,000 region to below $40,000. This is a clear sign of long-term holders realizing profits.
Accumulation phase 2022 – 2023 : Dormancy drops to a low around 200–400 days, showing that old money is almost out of the market, creating conditions for short-term holders to accumulate and re-establish new capital costs. This is the phase of forming a long-term bottom around $15,000–$20,000.
2024 – 2025 Bull Run : As Bitcoin price crosses $100,000 and approaches $120,000, Dormancy rebounds, now recording spikes of over 1,200 days. This confirms the return of long-term holders to take profits, while also reflecting an increasing level of “distribution.”
Compared to previous cycles, the current Dormancy has not reached its absolute peak like in 2017 or 2021 (when the index exceeded 1,500 days). This shows that the selling pressure from long-term investors has increased but has not reached an extreme level. The growth slope of BTC price in 2025 corresponds to the steady increase in Dormancy, suggesting that the current cycle is in a “partial distribution” phase rather than a massive sell-off.

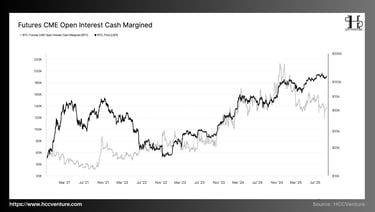
CME cash-margined Open Interest (OI) is currently at ~185–195k BTC , approaching the cycle peak ( historical peak around ~205–210k BTC end-2024 ), ~20–25% higher than the Q2 average (~155k BTC). The OI structure expanded in sync with the recovery from $108k to $112k , confirming the strong selling absorption role of the institutional derivatives block.
Lower exposure to collateralization due to cash-margined rather than coin-margined collateral reduces the “self-amplification” reflex of liquidation sweeps. Derivatives’ Volume Delta Bias has turned positive during the rally, reinforcing seller-exhaustion signals on major exchanges; this situation is consistent with high anchor CME OI – a stable liquidity base for prices.
CME is the benchmark market for institutional money. Cash-margined OI measures the portion of positions that use fiat as collateral , so the risk of liquidation due to BTC price fluctuations is significantly lower than coin-margined. In terms of market micro, when OI is large + collateral is cash , the supply slope from forced closing positions will be shallower, limiting tail-risk and creating conditions for mean-reversion instead of breakdown.
Positive co-movement when every OI expansion is associated with a more sustained price increase (March 2024, December 2024, August 2025). Conversely, only OI contractions >15% are in sync with deep price declines. Currently, there is no large-scale OI contraction .
Seller-exhaustion is a derivatives money flow measure (cumulative volume delta) that recovered from negative to positive in the $108k → $112k span, implying that derivatives makers absorbed supply . This coincides with high anchor CME OI – volatility compression in the direction of flattening the downside.
The current derivatives-led structure favors a more sustained uptrend than a 2018/2022-style downturn. CME cash-margined OI remaining around the cycle peak is evidence that institutional capital is still anchoring positions and hedging , not pulling out.
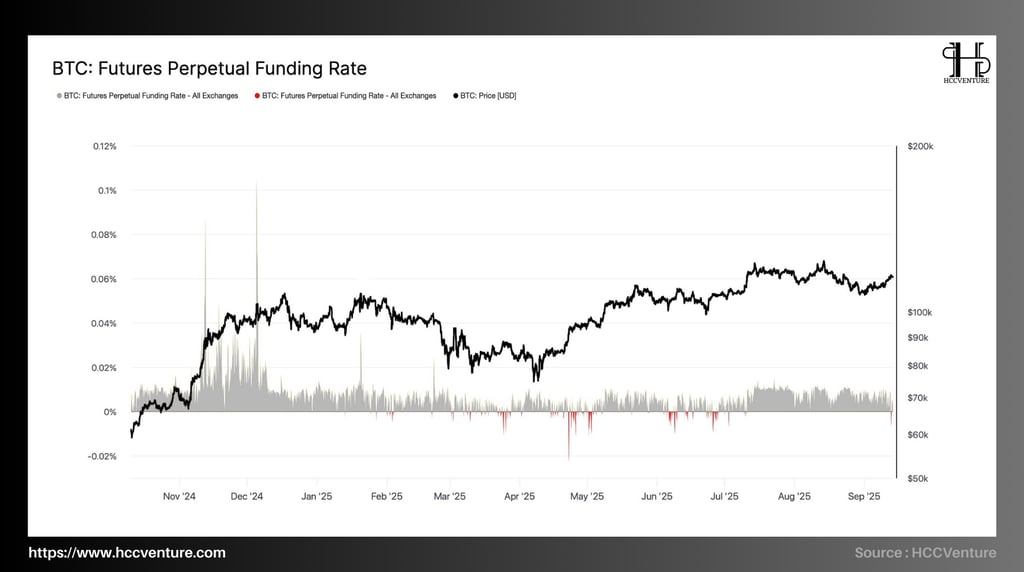
Funding Rate reflects the cost that a Long position holder must pay to a Short position holder (or vice versa) to hold the contract permanently. A high value indicates that the market sentiment is too biased towards buyers (Long-biased), while a low or negative value reflects pressure from sellers (Short-biased).
Funding Rate is currently maintained in the 0.015% - 0.025% range , significantly lower than the peaks of >0.08% recorded in late 2024, showing that the market has escaped overheating, but has not returned to extreme defensive state.
During the strong growth period in late 2024 , the Funding Rate repeatedly exceeded 0.06% - 0.1% , reflecting the overheating of the Long position in the derivatives market. This period coincided with the rally exceeding $90,000 and peaking above $115,000. On the contrary, during the corrections in early 2025 , the Funding Rate repeatedly fell to 0% or negative , indicating increased Short pressure and defensive sentiment, often associated with price declines to the $85,000 - $95,000 range .
The current Funding Rate movement shows a cooling of speculative demand in the derivatives market. This is a positive signal from a sustainability perspective because it reduces the risk of cascade liquidations that occurred when the Funding Rate was too high. However, the fact that the Funding Rate remains positive shows that the Long side is still dominant , meaning that the expectation of price increases still exists, but at a more reasonable level.
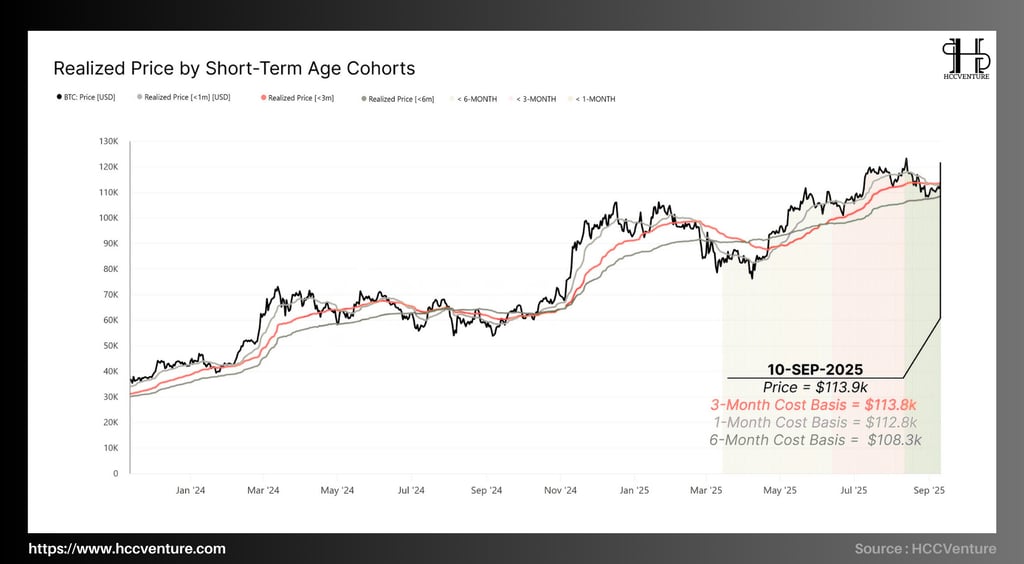
During this period, the role of Short-Term Holders (STH) becomes a key factor in determining the next trend. The Realized Price by Short-Term Age Cohorts indicator provides insight into the average holding cost of new entrants, reflecting potential short-term profit and loss pressure.
As of September 10, 2025 , Bitcoin price is recorded around $113.9k . Three prominent cost bases are anchoring the market:
1 month : $112.8k
3 months : $113.8k
6 months : $108.3k
Interestingly, the current price is trading just above the 1-month cost threshold and almost identical to the 3-month threshold, indicating that the group that bought at the top in the recent quarter has just returned to breakeven. Meanwhile, the group that held for 6 months is still maintaining a significant profit, as the price is ~5.6% higher than the average cost of $108.3k.
Short-term investors are the most vulnerable group. In the previous downturn, their profit rate fell sharply below 45%, creating selling pressure. This group has only just escaped the loss-making state, but the profit margin is not enough to create excitement. With a much lower base cost, the group of investors with 6 months or more still holds significant profits and shows no signs of massive dumping. This reinforces the stability of the market and reflects that the capital flow structure is still long-term accumulation.
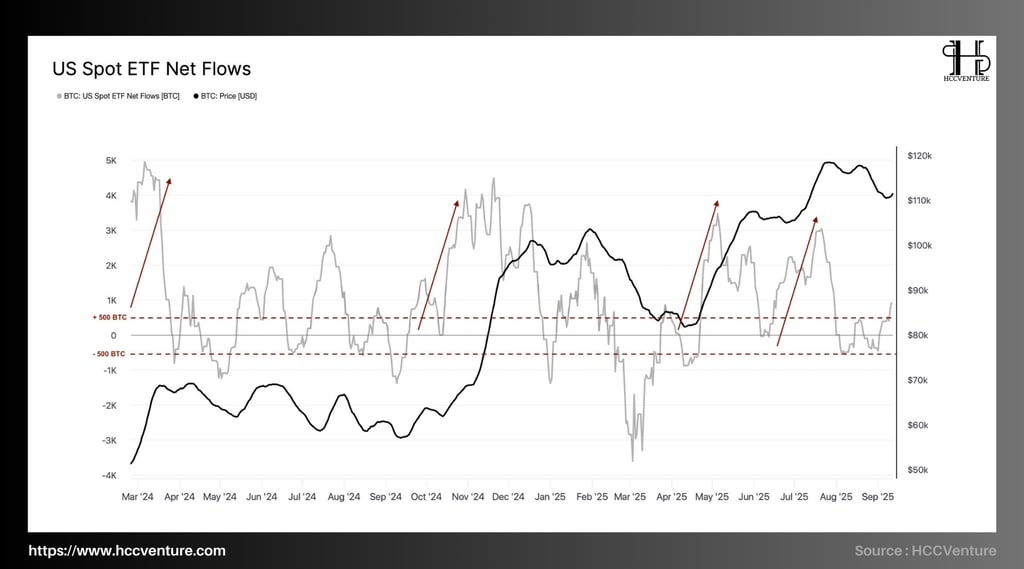
As of mid-September 2025, data shows that net ETF inflows are hovering around ±500 BTC/day (based on a 14-day moving average), which is significantly lower than in early 2024, when net inflows peaked at over +4,500 BTC/day , creating strong growth spurts that directly contributed to pushing Bitcoin prices to new highs.
Institutional investors are no longer net buyers as strongly as in previous periods, causing growth momentum to slow down. When ETFs – which are considered a sustainable source of foreign demand – slow down, the market will become more sensitive to macro factors such as interest rates, USD liquidity or global risk fluctuations. The fact that ETF net flows fluctuate around the equilibrium level shows that cash flows are maintaining an observational state, instead of actively injecting capital.
Current figures confirm that ETF inflows – the core driver of the 2024–2025 Bitcoin bull cycle – are slowing down significantly . If this trend continues at ±500 BTC/day, the market is likely to enter a consolidation phase and sideways volatility instead of explosive growth. In this context, only when ETF net flows recover to exceed +1,500 to +2,000 BTC/day can we expect a new bull cycle with strong institutional participation.
Evaluation and Conclusion
Bitcoin is in a “controlled accumulation correction” phase: despite its price decline from its peak, strong positive ETF net flows over the past week indicate that demand has not been buried; institutional investor confidence remains. Expectations of a Fed rate cut have acted as a key catalyst. If rates fall, the cost of holding Bitcoin will become cheaper, making yield—the derivatives risk and opportunity cost—easier to absorb.
Stablecoin regulations and clearer regulatory frameworks will support a better investment environment, alleviating concerns about regulatory and legal risks. Legislation such as the GENIUS Act is a step forward in bringing transparency to the industry. However, ETF inflows, while positive, need to remain strong – if they lose momentum, selling pressure could be strong from short-term investors (STHs) who are already at a loss or breaking even.
The $114,000-$116,000 zone remains a key level. If Bitcoin can close and hold above this zone, there is a high chance of a fresh bounce, attracting more capital inflows and re-igniting bullish momentum. If the price falls below ~$108,000 and stays below for a few sessions, it could trigger pressure from short-term holders – leading to a possible retest of deeper support. In the positive case (continued strong ETF inflows, clear Fed rate cut, favorable stablecoin policy), BTC could potentially head towards the $130,000-$150,000 zone in the next 1-2 months. If macro factors are unfavorable, the market may simply fluctuate within the current support and resistance zone before choosing a clear direction.
Disclaimer: The information presented in this article is the author's personal opinion on the cryptocurrency field. It is not intended to be financial or investment advice. Any investment decision should be based on careful consideration of your personal portfolio and risk tolerance. The views expressed in the article do not represent the official position of the platform. We recommend that readers conduct their own research and consult with a professional before making any investment decisions.
API & Data : Glassnode
Compiled and analyzed by HCCVenture
Join HCCVenture here: https://linktr.ee/holdcoincventure
Explore HCCVenture group
HCCVenture © 2023. All rights reserved.


Connect with us
Popular content
Contact to us
E-mail : sp_contact@hccventure.com
Register : https://linktr.ee/holdcoincventure
Disclaimer: The information on this website is for informational purposes only and should not be considered investment advice. We are not responsible for any risks or losses arising from investment decisions based on the content here.

TERMS AND CONDITIONS • CUSTOMER PROTECTION POLICY
ANALYTICAL AND NEWS CONTENT IS COMPILED AND PROVIDED BY EXPERTS IN THE FIELD OF DIGITAL FINANCE AND BLOCKCHAIN BELONGING TO HCCVENTURE ORGANIZATION, INCLUDING OWNERSHIP OF THE CONTENT.
RESPONSIBLE FOR MANAGING ALL CONTENT AND ANALYSIS: HCCVENTURE FOUNDER - TRUONG MINH HUY
Read warnings about scams and phishing emails — REPORT A PROBLEM WITH OUR SITE.