


On-chain analysis week 36/2025: Break-even pressure from retail investors
Bitcoin is in a sideways accumulation phase—stable but lacking breakout momentum. STH sentiment is sensitive and showing a slight recovery—institutions are still actively buying; liquidity is stable; cost structure is quite healthy.
9/8/20259 min read

Market Summary
BTC is moving sideways around ~112k in the 104k–116k “void” after a large supply absorption phase. The 108k–116k band has been filled by URPD with bottom-fishing buying, indicating an ongoing ownership reallocation .
STH cost basis by holding age: 1M ~115.6k , 3M ~113.6k , 6M ~107k . Current prices between these levels lead to breakeven pressure as a short-term resistance, while 107k is the systemic risk boundary for the 6M group.
STH in-profit fell to ~42% during the selling phase, then rebounded to ~60% , showing that the market returned to a neutral but fragile state . SOPR (7D, adj.) ~1.0 , Relative Unrealized Loss ~0.5% ⇒ no sign of widespread surrender .
The current phase is to rebalance capital among three groups: (i) new investors who accept short-term accounting losses and close to break-even when there is a recovery; (ii) long-term investors who still hold with a profit status; (iii) institutional/ETF capital flows slow down after a period of excitement lasting ~3.5 months.
Cost Basis by age group & “break-even pressure” when price is below 1-3M , selling pressure to break-even at recovery is real; but maintaining above 6M ~107k shows that the entire capital structure is still stable: the group that invested in the past 6 months has not been forced to exit .
In this thesis, the confirmation point for the next up move is to recapture 114k–116k (1–3M breakeven zone). When that happens, the breakeven selling pressure will weaken and spot momentum will take over .
On-chain metrics analysis
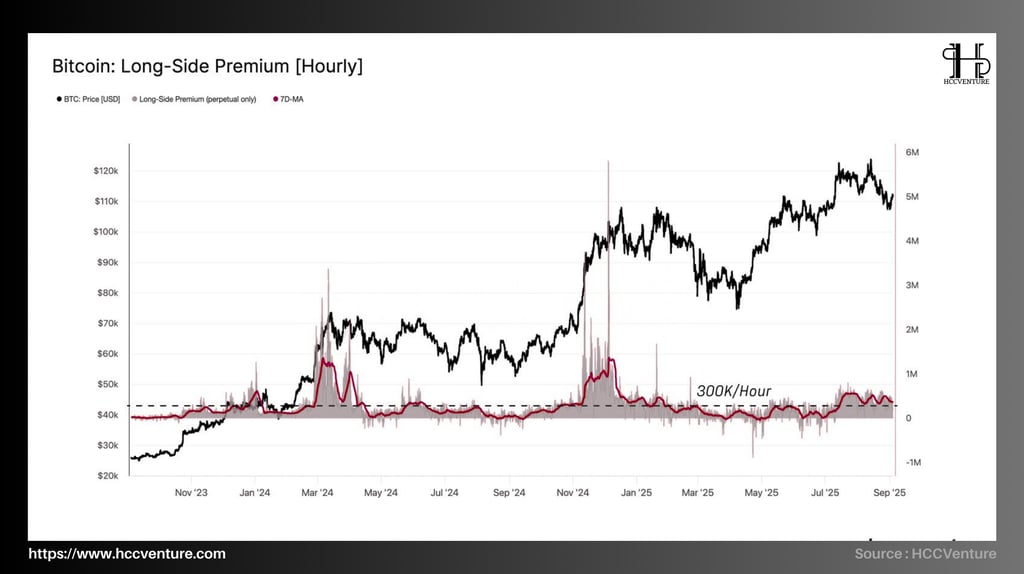
The Long-Side Premium on a perpetual contract measures the hourly cost that the Long side pays to the Short side (funding). In market economics terms, this is the speculator's marginal leverage cost :
High sustained ⇒ strong leverage demand, overheated market ;
Approaching 0 or negative ⇒ leverage demand weakens, momentum decreases .
In the current cycle, Long-Side Premium is around ~$366k/hr , above the $300k/hr boundary but far below the overheated peaks of >$1M/hr seen in March and December 2024. Speculative leverage is weakening as the amplitude of “Spikes” is clearly lower than in the previous boom phase.
In Q1–Q3/2025 , when premium <$300k/hour , the market experienced a prolonged slowdown/sideways due to de-leveraging . Current positions have not fallen back to that zone, but are no longer in a euphoric state .
Leverage demand at a “cautiously neutral” level of $366k/hour suggests that speculators have not completely withdrawn , but are not yet willing to pay high capital costs to pull the trend. As premiums decline , the ability to absorb supply shocks on derivatives weakens; the risk of volatility amplification if spot selling pressure appears. Conversely, a sustained premium >$600k/hour is often accompanied by expanding OI and price momentum .
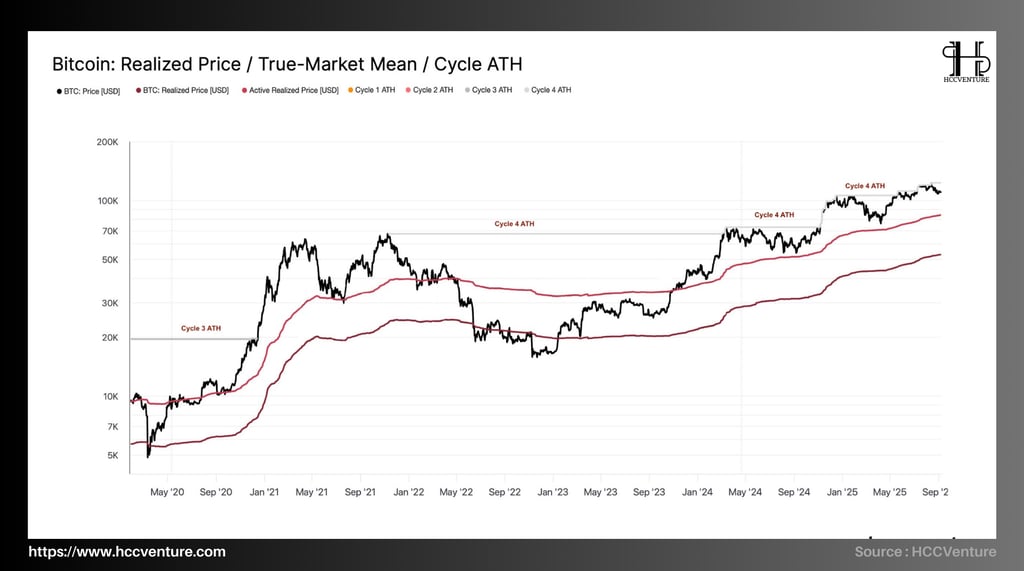

Bitcoin’s current state is in a “base-building accumulation” phase above the system capital price levels (RP/ARP), with no hint of cyclical capitulation. From the data:
Realized Price (RP): ~ $84k–$86k ⇒ market price is higher than RP ≈ +29% to +33% .
Active Realized Price (ARP): ~ $101k–$103k ⇒ margin on ARP ≈ +8% to +10% .
The gap between price and the True-Market Mean of the cycle remains above average but not overheated , significantly smaller than the early 2024 breakout.
When the actual price is higher than the sustainable RP, it shows that the previous cycle usually corresponds to the expansion phase. Currently, the price is ~30% higher than the RP, so there are no conditions for a deep bear market.
In the last two cycles, when price has held above the ARP but not extended beyond the True-Market Mean , the market has typically consolidated sideways for 6–12 weeks before breaking out to retest the ATH. The current picture fits that pattern.
Thin unrealized losses, neutral SOPR, non-hot premium futures — all suggest no widespread liquidation shock . Probability of an extended uptrend is strong as long as it stays above ARP (~$102k) ; then a retest of $116k → $124k is the base case.

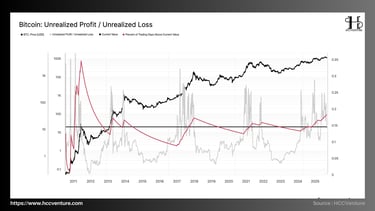
The UP/UL ratio is a measure of the strength of the market's return bias :
>1 : most of the supply is in profit state (risk-on psychology, room for profit taking).
≈1 : balance, trend momentum depends on new money flow.
<1 : hole dominates (stress, high probability of bottom formation).
The current UP/UL is approximately ~0.20–0.22 (from the chart), meaning unrealized profits are outpacing losses , but has not yet approached the extremes seen at the tops of previous cycles.
The price time percentile is ~0.16–0.20 (≈ 80–84% of historical trading days were lower than the current price ). This confirms pricing in the upper half of the cycle , but not yet the “peak percentile” . The time percentile is ~0.8 , implying that prices have moved away from the “fair value” zone of the early cycle, but have not yet reached the extreme upper percentile zone where profit momentum is likely to reverse due to large-scale profit taking.
Identify different contexts:
Maintain UP/UL increasing asymptotically near 0.25–0.30 with price > Active RP ($~102k) → market tends to attract more expectations and retest $114k–$116k → $124k .
If UP/UL >0.4 quickly while funding heats up, realized profit volatility explodes → risk of distribution pullback increases.
Price < Active RP ($~102k) causes UP/UL to contract as unrealized profits turn to losse
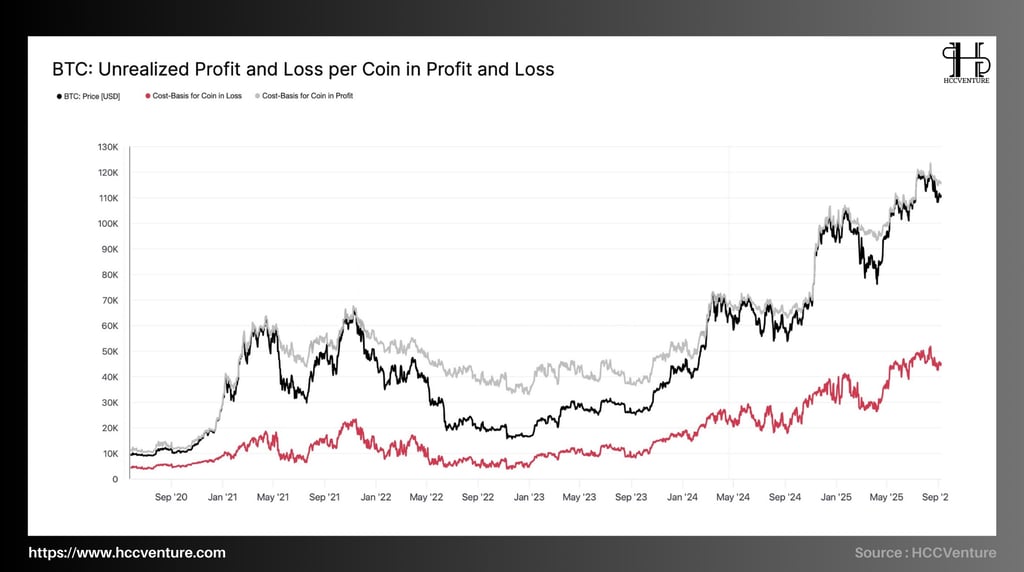

The capital structure is “locking” the bottom higher : CB-Profit is going up and approaching the price to create a shock absorber – forcing the corrections to mainly stop at $104k–$108k to “discharge short-term profits”, rather than creating a structural break down to CB-Loss .
Cost-Basis for Coin in Profit (CB-Profit) : the average cost of all coins currently making profit on-chain.
Cost-Basis for Coin in Loss (CB-Loss) : the average cost of all coins currently losing money on-chain.
At the $111k price zone , the Profit-supply section has a narrow profit margin (the price is only about 3%–5% higher than CB-Profit). This is an area where tactical profit-taking is likely to appear when the price bounces back to $114k–$116k . The Loss-supply block has a capital price very far from the market (difference >120% ), mainly 2022–2023 investors; they are unlikely to be triggered to sell at a loss , creating a psychological cushion for the cycle.
Systemic distribution pressure has not appeared : the price-CB-Profit gap is thin , but the CB-Loss is too far away so there is no chain stop loss . This is consistent with RP/ARP > cost price , SOPR ≈1 and neutral funding .
Bitcoin is in a base-raising accumulation phase with a wide loss cushion , short-term profit-taking is the main risk; no system capitulation signal. Probability of mid-term uptrend continuation is higher as long as the $104k–$108k base is preserved and derivatives flows remain neutral.
The market is in the accumulation phase to raise the base , “buy on correction” works effectively in the $108k–$116k range . There is no sign of system surrender yet; the main risk is short-term distribution when the price hits the STH breakeven levels.
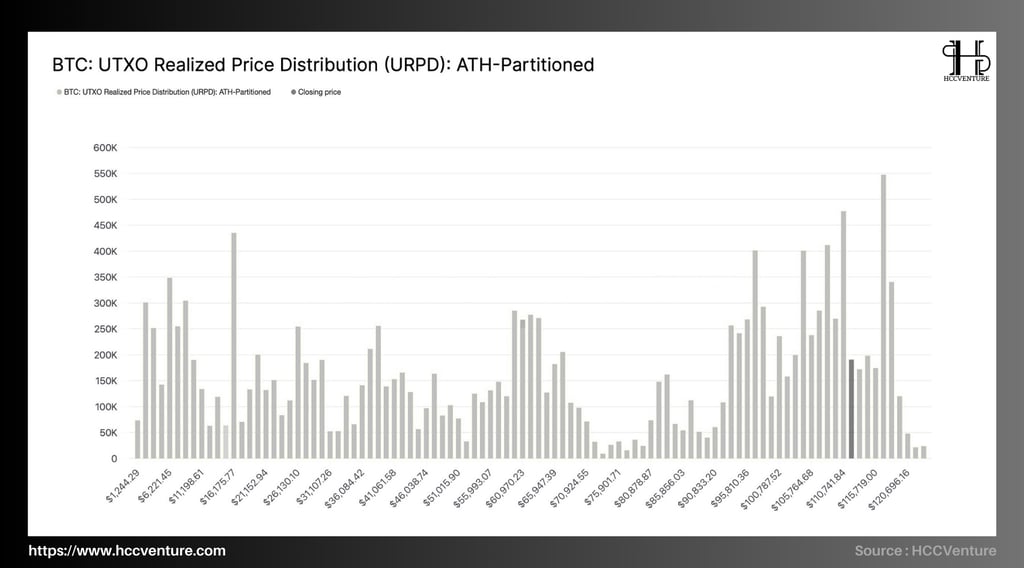
URPD is now dense with newly created UTXOs at $108k–$116k , with the $110k–$112k and $113k–$116k “bins” significantly larger than the mid-August snapshot.
The old supply layer below $98k–$105k is still present but not rising significantly , while above $118k–$124k is a thin overhang zone , meaning the distribution pressure when recovering to the top is not systematic.
Large UTXO clusters at $93k–$100k and $100k–$105k are in slight profit/breakeven ; history shows that when price retraces to these bands, stop loss selling pressure is not large , often accompanied by additional buying to average out .
Above $118k–$124k , URPD records few UTXO formation → if price breaks $116k and maintains, selling pressure due to stuck is insignificant; price can retest ATH $124k quite “cleanly”.

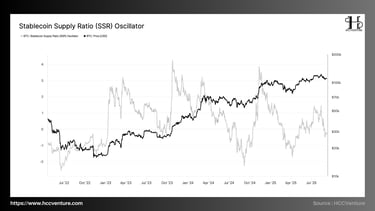
SSR Oscillator is neutral-slightly negative , reflecting the abundance of stablecoins “waiting to shoot” relative to BTC size. Combined with URPD showing real money accumulated in $108k–$116k , SOPR ≈ 1 and neutral funding , the base picture is accumulation to build the base rather than entering a new bear.
SSR Oscillator is currently around 0, slightly negative (~-0.2) — that is, close to neutral but leaning towards a state of a lot of money waiting to be disbursed . In the weakening funding Q1–Q2/2025 : SSR ~ −1.5 to −2.0 (a lot of money waiting to be disbursed) → a premise for the recovery phase that follows.
In the last 3 months, SSR has been moving sideways around [−0.5; +0.5] , while the URPD structure has been filling the $108k–$116k zone strongly and SOPR has adjusted ≈ 1.0 ⇒ an accumulation picture – a balance between short-term supply/sale and spot demand.
Distance to “tension” zone : from current level ~−0.2 to warning threshold > +1.5 (high SSR zone of previous distributions) is still >1.7 standard deviation units ⇒ there is no signal of systematic spot bridge shortage.
Distance to the “super cheap capital” zone : to return to the “favorable spot order firing” condition like early 2025, SSR needs to be < −1.0 ; currently ~0.8 ⇒ potential demand is enough to maintain the price base , but has not created a “force-through” effect to break out on its own without a catalyst (ETF inflow, macro news).
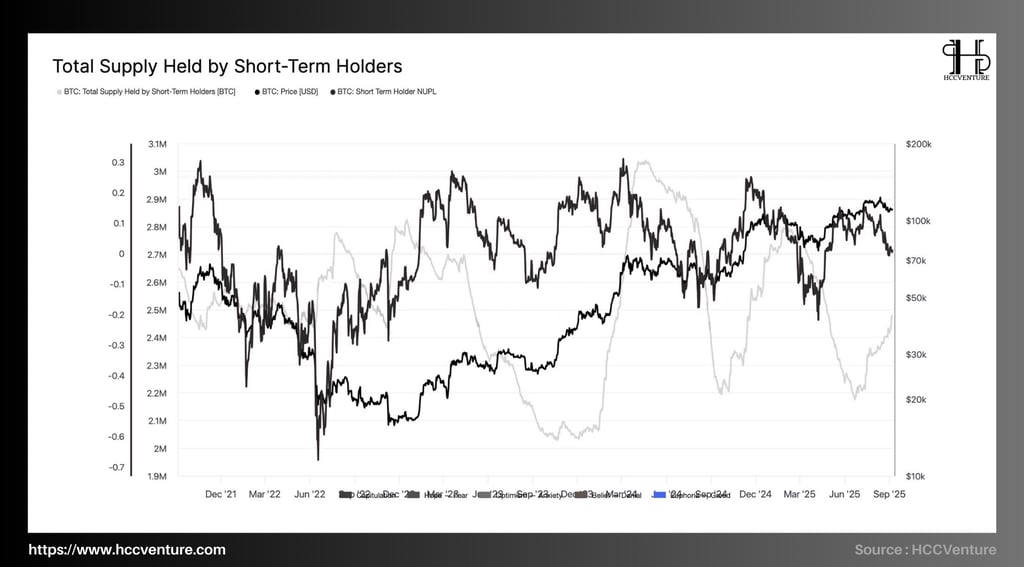
In on-chain analysis, Short-Term Holders (STH) are often considered to be the determinants of short-term market sentiment. Their buying and selling behavior is a strong reaction to price fluctuations, thereby forming short-term support and resistance zones.
The total amount of BTC held by STH is currently approximately 2.4 - 2.6 million BTC , much lower than the historical peak of over 3 million BTC in late 2021. STH's NUPL index has dropped sharply from >0.3 (overheated) to near 0 (neutral) after the correction to the $108,000 region. Currently, about 60% of STH's supply is in profit , compared to 90% just a few weeks ago.
In previous cycles, sharp declines in STH's unrealized profits from >80% to below 50% were often accompanied by selling pressure, but also paved the way for a new accumulation phase.
Currently, the correction has only stopped at about -11% from the peak of $124,000 , which is relatively modest compared to previous cycles (usually adjusting from -25% to -50%). This shows that the market has not entered a state of capitulation, but has only undergone a "healthy" correction phase to cool speculative sentiment.
The low volume of BTC held by STH compared to the historical average shows that short-term capital flows have not returned strongly. In contrast, Long-Term Holders (LTH) still control the majority of circulating supply, contributing to the stability of the long-term uptrend.
Evaluation and Conclusion
Bitcoin is accumulating in a healthy bull corridor , with solid on-chain fundamentals , no systemic stress . The base case for the next 1–2 quarters is a continuation of the uptrend after short-term supply reabsorption with price above RP and ARP , low unrealized losses , no capitulation signs , profit buffer >$10k/coin for the majority of supply.
The Short-Term Holders (STH) ratio in profit has increased from the 42% bottom back to the 60% area, indicating a slight recovery in short-term sentiment — but to consolidate the rally, a break above $114k–$116k is needed for the ratio to rise to >75%. Otherwise, the risk of a return to the $93k–$95k support remains.
SSR (Stablecoin Supply Ratio) remains near neutral (≈0), showing no signs of surplus or shortage of stablecoin cash flow. Potential demand is still waiting and is likely to explode if there is a new catalyst. BTC (URPD) capital price clusters show that cash flow has filled the $108k–$116k zone , meaning Bitcoin is in an “air-gap” and shows a clear accumulation structure, reducing the possibility of a deep bottom.
Disclaimer: The information presented in this article is the author's personal opinion on the cryptocurrency field. It is not intended to be financial or investment advice. Any investment decision should be based on careful consideration of your personal portfolio and risk tolerance. The views expressed in the article do not represent the official position of the platform. We recommend that readers conduct their own research and consult with a professional before making any investment decisions.
API & Data : Glassnode
Compiled and analyzed by HCCVenture
Join HCCVenture here: https://linktr.ee/holdcoincventure
Explore HCCVenture group
HCCVenture © 2023. All rights reserved.


Connect with us
Popular content
Contact to us
E-mail : sp_contact@hccventure.com
Register : https://linktr.ee/holdcoincventure
Disclaimer: The information on this website is for informational purposes only and should not be considered investment advice. We are not responsible for any risks or losses arising from investment decisions based on the content here.
TERMS AND CONDITIONS • CUSTOMER PROTECTION POLICY
ANALYTICAL AND NEWS CONTENT IS COMPILED AND PROVIDED BY EXPERTS IN THE FIELD OF DIGITAL FINANCE AND BLOCKCHAIN BELONGING TO HCCVENTURE ORGANIZATION, INCLUDING OWNERSHIP OF THE CONTENT.
RESPONSIBLE FOR MANAGING ALL CONTENT AND ANALYSIS: HCCVENTURE FOUNDER - TRUONG MINH HUY
Read warnings about scams and phishing emails — REPORT A PROBLEM WITH OUR SITE.