


On-chain analysis week 34/2025: Bitcoin has reached a good profit state
Bitcoin is currently being shaped by cash flow mainly coming from large investment funds and Bitcoin Spot ETFs, so currently nearly 90% of the circulating supply is profitable, reaching the level of conditions appearing in the late stage of the growth cycle.
8/25/20259 min read
Market Summary
More than 90% of the Bitcoin supply is currently in profit, a level that typically occurs at the end of a bull cycle, when profits are large but also come with a lot of risk when taking profits.
The data shows that outflows are higher than inflows, which means that investors are holding their investments for a long time and the market does not need to sell immediately.
Unlike previous panics, the actual losses remained low. This means that selling pressure from weak holders has decreased significantly.
After the strong market withdrawals of 2021–2022, it is now stable around 0–+0.5%/month, showing that long-term capital flows are remaining stable.
The revised Yield Supply Percentage Index shows how "excited" the market is with very high yields, but it also warns that there is still plenty of incentive to take profits.
Bitcoin has fallen about 10% since hitting a high of $124,290 as investors worry the Federal Reserve will be hawkish in its speech at Jackson Hole. The probability of a rate cut next month is just 73%. Analysts still believe the bull market could resume after a correction.
On-chain metrics analysis
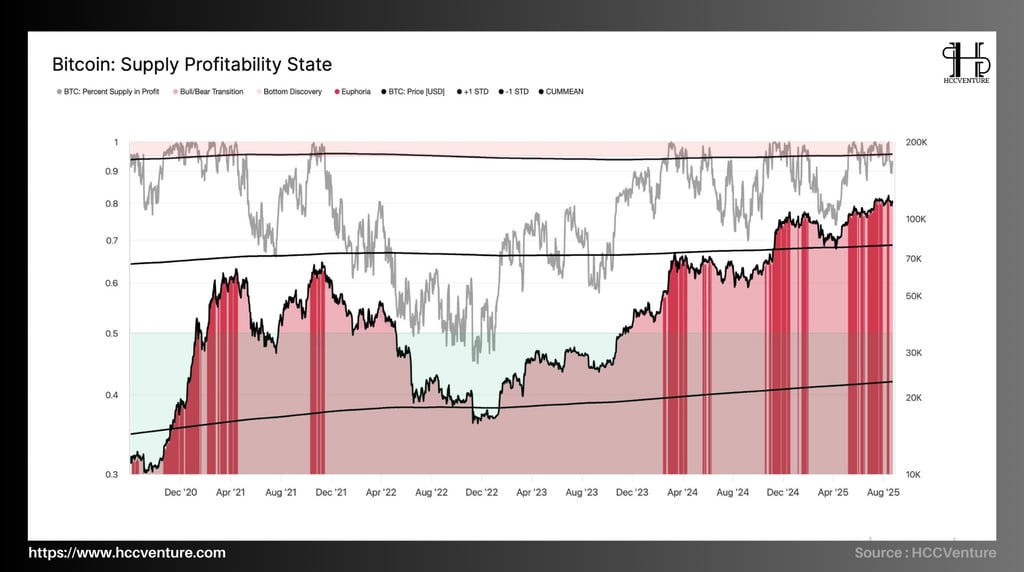

One of the main ways to gauge the “health” of the market and investors is to look at the Supply Profitability State, which shows the percentage of the Bitcoin supply that is profitable.
About 92% of the total Bitcoin supply was profitable by the end of August 2025. This is a high, similar to the euphoria phases of previous cycles. BTC is currently valued between $118,000 and $122,000, down from its record high of $124,400. This ratio has more than doubled (+47 percentage points) in less than three years, from 45% of the supply in profit during the late 2022 downturn.
We can see how this cycle is different from previous cycles:
The market entered a distribution phase and then declined sharply in the 2017 cycle, when the yielding supply ratio reached 95%.
The 2021 cycle also peaked above 94%, but by 2022, BTC's value had dropped more than 50%.
The market is currently at around 92%, the profit saturation threshold. This means that selling pressure and profit taking have increased significantly.
The sharp increase in profit supply shows that most investors are holding unrealized profits. This suggests two main effects: (1) increased pressure to make money by short-term investors, and (2) a dominant "exuberant" mentality, which can easily lead to too much new capital pouring in if demand is not high enough to absorb the selling supply.
The market is very close to the “Ecstasy” zone on the chart (red zone) with a ratio above 90%. This shows that BTC is in the late stages of its growth cycle, when technical corrections or distributions are likely to occur.
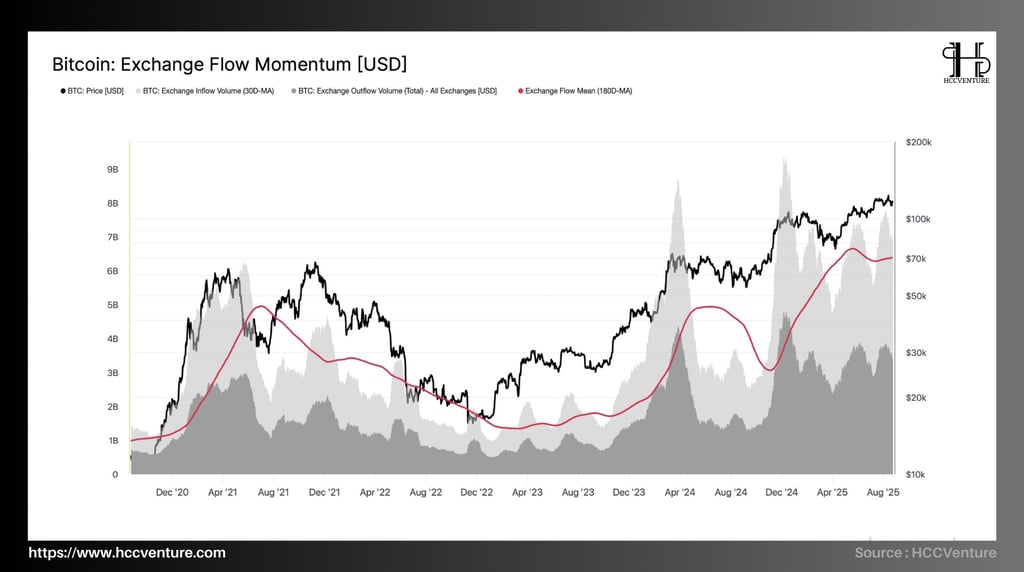
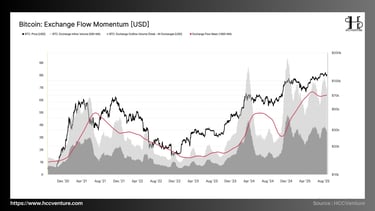
In 2022, Bitcoin inflows will drop below $2 billion/day, making it much harder to sell. At the same time, outflows will increase again due to accumulation. This will coincide with the bottom of the 2022 cycle, when Bitcoin drops to around $15,000.
But starting in late 2023, outflows increased sharply, averaging more than $4–5 billion/day. This suggests that a lot of money is moving to cold wallets (HODL, long-term accumulation). As of August 2025, outflows have stabilized at a high level, while inflows remain around $2–3 billion/day, well below the peaks in 2021 and 2024. This suggests that selling pressure on exchanges has now eased.
Data shows that BTC is in a strong accumulation phase, with outflows outperforming inflows. Institutional investors and whales are still withdrawing funds from exchanges, reducing the amount of immediately available funds. Although BTC remains in the $115,000 to $120,000 price range, the low volume of inflows suggests that people are confident in the long-term uptrend, not just trying to make a quick profit.
Previously (2017, 2021), price peaks and sharp reversals always coincided with peak inflows. Currently, inflows have not spiked, which means the market structure is more stable and there are fewer "panic sell-offs" than before.
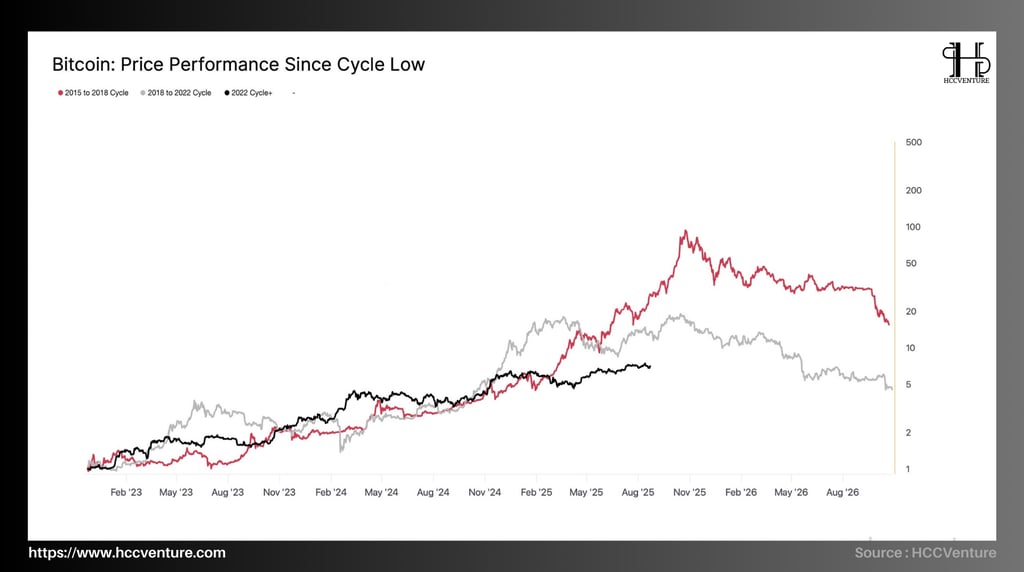
During the 2015–2018 cycle, BTC price increased more than 120x, reaching a high of nearly $20,000 in late 2017. Speculative capital dominated this cycle, which was the most explosive cycle in history.
During the 2018–2022 cycle, BTC price increased by about 22x, reaching a peak of $69,000 in November 2021. The growth rate was much lower than in the previous cycle due to the larger market and narrowing profit margins.
Current cycle (2022–2025): BTC has increased from $15,500 in November 2022 to around $120,000 in July 2025, an increase of about 7.7x. This is a sign of a more mature market with less extreme volatility and more institutional capital flowing in. The growth rate is much lower than the previous two cycles.
The growth rate of this cycle is slower than the growth peak of previous cycles, but has grown steadily over the past 2.5 years without a major correction shock or a long correction shock. The current Bitcoin cycle (2022–2025) has a more mature growth model. The bottom increase is much lower than previous cycles, but the market is still stable, has institutional capital and a sustainable structure.
The lower bottom-to-bottom profit ratio, but the stable and sustained price range are important signs that BTC has entered an “institution-driven market” phase rather than one dominated by small-scale speculation.
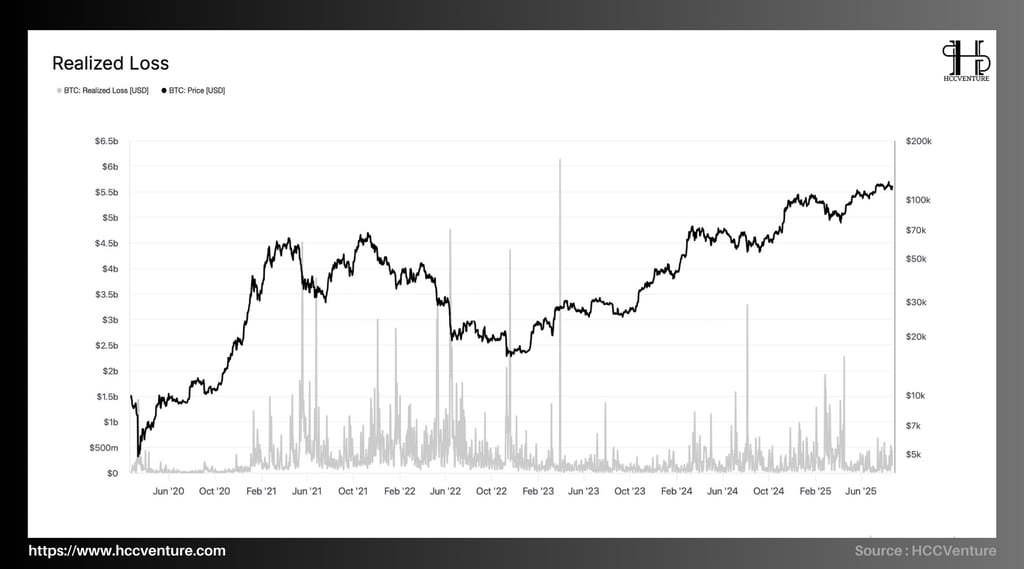

Realized Loss is a measure of the total realized loss when Bitcoin holders sell Bitcoin at a price lower than the average on-chain purchase price. It is an important tool to measure the extent of panic selling, market resilience, and the cyclical phase that Bitcoin is in.
Current Real Losses are still low, only around $200 to $400 million/day, much less than previous sell-offs.
Realized Losses reached over $4.5 to $5.5 billion/day in May 2021, when BTC fell from $64,000 to $30,000. Similarly, during the June 2022 crash, the metric also recorded a peak of nearly $6 billion/day.
When retail investors sell off, capital flows out of the market, which is why realized loss peaks often occur at the bottom of a cycle. After these periods, the market enters a re-accumulation phase, where prices often find a stable bottom. Currently, Realized Losses are very low compared to the 2021-2022 crisis period. This means that selling pressure from losing holders has decreased significantly.
In the 2023-2025 cycle, each major price drop (like when BTC fell from $75,000 to $60,000 in April 2024) only resulted in a Realized Loss of around $1.2 to $1.5 billion, 70% less than what has happened in the past. This shows that the market structure has evolved, and the group of Long-Term Holders is still holding.

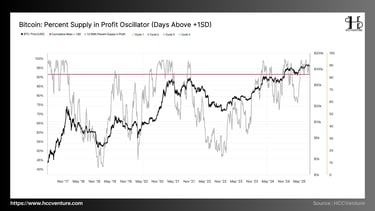
The Percent Supply in Yield Oscillator shows how worrisome the current Bitcoin supply is. It is calculated by looking at the number of days the supply remains +1SD (Standard Deviation) above its long-term average.
As of the end of August 2025, the yield supply ratio remains around 92-94%, well above the +1SD threshold and the long-term average of around 87%. This is a high point, similar to the peak markets in 2017 and 2021 when Bitcoin hit blocks of $20,000 and $69,000, respectively.
It is important to note that the current period has lasted more than 70 consecutive days above the +1SD threshold. This suggests that yields are rising steadily rather than rapidly.
With over 90% of the supply in profit, long-term advisors are likely to put more selling pressure on the market. However, on-chain data shows that outflows from exchanges have not increased much, which means that the distribution is under control. Derivatives liquidity remains “not too hot” (OI is stable around $65 billion), which reduces the likelihood of triggering leveraged sell orders.
Staying above +1SD for an extended period of time means the market is in the late stages of a bull cycle, when prices remain high because people feel optimistic about the economy and money continues to flow in.
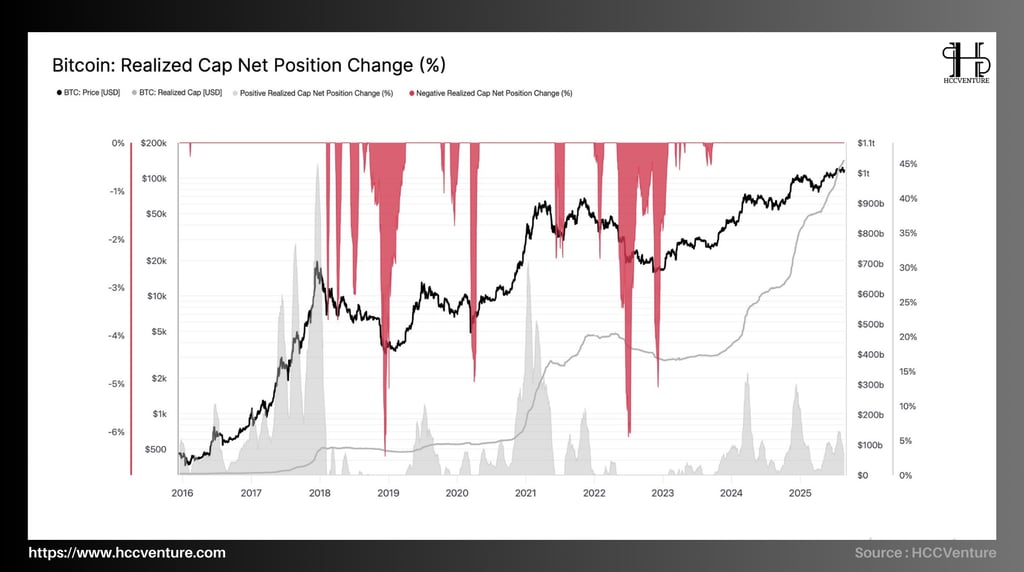
The current Realized Cap Net Position Change shows that Bitcoin is still in a sustained bull run, with long-term capital flows remaining positive. The market has seen a number of capital outflows, but currently, the net capital balance is around 0% to +0.5%, which means there is no more pressure to withdraw capital.
Bitcoin's Realized Market Capitalization has surpassed $1 trillion, surpassing the $800 billion peak reached in late 2021. This is the largest realized market capitalization ever accumulated.
The chart shows that net capital has fallen sharply in 2018, 2020, and 2022, with outflows of -3% to -6% of Realized Capitalization per month. In particular, the 2022 bear market saw the largest net decline in history at nearly -6.5%.
Currently, capital flows are stable at around 0% to +0.5% per month. This means that the market is in a state of accumulation equilibrium, with no major pressure to withdraw capital from the market. The main difference is that although the price has exceeded $120,000, the net loss is not as large as in previous cycles. This means that long-term capital flows are still keeping up with the momentum of sustainable accumulation.
Long-term investors (LTH) are still increasing their holdings as Realized Cap continues to increase without a sharp decline. Short-term investors (STH) are taking profits less than in previous cycles, partly because the market is more mature and has more liquidity. Speculative withdrawal rates have decreased, indicating that the market structure is stable and people are shifting to long-term holdings.
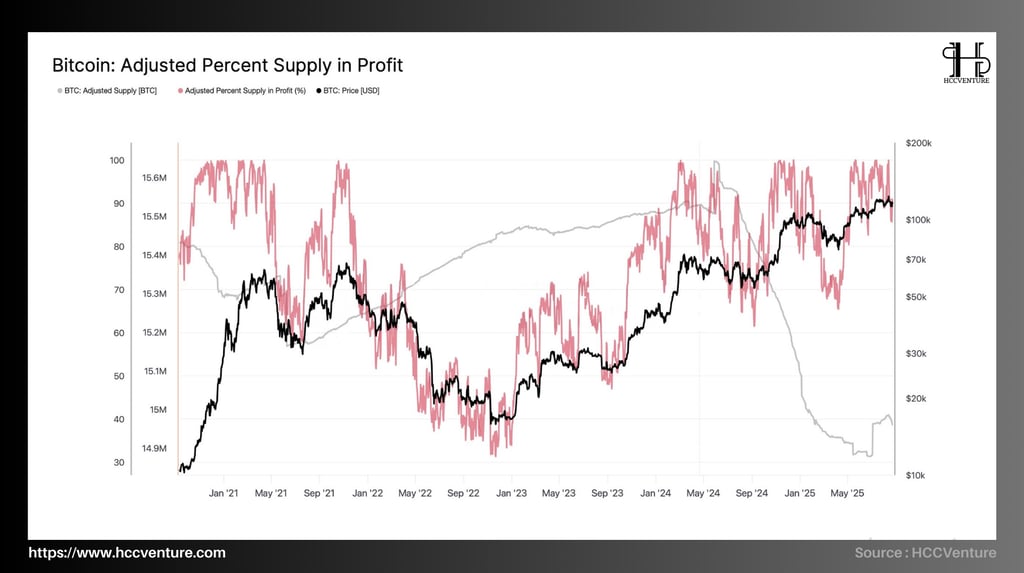
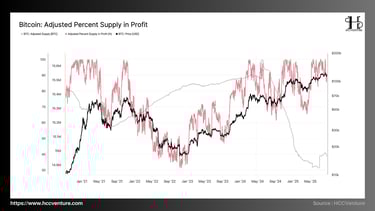
Data shows that the Adjusted Supply to Profit Percentage has remained between 85% and 92% since late August 2025. This is consistent with the fact that Bitcoin's price has fluctuated between $110,000 and $115,000. This area shows a very strong "euphoria" state, which is when most investors are making money.
The network’s profit margin has rebounded strongly, with a ratio of over 90%. This is similar to the growth phases that occurred before the peaks in 2017 and 2021. This means that the proportion of profitable supply has nearly doubled since the bottom in 2022. This shows that the market is strong and has long-term confidence.
When more than 85% of supply is profitable, new capital may find it difficult to increase profit margins as older investors put more pressure on them to take profits. In previous cycles, the market has experienced a sharp correction after the index remained above 90% for a long period of time. This suggests that the current sector may be at risk of a sell-off if the “everyone is making money” mentality leads to profit-taking actions.
However, unlike previous cycles, data from Realized Cap and Exchange Balance shows that there is still a lot of BTC leaving exchanges. This means that the majority of capital is not rushing to leave the market; instead, it is being accumulated for the long term.
Evaluation and Conclusion
The capital flow out of the exchange is still strong, the accumulated interest is high but does not lead to panic selling, showing that the Bitcoin market is in a state of sustainable accumulation. Long-term investors (LTH) can continue to support the market against short-term fluctuations.
Fed policy and Powell's speech at Jackson Hole are likely to have a strong impact on investor sentiment. The reduced expectations for rate cuts are what caused BTC to correct 10%. However, this could also create a buying opportunity if sentiment recovers.
The absorption of over $100 billion through SEC-approved Bitcoin ETFs and the increase in investment structures from institutions like BlackRock and large funds like the Harvard Endowment have put Bitcoin in the macro asset orbit, which is the foundation for price preservation and long-term growth.
Profitable supply >90% is both a sign of strength and a warning signal of distribution. Whether the market will correct slightly to balance or enter a deep pullback remains the key question in the short term.
Disclaimer: The information presented in this article is the author's personal opinion on the cryptocurrency field. It is not intended to be financial or investment advice. Any investment decision should be based on careful consideration of your personal portfolio and risk tolerance. The views expressed in the article do not represent the official position of the platform. We recommend that readers conduct their own research and consult with a professional before making any investment decisions.
API & Data : Glassnode
Compiled and analyzed by HCCVenture
Join HCCVenture here: https://linktr.ee/holdcoincventure
Explore HCCVenture group
HCCVenture © 2023. All rights reserved.


Connect with us
Popular content
Contact to us
E-mail : sp_contact@hccventure.com
Register : https://linktr.ee/holdcoincventure
Disclaimer: The information on this website is for informational purposes only and should not be considered investment advice. We are not responsible for any risks or losses arising from investment decisions based on the content here.

TERMS AND CONDITIONS • CUSTOMER PROTECTION POLICY
ANALYTICAL AND NEWS CONTENT IS COMPILED AND PROVIDED BY EXPERTS IN THE FIELD OF DIGITAL FINANCE AND BLOCKCHAIN BELONGING TO HCCVENTURE ORGANIZATION, INCLUDING OWNERSHIP OF THE CONTENT.
RESPONSIBLE FOR MANAGING ALL CONTENT AND ANALYSIS: HCCVENTURE FOUNDER - TRUONG MINH HUY
Read warnings about scams and phishing emails — REPORT A PROBLEM WITH OUR SITE.