


On-chain analysis week 33 / 2025: Bitcoin and the mission to reach the peak of capitalization
Bitcoin continues to be healthy while volatility expectations in the options market remain compressed. BTC price is trading around ~115k (down single digits from all-time high), while ETH is ~4.23k – only about 12–13% away from 2021 ATH.
8/19/202511 min read
Market Summary
The profit supply ratio remains above the ~90% range and is supported by a +1σ margin. This shows that the vast majority of investors are still not using leverage.
STH-SOPR has hit grain 1 multiple times and bounced back, the dips to around 0.98 are short term not long term.
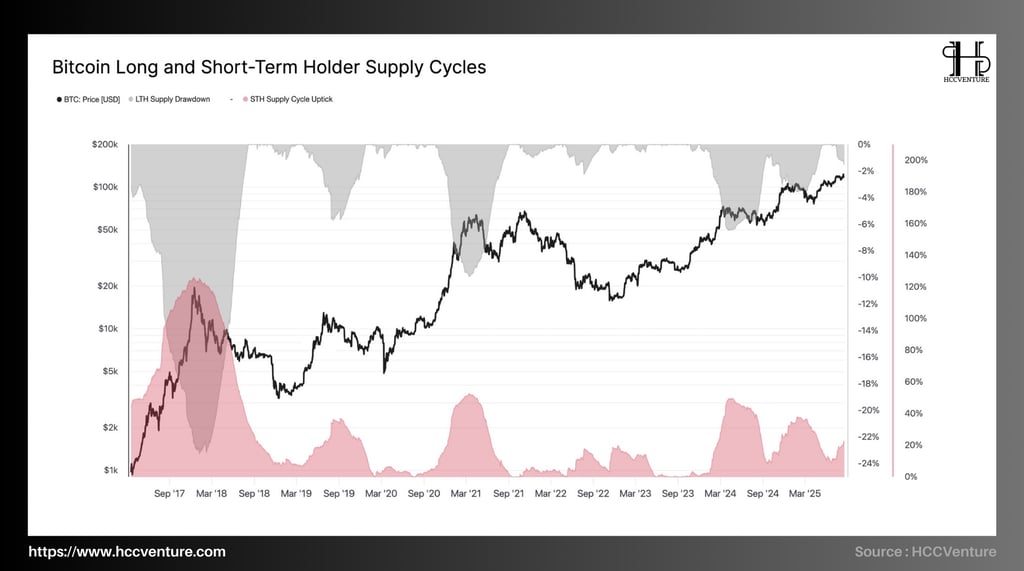
LTH supply remains at an all-time high, while STH is slowly increasing but remains below its 2021–2022 peak. The "LTH Supply Drawdown / STH Uptick" indicator pair is in a net position expansion phase.
Euphoria Zone has not seen any signs of sustained euphoria; Actual Return > Average +1σ occasionally appears with weaker intensity in cycles.
On-chain metrics analysis
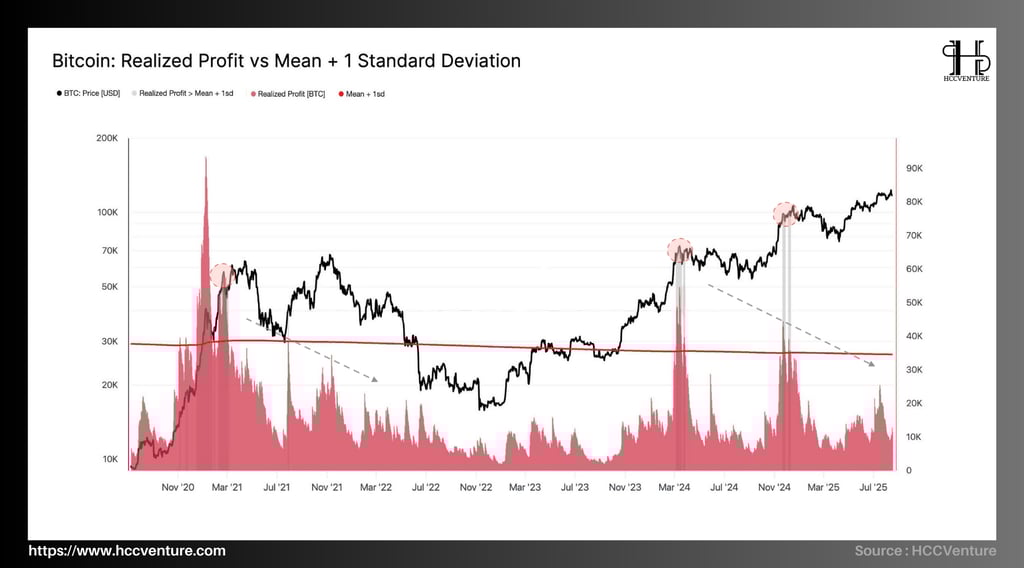
The Bitcoin market is currently at a critical juncture, with on-chain indicators showing a sharp increase in realized returns. Bitcoin's realized returns vs. Mean + Standard Deviation 1 show that when returns increase rapidly, there is often more selling pressure and price correction than in the past.
When Bitcoin hit $64,000 in early 2021, realized returns surpassed the +1SD average with a spike of over 100,000 BTC, meaning the cycle peaked for a short period. The price then quickly dropped to around $30,000, a 50% drop.
By the end of 2021, the same thing happened: realized returns peaked at around $69,000, kicking off a bear market that lasted through 2022. Realized returns crossed the +1SD line again in early 2024, when BTC crossed $70,000. In fact, realized returns were above the statistical average at the same time as the peak selling pressure zone, causing prices to fall.
Bitcoin's current value is between $82,000 and $84,000, well below the $82,000 to $84,000 peaks in 2021 and 2024. This means people are still taking profits, but not as much as they were before. This shows that the long-term holding sentiment is still strong.
Realized returns have increased, but not as rapidly as at previous peaks. This shows that selling pressure has decreased significantly compared to 2021 and 2024. The +1SD moving average has become an important reference point. Bitcoin has tested this level several times over the past 18 months, but each time, there has been less selling than before. Investor behavior has changed dramatically. The long-term holding ratio has increased, meaning there is less selling pressure even as the market approaches psychological resistance.
Bitcoin is expected to be worth around $118,000 to $120,000 by mid-August 2025. This is just 6-7% below its all-time high of $128,000. On the other hand, the total value of all cryptocurrencies has surpassed $3.9 trillion, of which BTC accounts for around 50.2%.
When the market is strong (like 2017, 2021 and now 2024-2025), LTH supply usually drops sharply as people take profits. The current decrease in LTH supply is around -4% to -5%, lower than the peak of the 2021 cycle (down nearly -8%). This shows that although LTH selling pressure is increasing, it has not increased too much yet.
Currently, LTH supply is being withdrawn from accumulation, indicating controlled distribution behavior rather than massive sell-off. During the 2022–2023 correction period, LTH held almost all of the supply (stable >70% of total circulating supply). However, currently, the market is clearly in a "re-allocation" phase, preparing for a new cycle peak.
STH supply peaks (red) typically occur right before or during short-term price peaks. The STH indicator is currently rising, but is still well below its 2021 high. The new STH supply ratio is only around 60% to 70%, well below the 200% peak in April 2021.
The current supply-demand structure shows that the market is not "overheated", and the bullish trend is still the most likely scenario in the medium term. Short-term demand is increasing, but has not yet reached the risk warning zone as in 2021. This means that the market is still in a balanced growth phase. LTH is making money, but has not yet been sold off, which shows strong long-term confidence.
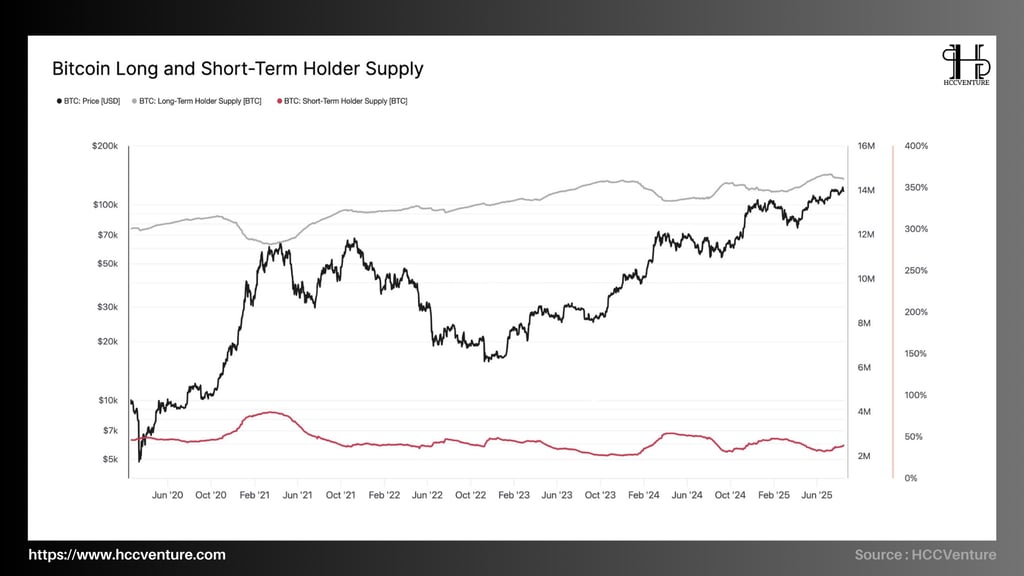
Bitcoin (BTC) is trading between $98,500 and $99,200 as of mid-August 2025. This is close to the psychological $100,000 mark. The current price action is consistent with key on-chain indicators, especially the long-term storage supply (LTH Supply) and short-term storage supply (STH Supply). These are factors that influence the stability of price trends.
The long-term investor supply is 14.15 million BTC, representing 72.5% of the total circulating supply. Long-term holdings have increased by about 31% since the bottom in 2018, when it was around 10.8 million BTC. The long-term supply continues to set new records, although it peaked in 2021 at around 13.5 million BTC.
On the other hand, the short-term investor supply is 2.88 million BTC, accounting for 14.8% of the total circulating supply. During the 2021 bubble, this index reached 5.2 million BTC, which is about 45% lower than the recent peak. This shows that short-term capital is drying up, short-term selling pressure is easing, and the market is moving into an accumulation state.
The “diamond hand” trend for LTH continues: buy and hold. The fact that LTH supply is at an all-time high while the price is nearing $100,000 shows that people are confident that the bull run can continue rather than taking profits early.
The sharp drop in STH supply shows that the selling pressure from this group is weakening. Previously, when the STH supply dropped below 3 million BTC, the market often entered a strong growth phase, such as after 2019 and late 2020.
LTH has locked up more than 72% of BTC, meaning there is less free liquidity (liquid supply) in the market. This makes demand more likely to exceed supply, pushing the price even higher. Bitcoin is in a long-term redistribution cycle as STH is no longer the most important factor and LTH is increasing rapidly.
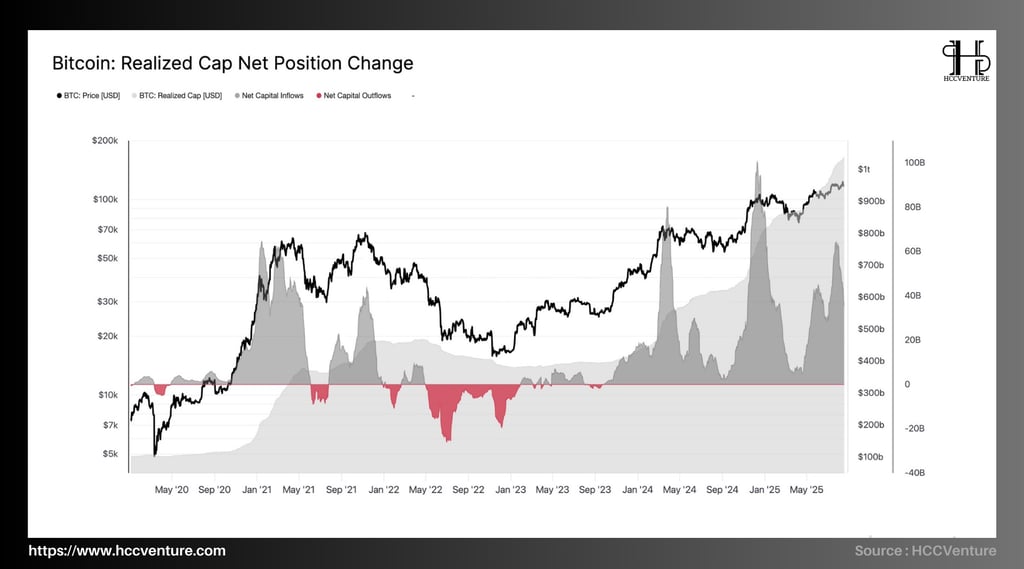
As of mid-August 2025, Bitcoin's realized market capitalization has reached $570 billion, 45% higher than its December 2022 low (around $390 billion). Bitcoin is also trading at a new record high, around $105,000 to $107,000.
After the US approved a Bitcoin ETF in early 2024, the market saw record net inflows, with many months reaching over $25-30 billion. The market capitalization is increasing every day and is currently at $570 billion, an all-time high. This also aligns with Bitcoin's strong potential to rise to $105,000, well above its peak of $69,000 in 2021.
With steady net inflows and continued growth in real capital, it is safe to say that the Bitcoin market is attracting more new investment capital than ever before, especially from institutional investors and ETFs.
Realized capitalization only grew by about $200 billion in 2020–2021. In contrast, the current cycle has seen realized capitalization grow 1.5x faster and stronger. Realized capitalization continues to set new records for the amount of BTC bought at high prices that is still being held, not sold. This shows that growth is ongoing.
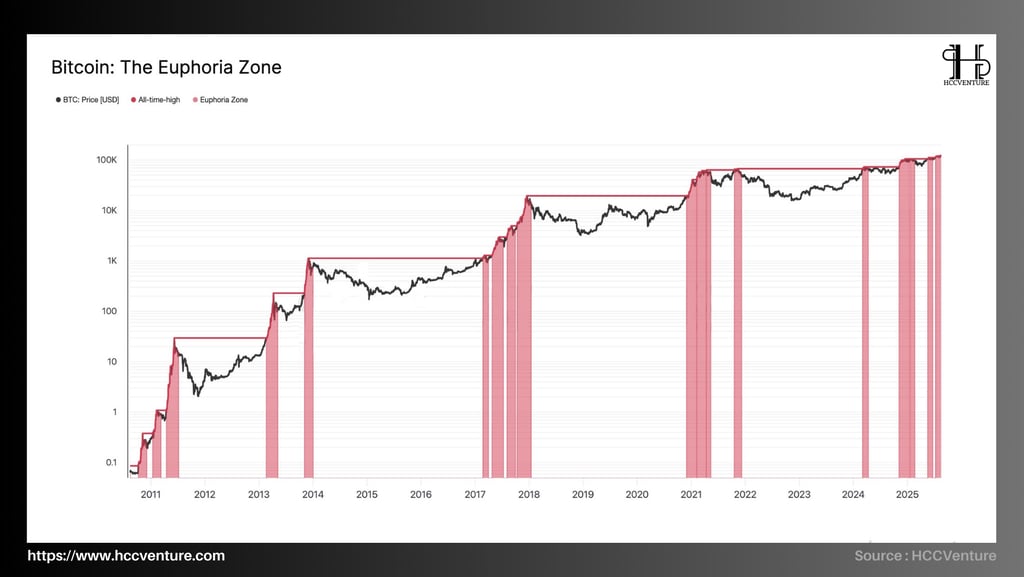
The last time BTC touched the Euphoria Zone was in March-April 2021, when the price hit $64,800 and then plummeted to $29,000 (a drop of nearly 55%). Bitcoin broke its all-time high of $69,000 in the most recent cycle (Q1 2025) and quickly surged above $100,000. The Euphoria Zone indicator is also constantly on, indicating that the market is in a very euphoric state.
From 2013 to 2017, every time Bitcoin hit the Euphoria zone, it surged at the end of the cycle and then fell 70% to 85% during the correction period.
Similarly, Bitcoin rose to $64,800 in 2021, triggering the Euphoria Zone, and then fell 55%. However, there were two peaks in this cycle. The second peak was in late 2021, when the price reached $69,000.
Bitcoin has had its strongest growth since 2021, and so far in 2025, the price has increased by 49% from its previous high of $69,000. The current increase is larger than the increase in 2017, when BTC surpassed the 2013 peak (+40%). This shows that the euphoria cycle has started again.
If we look at the past, there is a high probability of a major correction in the next 6 to 12 months as we enter the Excitement Zone. The correction can range from -40% to -60%, similar to previous cycles. However, before the correction, the price can continue to rise to a new all-time high (ATH), which is usually 30% to 50% higher than when the Excitement Zone was first reached.
Bitcoin is currently in a euphoric state, similar to 2013, 2017, and 2021 before the big drop. The market is acting like a late-cycle bull market, with prices above $100,000. This includes strong acceleration, extreme FOMO, and a large amount of retail capital.

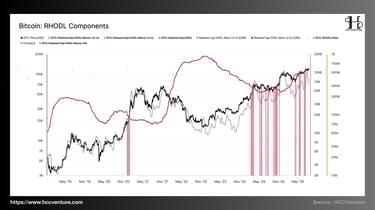
In previous cycles, when the RHODL Ratio reached the extreme high zone (red on the chart), Bitcoin often entered a distribution phase, leading to a deep correction (2013, 2017, 2021). Currently, the ratio is accelerating again, in parallel with the Bitcoin price reaching a new ATH. This is a sign that the market is entering the final stage of the growth cycle .
The RHODL Ratio currently remains around the same highs as the 2017 and 2021 cycle peaks, reflecting the rapid increase in capital flows from short-term investors.
HODL Waves (1d–1w) accounted for a strong increase in Q2/2025, reaching the highest level since the bull-run period in late 2021.
HODL Waves (1y–2y) have a slight decrease, indicating that long-term holders have started to redistribute to new cash flows.
The biggest difference in the 2025 cycle is that Realized Cap continues to increase strongly , instead of stagnating like previous cycles. This reflects that institutional capital (ETFs, investment funds) is playing an important role, replacing the small distribution behavior of retail.
The sharp increase in the 1d–1w HODLers group is the result of new FOMO money flowing into the market, while the long-term group is reducing its proportion but has not yet retreated completely, showing that the selling pressure has not yet exploded. Realized Cap and institutional participation help the growth momentum to be more sustainable, but the sharp increase in short-term HODLers still shows the risk of a deep correction in the medium term.
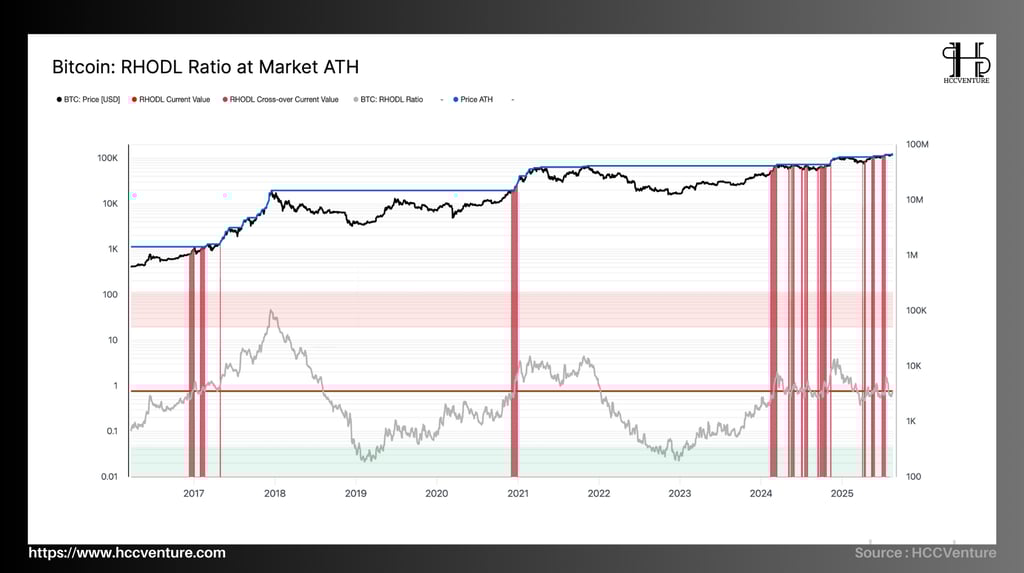

The current RHODL Ratio is hovering around 2.0 – 2.2 , which means it is in the red zone (high-risk zone). Historically, when the RHODL Ratio is above 2.0, BTC is always approaching the cycle top. Compared to previous cycles:
2013 : RHODL Ratio peaked at ~4.5 when BTC price was ~1,100 USD.
2017 : RHODL Ratio ~3.8 when BTC price reached $19,700 .
2021 : RHODL Ratio ~3.5 when BTC sets ATH 69,000 USD.
Currently 2025 : RHODL Ratio has just reached ~2.0 but BTC price has surpassed the $100,000 mark, reflecting that speculative money flow (short-term holders) has not completely escaped, showing that the growth cycle is still continuing but has entered the high valuation zone.
Short-term investors (HODL < 1 month) are holding a higher proportion in Realized Cap, showing strong profit-taking pressure. Meanwhile, long-term investors (> 1 year) still hold a large holding ratio, with no signs of large-scale distribution like in 2021, showing that the long-term trend is still sustainable.
Bitcoin is in a strong “late-stage bull market” zone, but on-chain indicators signal high risk as the RHODL Ratio exceeds 2.0. Historically, cycle tops typically form when the RHODL Ratio approaches the 3.5 – 4.0 zone , meaning the market may have room to grow by another 30 – 50% before reaching its peak.
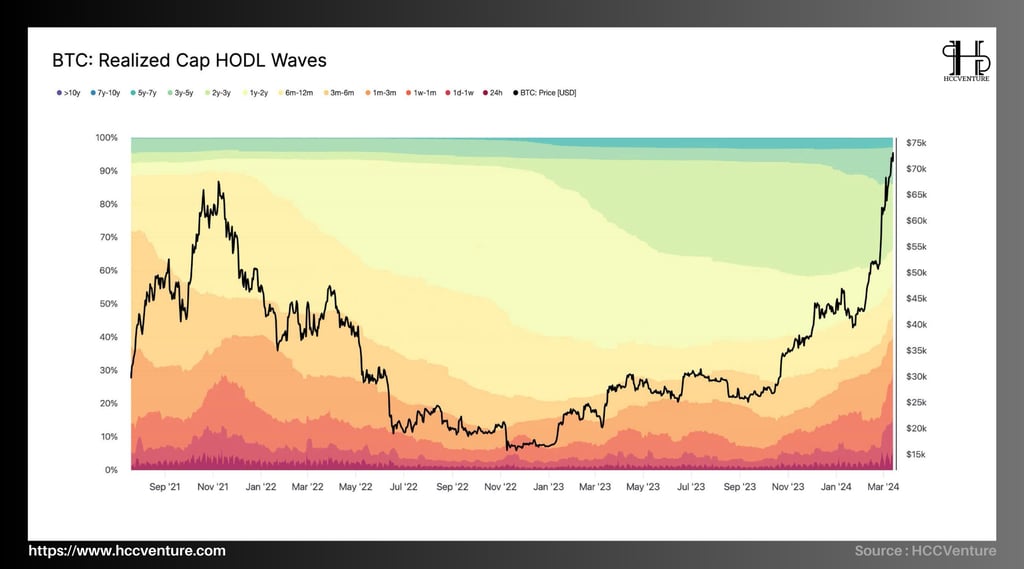
Long-term holders (5+ years) now account for about 28% of the market cap, an all-time high. This suggests that spot market supply is becoming increasingly difficult to find. On the other hand, short-term holders (1 week to 3 months) account for only about 12 to 15% of the total. This is much lower than at the beginning of the 2021 bull run, when they accounted for more than 25% of the total.
When the price hit $69,000, nearly 40% of investors were short-term. However, that number is now less than half, indicating a big difference in the quality of capital flows. The sharp increase in the group holding for more than a year, especially for more than five years, shows that the market structure is very solid. This is very different from the stages before the speculative bubble was the norm.
Investors are shifting their cash flows from short-term to long-term investments, which shows that they believe in sustainable growth and minimize the risk of a sell-off. The market is entering a fundamental growth phase instead of a bubble as real capitalization continues to hit new highs and the proportion of short-term investments is decreasing.
Current flows suggest that the bullish trend remains strong, driven by long-term investors. This is especially true as the supply on the exchange is at its lowest level since 2018.
Evaluation and Conclusion
When more than 90% of supply is in profit and the oscillator remains within the +1σ band, the likelihood of a “loss sell-off” is very low. Rather than initiating a sell-off spiral, each pullback mainly serves to rebalance profits. This establishes the basis for the uptrend to continue until (i) the percentage of profits falls below 75% for several consecutive days, or (ii) the Realized Profit cluster remains above the +1σ Moving Average at a stop-loss price. This is a sign that a sell-off is imminent.
STH-SOPR ≈1 indicates a safe short-term cost basis. LTH supply reduction is only low to moderate compared to previous cycle peaks, so LTH distribution is more about portfolio optimization than exiting positions. This combination reduces the likelihood of a negative feedback loop (STH stop loss → IV increase → liquidation), making the uptrend smoother.
The options market is pricing in low short-term volatility (ATM-IV is at multi-year lows), but the 6-month/1-month IV ratio is very high (all-time high ~3.2%). This structure favors: BTC spot ~115k and ETH ~4,23k.
Trend following strategy in spot/perp (prefer long positions).
Selectively hedge with positive vega at 3–6 month maturities (long calendar/diagonal) instead of buying short-term vol,
Realized Profit > +1σ, STH-SOPR <1 cluster lasting ≥1–2 weeks, or RHODL touching the warning band. If all of these happen at the same time, volatility breakout expectations shift from long-term to short-term.
The phase change zone is around ~127k, which is the STH cost basis +1σ. If price breaks out and holds there, it will start a new price discovery phase (possibly up to 140k–145k). If it fails, price will just stay in the 105k–110k buffer zone, where many on-chain indicators (like the profit margin oscillator and SOPR) have shown that they can support the price.
Disclaimer: The information presented in this article is the author's personal opinion on the cryptocurrency field. It is not intended to be financial or investment advice. Any investment decision should be based on careful consideration of your personal portfolio and risk tolerance. The views expressed in the article do not represent the official position of the platform. We recommend that readers conduct their own research and consult with a professional before making any investment decisions.
API & Data : Glassnode
Compiled and analyzed by HCCVenture
Join HCCVenture here: https://linktr.ee/holdcoincventure
Explore HCCVenture group
HCCVenture © 2023. All rights reserved.


Connect with us
Popular content
Contact to us
E-mail : sp_contact@hccventure.com
Register : https://linktr.ee/holdcoincventure
Disclaimer: The information on this website is for informational purposes only and should not be considered investment advice. We are not responsible for any risks or losses arising from investment decisions based on the content here.
TERMS AND CONDITIONS • CUSTOMER PROTECTION POLICY
ANALYTICAL AND NEWS CONTENT IS COMPILED AND PROVIDED BY EXPERTS IN THE FIELD OF DIGITAL FINANCE AND BLOCKCHAIN BELONGING TO HCCVENTURE ORGANIZATION, INCLUDING OWNERSHIP OF THE CONTENT.
RESPONSIBLE FOR MANAGING ALL CONTENT AND ANALYSIS: HCCVENTURE FOUNDER - TRUONG MINH HUY
Read warnings about scams and phishing emails — REPORT A PROBLEM WITH OUR SITE.