On-chain analysis week 3/2026: Bitcoin is fluctuating amid political tensions
As January 2026 drew to a close, Bitcoin recorded a notable recovery from its short-term lows, clearly reflecting signs of temporary seller exhaustion after a period of sharp correction.
1/27/202612 min read
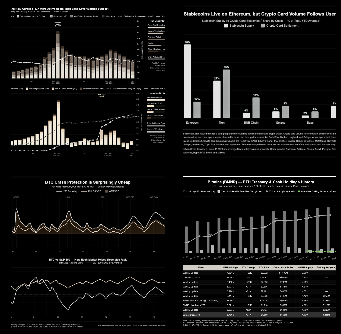
Market Summary
The average cost basis of Short-Term Holders (STH) who bought during the euphoric period at the end of Q4/2025. This is the break-even zone for investors 1-4 months old, who are currently still in a state of unrealized losses. As the price approaches this area, breakeven selling activity increases significantly. Instead of shifting to accumulation or risk reallocation in line with the uptrend, the majority of supply remains driven by defensive motives and a desire to minimize losses.
Cumulative Volume Delta (CVD) data shows a constructive shift as active selling pressure on major exchanges has significantly decreased, and some exchanges are beginning to return to a state of mild supply absorption. Accumulation activity remains selective and opportunistic , rather than forming a sustained buying pattern as in previous trend extension phases.
Although some capital inflows have appeared during corrections or accumulation phases, their scale and frequency are still insufficient to create structural demand . In this context, large businesses and organizations remain marginal participants , rather than the driving force behind the trend.
However, it is important to emphasize that this is not a signal of cyclical weakness , but rather an incomplete re-accumulation phase . The market's inability to extend its trend at the moment reflects the absorption of remaining supply, rather than negating the medium-term outlook.
Analyzing on-chain metrics
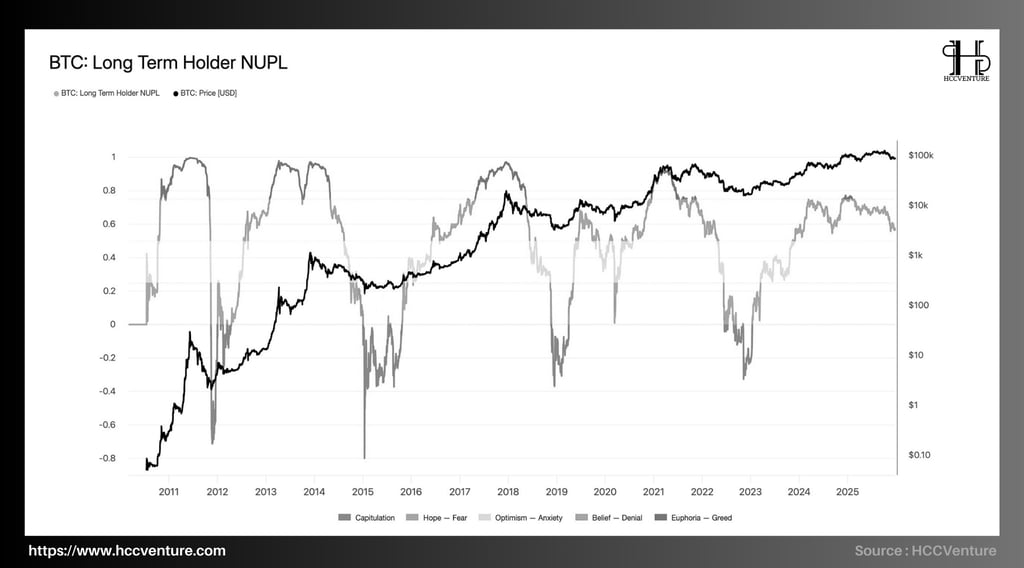
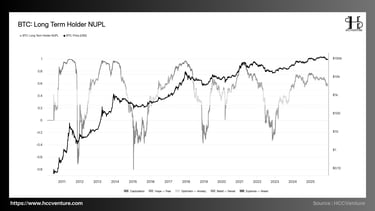
Long-Term Holder Net Unrealized Profit/Loss (LTH NUPL) is one of the most important metrics for assessing the psychological state, the level of unrealized profit, and the cyclical behavior of long-term investors (coin age > 155 days).
As of early 2026, LTH NUPL continues to maintain high profit margins, but has shown signs of cooling down compared to the most recent cyclical peak , indicating that the market is entering a period of psychological rebalancing after the distribution surge at the end of 2025 , rather than falling into a cyclical recession.
Current cycle peak : LTH NUPL previously approached the ~0.75–0.8 range during periods when the price surpassed $100,000.
Bottom of the 2022 bear cycle : LTH NUPL plummeted below 0, even approaching the Capitulation zone.
Most long-term investors are still holding significant unrealized profits , but are no longer in the state of extreme euphoria seen at the peak. More importantly, the index has not returned to Fear or Capitulation zones , indicating that long-term confidence has not been broken .
The current structure (early 2026) suggests that LTH NUPL is moving similarly to the re-accumulation phases in an uptrend cycle , where long-term gains remain substantial, but investor behavior is becoming more cautious, prioritizing profit preservation and selective distribution rather than continued aggressive accumulation.
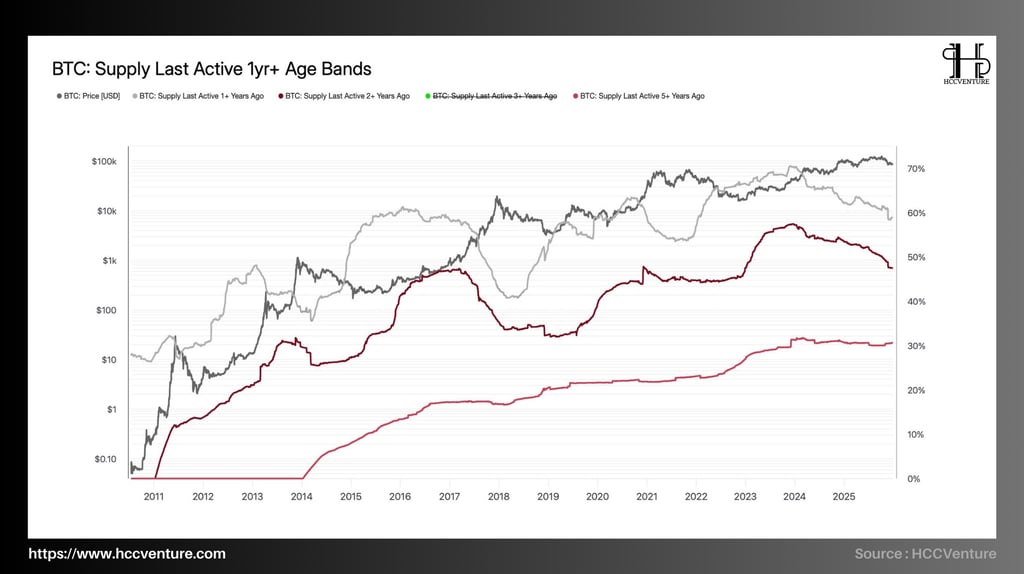
Unlike short-term cash flow indicators, the group of "coin age" indicators forms the structural foundation of the Bitcoin market , as they represent the behavior of investors with low capital costs, a long-term perspective, and the ability to significantly influence macroeconomic supply and demand.
By early 2026, with Bitcoin having undergone a strong distribution phase in late 2025 and entering a rebalancing phase, this index provides a crucial slice of the steadfastness of long-term investors .
Supply that has been inactive for over a year (1y+) currently accounts for approximately 60% of total circulating supply , a slight decrease from the historical peak of nearly 65–67% recorded during the strong accumulation phase before breakouts.
Supply of 2-year and 3-year-old assets remains at historically high levels , reflecting a core group of investors formed from the previous cycle with no signs of widespread exit.
The supply of 5y+ continues its long-term upward trend , currently fluctuating around ~28–30% of total supply, close to its historical high.
Compared to the 2022–2023 cycle bottom, when the proportion of 1-year+ supply decreased sharply due to capitulation and redistribution, the current structure suggests that Bitcoin is in a very “tightly locked” long-term supply state , despite significant price corrections.
The structure at the beginning of 2026 shows that long-term supply is decreasing, but the decrease is in a controlled state , not a collapse. This behavior is consistent with a medium-term distribution phase within a larger bull cycle , where aging supply is gradually released to absorb new demand.
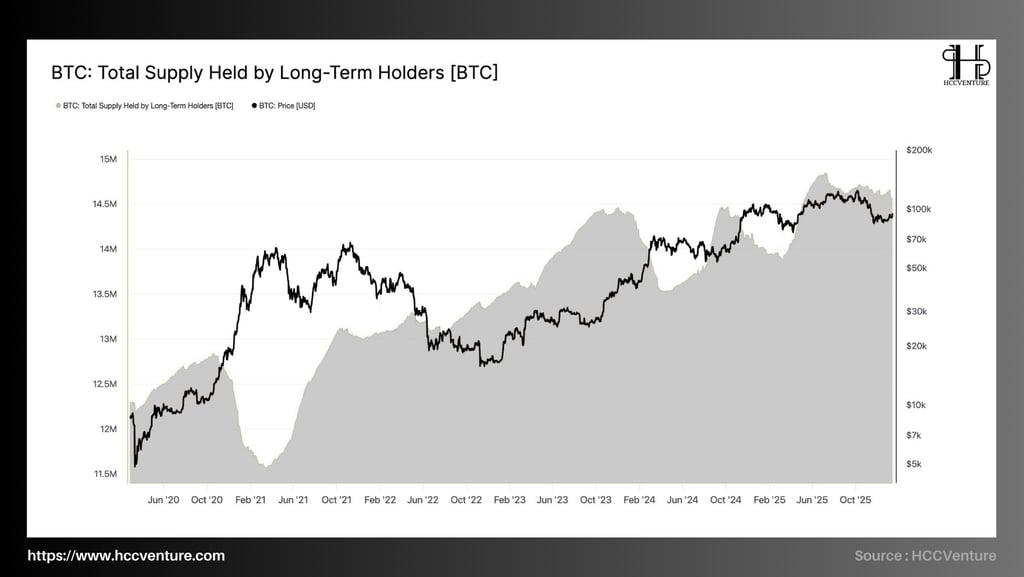
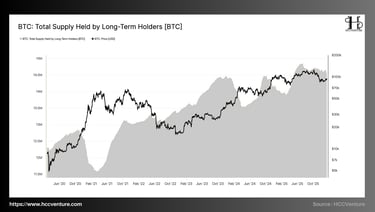
Total Supply Held by Long-Term Holders (LTH) is one of the most fundamental indicators for assessing market cycle status, reflecting cyclical distribution-accumulation behavior that is often slow but has a decisive impact on the long-term supply-demand structure of Bitcoin.
Given that Bitcoin has experienced a strong bull cycle and a correction/rebalancing phase towards the end of 2025, analyzing the LTH Supply allows for a clear identification: is the market in a distribution phase at the peak, or is it simply a correction within a larger uptrend ?
The total supply of BTC held by Long-Term Holders currently fluctuates around ~14.2 – 14.4 million BTC , lower than the historical peak of approximately 14.8 – 15.0 million BTC recorded during the previous peak accumulation phase. Compared to the 2021–2022 cycle bottom, when LTH Supply dropped sharply to ~11.6 – 11.8 million BTC, the current level is still over 2.5 million BTC higher , reflecting a very solid foundation for long-term holding.
Notably, the rate of decline in Long-Term Supply in the second half of 2025 and early 2026 slowed down significantly , a clear contrast to the aggressive distribution phases of the past. This indicates that Long-Term Holders are still net sellers , but the intensity of the distribution has weakened, no longer being coercive or panic-driven.
The LTH group is selectively realizing profits , primarily when prices approach historical highs or valuation levels far exceeding the cost of capital. There are no signs of long-term holders selling off to escape risk, indicating that confidence in Bitcoin's long-term trend remains . The current distribution process is a reallocation of supply to a new class of investors, rather than a withdrawal of capital from the market.
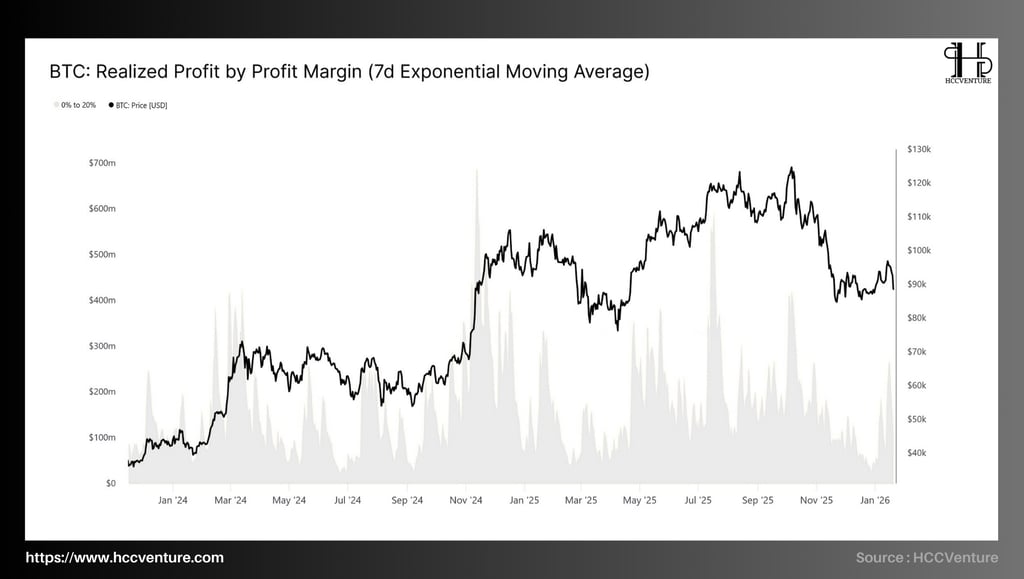
At the beginning of 2026, the Realized Profit by Profit Margin (7-day EMA) focuses on the low-profit group of 0–20% , representing short-term investors, tactical traders, and those selling near the break-even point. This group is highly sensitive to price fluctuations and often plays a decisive role in the intermediate accumulation and distribution phases of the cycle.
Realized profits for the 0–20% margin group remain high and stable , with peaks fluctuating around $300–500 million/day (7-day EMA) during recent price rallies.
Compared to previous cyclical peaks, where realized profits typically came from the group with >100% margin, the current structure leans heavily towards thin profit margins , suggesting the market has not yet entered a state of extreme euphoria.
Compared to the low point of 2022–2023, when Realized Profit was almost exhausted and frequently below $50–100 million per day , the current level is many times higher, reflecting a significant recovery in liquidity and trading activity .
The period from 2024 to early 2026 is a time when profits are realized steadily, but concentrated at low profit margins , characteristic of a market in a post-expansion rebalancing phase , not the end of a cycle.
The fact that the 0-20% margin group accounts for a large proportion of Realized Profit clearly reflects the sentiment of short-term investors and swing traders actively taking profits early , rather than holding on to expectations of an extended trend. This behavior indicates that trend confidence has not spread evenly , and the market remains defensive. At the same time, it confirms that the current selling pressure is "technical," coming from recent buyers, rather than from long-term holders with low capital costs.
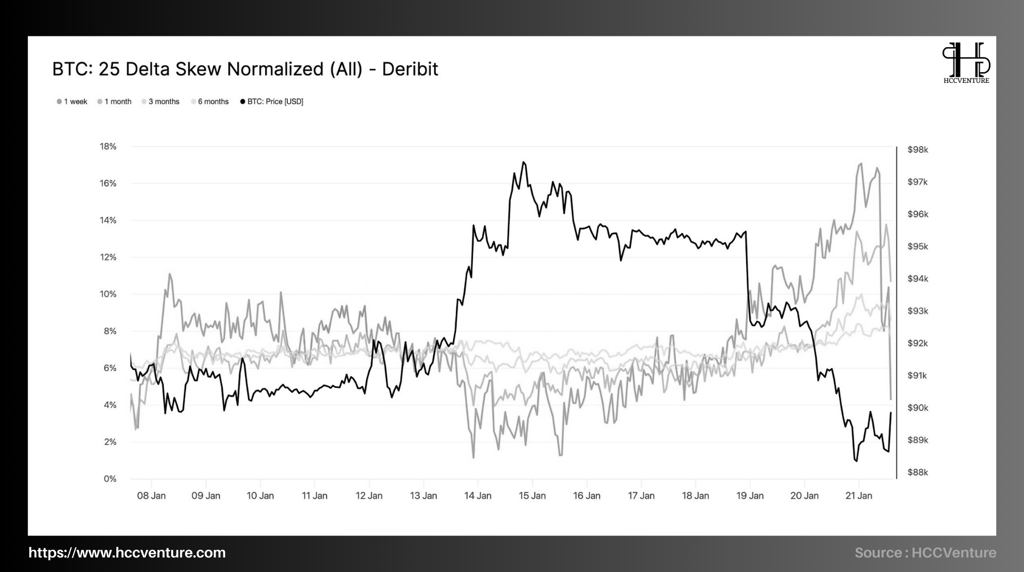

Unlike implied volatility – which measures the expected degree of fluctuation – skew measures the direction of risk . Therefore, strong skew movements, especially in short maturities, are often associated with points of liquidity stress or local price extremes . As of mid-to-late January 2026, data from Deribit shows:
The 25 Delta Skew 1-week contract surged to the ~16–17% range , its highest level in several weeks, reflecting extreme put richness .
Just a week earlier, the short-term skew was still fluctuating around the neutral 5–7% range , indicating a very rapid and reactive reversal in sentiment.
Meanwhile, the 1-month skew also rose , but by a smaller margin, fluctuating around 10–12% , indicating that hedging pressure has spilled over into the medium term.
Conversely, the 3–6 month skew remained stable , only slightly inching up and continuing to anchor within a moderate put-rich zone, reflecting that long-term risks have not been significantly revalued
Investors are willing to pay significantly higher premiums to buy put options , rather than holding unprotected positions. This pressure doesn't stem from long-term collapse expectations, but from the need to protect spot or futures positions in the short term . Notably, immediately after macroeconomic statements and events (such as policy discussions at Davos), put richness is quickly replaced by "monetiz," meaning put options are taken profit, and skews begin to decline again at almost the same rate as before.
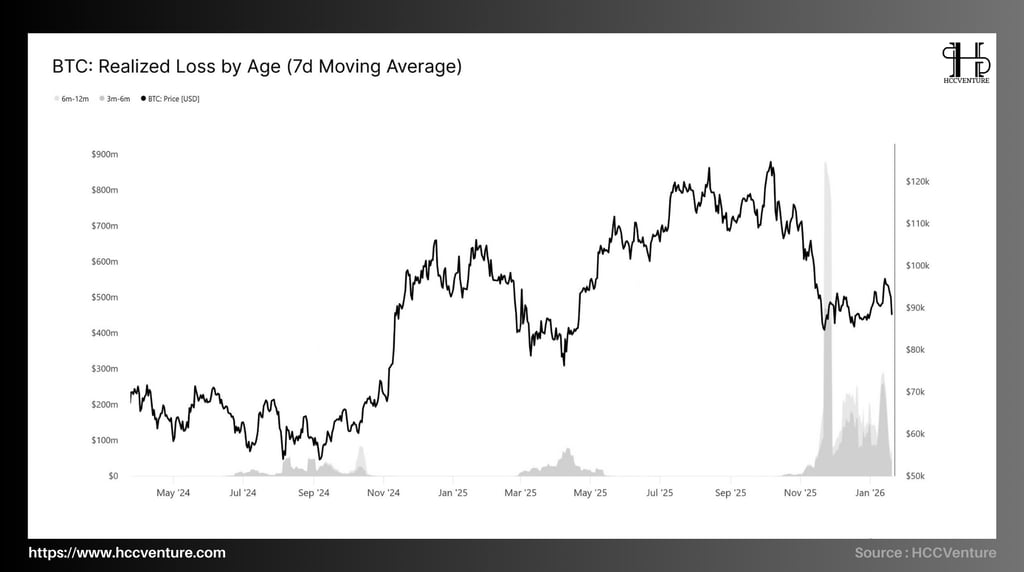

Realized Loss by Age measures the realized loss value when Bitcoin is spent, broken down by the age of the UTXO holdings . The application of a 7-day moving average smooths the data, thereby better reflecting structured selling behavior rather than short-term fluctuations.
Currently, the majority of realized losses come from investors holding positions for 3–6 months , with average 7-day losses fluctuating in the range of $200–300 million/day , sometimes spiked higher. The 6–12 month group plays a secondary role, with significantly lower loss margins and no extreme peaks. Longer-term groups (true LTH, >1 year) are almost absent from the loss data , indicating they were not forced to exit their positions.
Compared to historical lows , where realized losses were almost zero during deep accumulation phases, the current level is significantly higher. However, compared to historical loss peaks , the current level remains considerably lower and lacks breadth, reflecting a correction within a larger uptrend , rather than a structural collapse.
Investors who bought in during Q3–Q4/2025 , when Bitcoin's price approached and surpassed its previous peak, are now facing psychological pressure as the price retraces to the $90,000-$95,000 range and are faced with the choice of cutting losses or exiting their positions when the price pulls back near the break-even point .
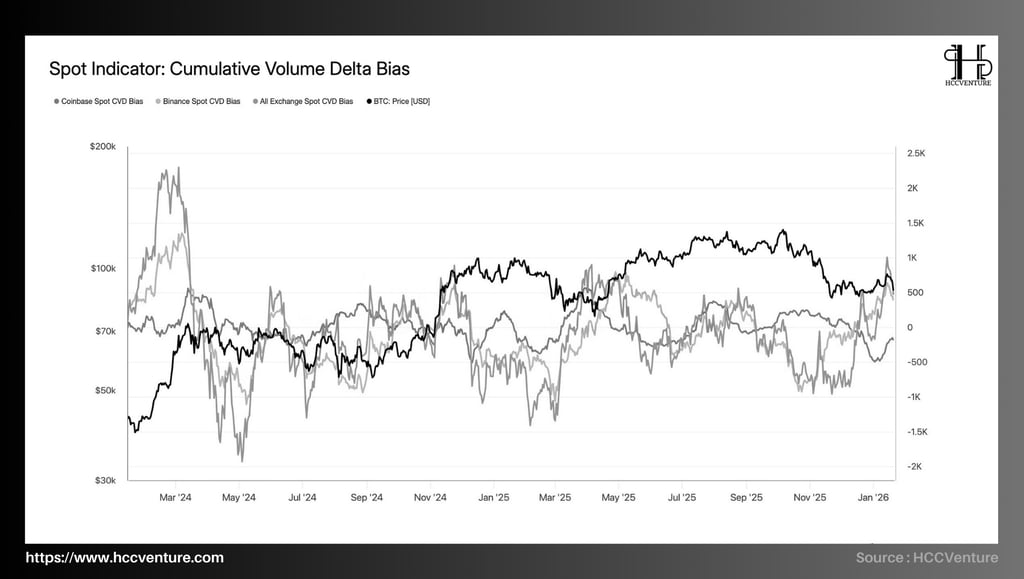
CVD data updated to early 2026 shows a clear structural shift from the All Exchange Spot CVD, reversing from deep negative territory in Q4/2025 to neutral and slightly positive , reflecting active buy orders beginning to outweigh sell orders.
Compared to the historical low of CVD in Q4/2025 , the current level represents a significant improvement, although it remains noticeably lower than the CVD peaks of strong growth phases (trend expansion) such as late 2020 or early 2024. This accurately reflects the nature of the current phase, which is rebalancing and building a foundation , not accelerating the cycle.
Although the CVD trend has improved, current data still shows an important characteristic: persistent aggressive accumulation has not yet appeared. CVD is increasing with a moderate slope, not a steep one, reflecting a cautious market sentiment that prioritizes absorbing supply rather than chasing prices.
The fact that Spot CVD on most major exchanges has turned neutral to positive, coupled with a noticeable weakening of selling pressure from Coinbase, suggests that the weak supply has largely been released . In this context, the market is no longer dominated by sell-offs or active distribution, but is operating in a healthy rebalancing state , where each new unit of demand has a greater impact on price.
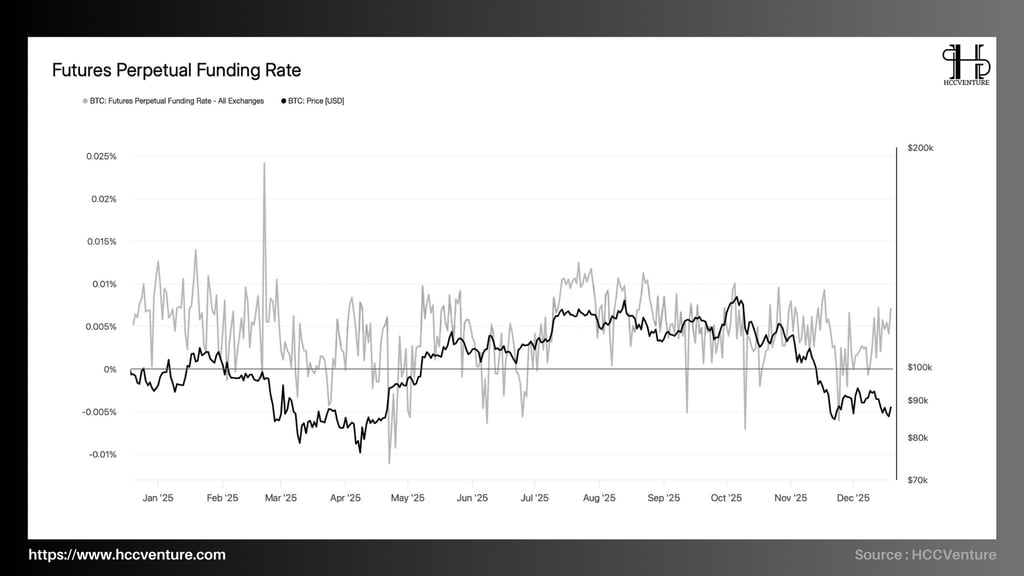

Funding Rate is not only a measure of sentiment, but also a direct indicator of the level of leveraged capital participation , thereby helping to determine whether price fluctuations come from spot-driven organic money flow or from the mechanical dynamics of derivatives . Funding Rate remains around a neutral level, even slightly leaning towards negative at many times .
The average funding rate fluctuated around 0% to ±0.005% , significantly lower than during previous periods of rapid growth.
There were no periods of high and prolonged positive funding rates, which are characteristic of markets with excessive leverage.
During sharp corrections in Bitcoin's price to below $100,000, the funding rate quickly turned negative but did not widen , indicating that short selling was not aggressive but primarily defensive.
The derivatives market is currently in a state of low participation , with leverage tightly controlled and not acting as a major driver of price trends. Compared to historical funding rate peaks , current levels are systematically lower. At the same time, when compared to funding rate lows during periods of strong capitulation (e.g., mid-2022) , current levels do not fall into an extremely pessimistic state.
The continued low funding rate is a structurally healthy sign . The market is no longer dominated by an excessive number of long positions, minimizing the risk of a reverse squeeze and allowing prices to be determined by actual supply and demand in the spot market .
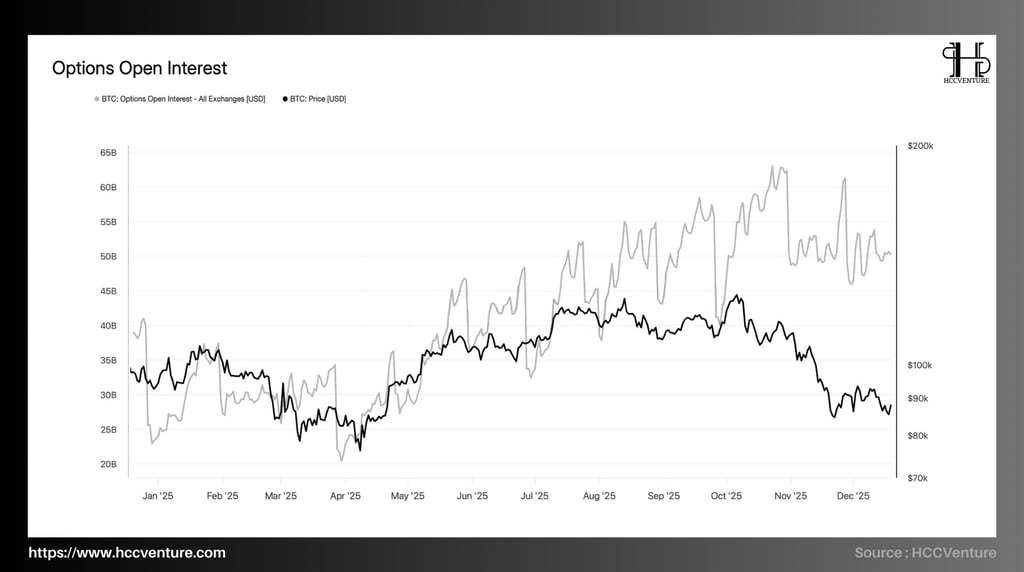
Bitcoin's Options Open Interest at the beginning of 2026 reflects an options market that has passed the peak of its expansionary cycle and is in a controlled rebalancing phase, with a sustained presence of institutional capital and a dominant hedging role. The fact that OI remains at a high level, even after correcting from its peak, suggests that long-term confidence has not eroded and systemic risk is being absorbed in an orderly manner.
Options open interest (OI) is projected to peak in 2025 around $60–62 billion , coinciding with a period when Bitcoin's price is trading steadily above six digits.
By the end of 2025 – beginning of 2026, open interest (OI) will have decreased to around $48–52 billion , equivalent to a correction of about 15–20% from its peak .
Despite the decline, current open interest (OI) levels remain significantly higher than the previous cyclical lows , when OI had fallen to the $20–22 billion range during sharp corrections.
The current Options Open Interest (OI) level, lower than its peak but significantly higher than its historical low, confirms that Bitcoin has not yet entered a cyclical downturn , but is in a transitional phase – where risk is repriced instead of being wiped out . In other words, the current Options Open Interest acts as a market stabilizer , limiting extreme volatility shocks, rather than amplifying price swings as in euphoric phases.
From a structural perspective, this is typical of a mature market , where volatility is managed through options rather than being driven by leveraged futures. In such an environment, future price movements are likely to require simultaneous improvements in spot demand and expected volatility , rather than relying solely on mechanical dynamics from derivatives.
Assessment and Conclusion
Entering the beginning of 2026, on-chain indicators and derivative market data suggest that Bitcoin has officially moved out of the strong distribution phase of late 2025 to enter a transitional phase of structural rebalancing , rather than cyclical weakening. Current capital flows and market behavior reflect a gradual stabilization of selling pressure, alongside a selective improvement on the demand side, particularly in the spot market.
On the supply side, the distribution activity of long-term holders has slowed down significantly compared to the peak period of Q3–Q4/2025. The total supply held by LTH is still trending downwards, however, the rate of decline has slowed considerably, confirming that most of the structural supply has been absorbed by the market.
Institutional balance-sheet flows have completed their "reset." After months of significant net outflows from spot ETFs, companies, and some sovereign entities, recent data shows these flows have stabilized. Notably, spot ETFs were the first group to reverse back into positive territory , reaffirming their role as important marginal buyers in previous expansion phases.
However, it is important to emphasize that the recent recovery to the $96,000 region was not driven by broad organic spot demand , but primarily by mechanical factors in the derivatives market. Futures liquidity remains low, futures trading volume has not recovered to historical averages, while leverage deployment continues to be constrained.
The options market further reinforces this point. Volatility risk is now primarily priced in short-term maturities , while implied volatility in the medium and long term remains stable. This suggests that risk is not being fully released, but is being delayed and reallocated over time , reflecting tactical hedging rather than structural risk avoidance.
Looking ahead to Q1 2026, the overall on-chain and derivatives indicators suggest that the underlying landscape for Bitcoin is becoming increasingly constructive . Selling pressure has significantly decreased, volatility risk is under control rather than explosive, and the market is in a state where even moderate capital inflows can generate large price reactions due to its thin liquidity structure.
Disclaimer: The information presented in this article is the author's personal opinion in the field of cryptocurrency. This is not financial or investment advice. All investment decisions should be based on careful consideration of your personal portfolio and risk tolerance. The views expressed in this article do not represent the official stance of the platform. We recommend that readers conduct their own research and consult with experts before making any investment decisions.
API & Data : Glassnode
Compiled and analyzed by HCCVenture
Join the HCCVenture organization here: https://link3.to/holdcoincventure
Explore HCCVenture group
HCCVenture © 2023. All rights reserved.


Connect with us
Popular content
Contact to us
E-mail : sp_contact@hccventure.com
Register : https://linktr.ee/holdcoincventure
Disclaimer: The information on this website is for informational purposes only and should not be considered investment advice. We are not responsible for any risks or losses arising from investment decisions based on the content here.
TERMS AND CONDITIONS • CUSTOMER PROTECTION POLICY
ANALYTICAL AND NEWS CONTENT IS COMPILED AND PROVIDED BY EXPERTS IN THE FIELD OF DIGITAL FINANCE AND BLOCKCHAIN BELONGING TO HCCVENTURE ORGANIZATION, INCLUDING OWNERSHIP OF THE CONTENT.
RESPONSIBLE FOR MANAGING ALL CONTENT AND ANALYSIS: HCCVENTURE FOUNDER - TRUONG MINH HUY
Read warnings about scams and phishing emails — REPORT A PROBLEM WITH OUR SITE.