


On-chain Analysis Week 3/2025: Market Value to Realized Value
Most of the unrealized losses are now being recorded by short-term investors, those who are new to the market or tend to trade for short periods of time. However, the level of market stress, as measured by indicators such as the loss/gain ratio and selling behavior, is relatively low compared to previous major corrections.
1/19/20256 min read
Market Summary
Bitcoin is in a correction phase, down -11% from its all-time high ($108,000) but still holding above key support levels, preserving a positive market structure.
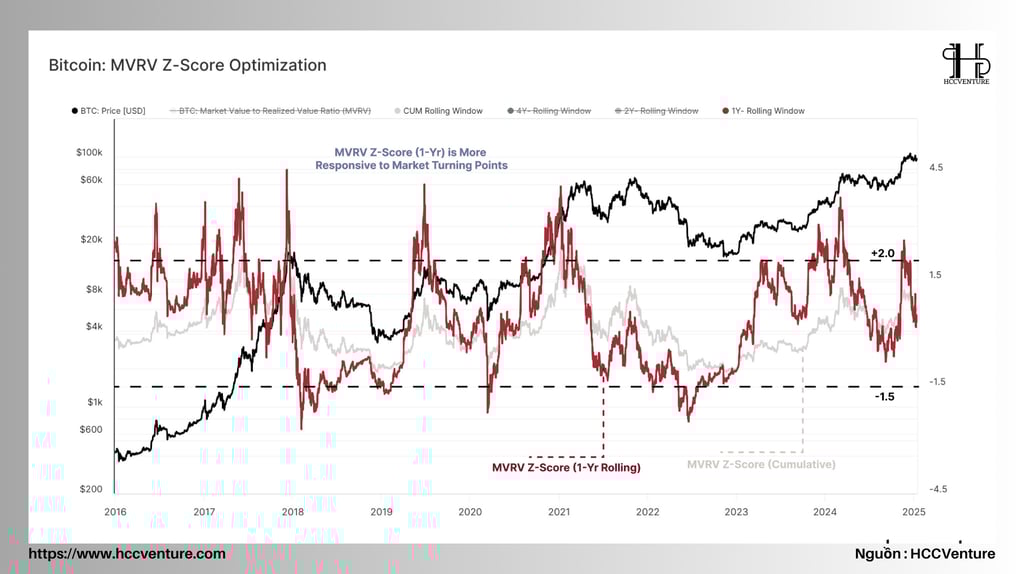
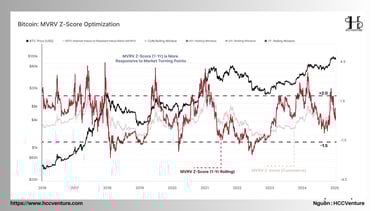
Based on Z-Score analysis, cycle peaks are typically within 1.5-2.0 σ of the mean, providing guidance during bull market phases.
Currently, Bitcoin price is about 10% higher than the cost basis of the group of short-term investors (Short-Term Holders) around ($88,400), which is a positive signal but has potential risks if the price falls below this level.
Notably, among short-term investors with 2.0-3.5 million BTC in negative equity, selling pressure is moderate. The relative unrealized loss ratio peaked at 4.3% (Q3/2024), lower than previous cycles, indicating an increase in the spot market and investor patience.
Overall, despite the correction, Bitcoin is still maintaining a stable market structure, with risks concentrated mainly in the group of short-term investors.
On-chain metrics analysis

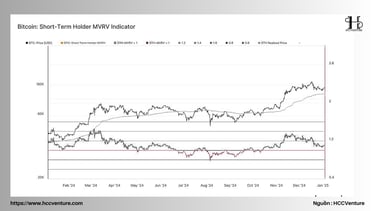
Bitcoin has seen a year of phenomenal growth, peaking above $100,000 in a matter of weeks and maintaining stability with the MVRV of Short-Term Holders (STH) ranging from 1.5 - 2.0 .
When Bitcoin price remains above the average buying threshold of short-term investors, they continue to make significant profits, which reinforces the positive sentiment. However, in previous cycles, when STH MVRV exceeded 2.5 , the market often experienced strong price corrections due to profit-taking pressure from this group of investors.
Early 2025 (Q1-Q2/2025): Accumulation and adjustment, when STH MVRV falls close to 1.0, there is often a "fear" sentiment in the market. However, compared to previous cycles (2015, 2018), this is the stage that lays the foundation for a long-term recovery.
Mid- to late 2025 (Q3-Q4/2025): Next growth cycle?
STH MVRV may rise to 1.5 - 2.5 , similar to previous recovery phases. If STH MVRV exceeds 2.5, this usually means that short-term investors are taking huge profits, leading to a high probability of a sell-off and a sharp price correction.
In the event that Bitcoin surpasses $150,000 or higher by the end of 2025, STH MVRV could reach extreme levels of 3.0 - 3.5 , as seen in previous bull markets (2017, 2021).
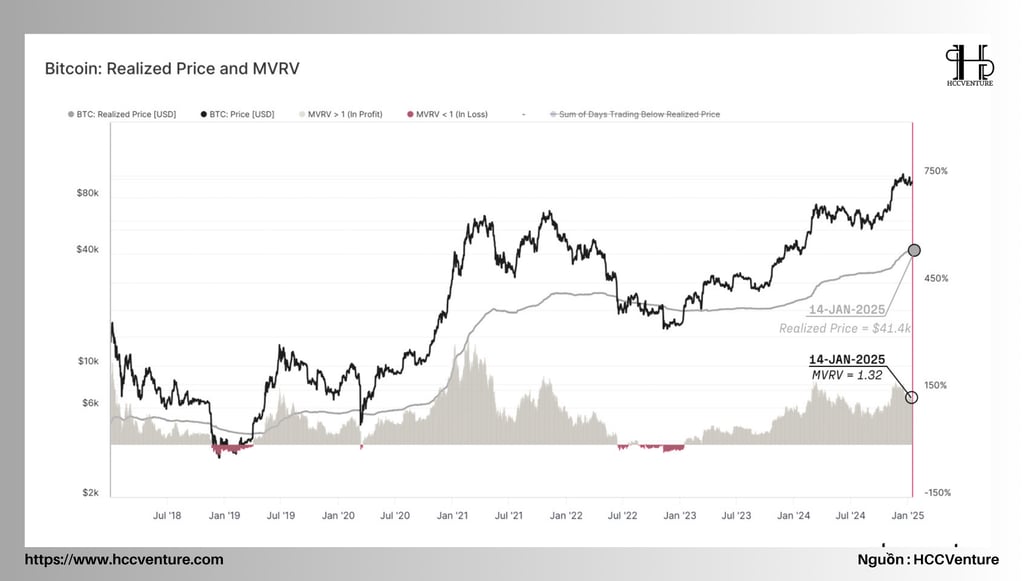
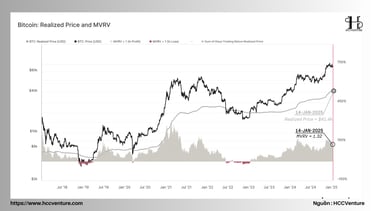
The 2018-2020 period saw the Bitcoin market enter a bear and accumulation cycle. The Realized Price (PRP) started at around $4,200 at the beginning of 2018, dropping to around $3,200 by the end of the year. The MVRV ratio remained below 1 for most of the year, reflecting the bearish market trend. Notably, MVRV bottomed out at ~0.85 in December 2018, coinciding with Bitcoin’s lowest price of ~$3,200.
The period 2023-2024 marks a strong recovery and growth of the Bitcoin market. The Realized Price increases from around $20,000 in early 2023 to $30,000 by the end of 2024. The MVRV ratio also increases significantly, reaching 1.5-2.0 when Bitcoin surpasses $30,000 in mid-2023 and reaching 2.5-3.0 when Bitcoin surpasses $100,000 in 2024, reflecting the optimistic sentiment and outstanding growth of the market.
Prediction 2025: Bullish Cycle Continues?
Realized Price:
If Bitcoin maintains its growth momentum, Realized Price could reach $40,000 - $50,000 by the end of 2025.
This is dependent on new capital inflows from institutional investors and the popularity of spot ETF products.
MVRV Ratio:
If Bitcoin price reaches ~$150,000 or higher, MVRV Ratio could hit 3.5-4.0, similar to previous cycle tops.
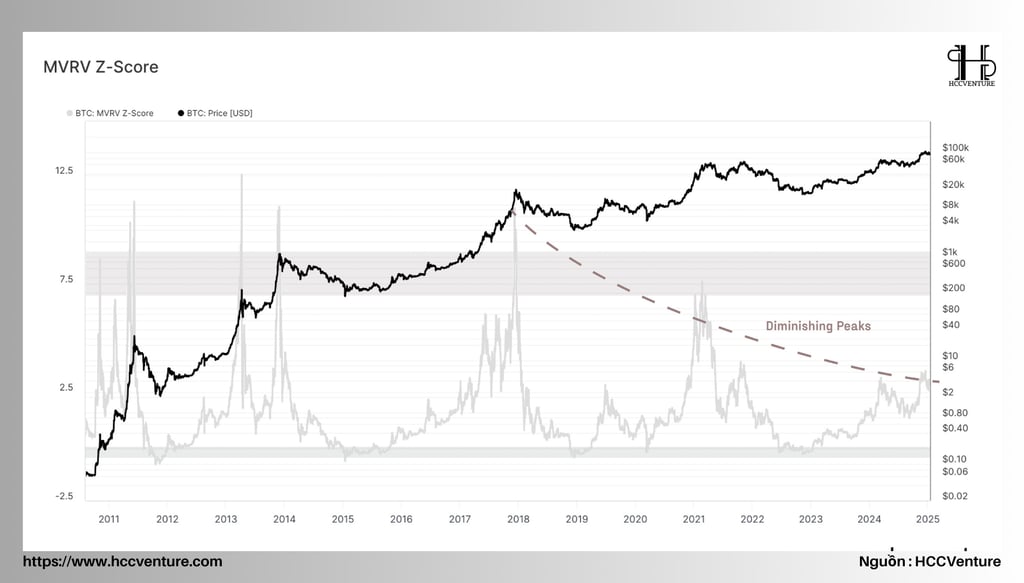
MVRV Z-Score is an advanced on-chain metric designed to identify periods when the Bitcoin market is overvalued (overbought) or undervalued (oversold).
2018-2020: Bearish and Accumulating Market
After the strong price increase in 2017, MVRV Z-Score dropped rapidly from 7+ (2017 peak) to -0.5 to 0 by the end of 2018.
December 2018 : Bitcoin bottomed at ~$3,200, Z-Score = -0.4 , marking a period of severe undervaluation.
Phase 2021: Bull Market :
Bitcoin surged from $20,000 to its first peak of ~$64,000 in April 2021.
Z-Score is ~7 , indicating the market is overvalued. This is the first peak of the 2021 bull cycle.
End of 2021 : Bitcoin reaches new peak of ~$69,000 in November 2021. Z-Score again approaches 7 , confirming second cycle top.
Phase 2024: New peak
Bitcoin crosses $100,000 by mid-2024, pushing the Z-Score to 6-7 , similar to previous cycle peaks.
The adjustment at the end of 2024 brings the Z-Score to ~3.0-4.0, showing more stability than previous cycles.
Forecast 2025: Continued growth with low volatility
After a slight correction in late 2024, Bitcoin could continue to grow, bringing the Z-Score to hover around 4.0-5.0 .
End of 2025 (Q3-Q4): If Bitcoin breaks $150,000 (as predicted), the Z-Score could reach 7+, signaling a new cycle top . However, the market is now more mature (with spot ETFs and institutional capital), so the post-peak correction could be less severe than in previous cycles.
Z-Score Peak (2021) : In April and November 2021, Bitcoin peaked with a Z-Score above 7 , reflecting an overheated market. This is when the market is likely to correct or fall sharply, which happened when Bitcoin fell from $64,000 to ~$30,000 in mid-2021.
Z-Score Recovery (2023-2024) : From late 2022 to 2024, Bitcoin had a strong recovery, and the Z-Score fluctuated between 3.0 and 6.0 , reflecting a market recovering from a bottom and a bullish trend. However, when the Z-Score exceeded 7 in mid-2024, signs of an overheated market could begin to be observed.
Z-Score (2025) Could Hit High Above 7 : If Bitcoin continues its bullish trend and reaches ~$150,000 by 2025, the Z-Score could hit 7+, which could be a sign of overheating and a warning for a correction.
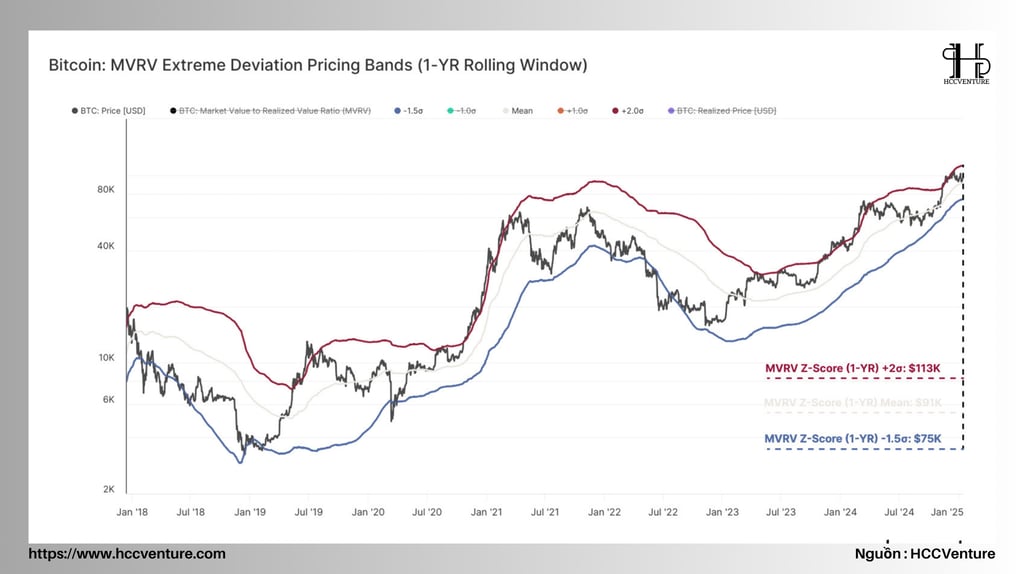
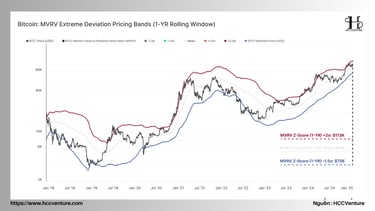
Bitcoin is currently trading at $94,398 , a price that is above its 1-year average of $90,900 , but below the +2σ (bull market peak) of $112,600 . This suggests that the current market is still bullish , but there is a slight retracement from the higher prices the market has reached in the past, when Bitcoin broke above the upper band during times of extreme optimism.
Bullish phase : The current price increase shows that market sentiment is still leaning positive, although there has been a slight correction from extremely high prices.
The current price ($94,398) suggests that the market may continue its uptrend, but could potentially face a correction if it continues to break above the upper band without strong buying power.
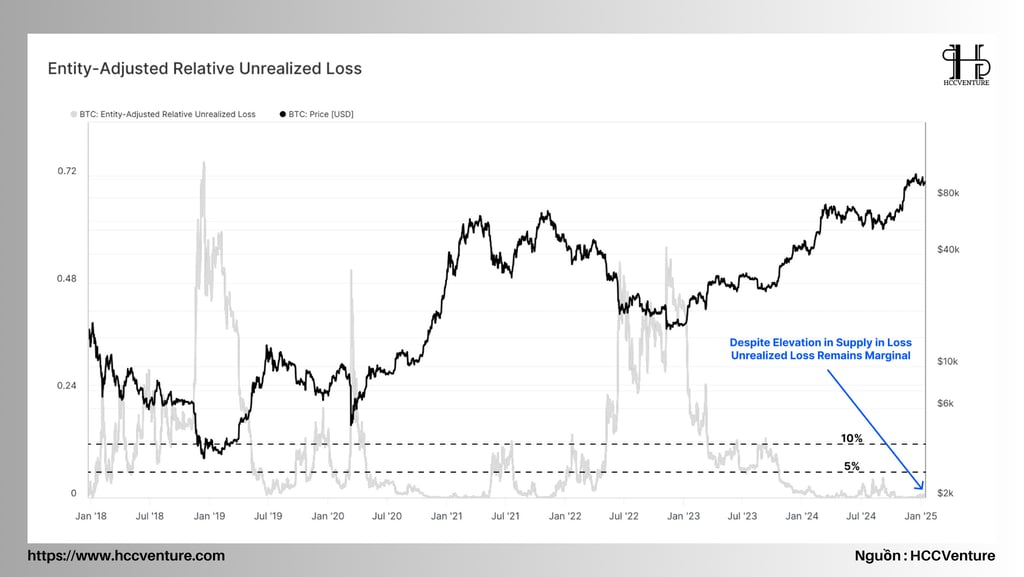

When comparing Relative Unrealized Loss across market cycles, we can see similarities between the current cycle and the 2016–17 bull cycle, as well as stark differences with the 2019–2022 cycle.
Shallower Drawdowns : Drawdowns in the current cycle are less deep than the sharp declines in 2019–2022, especially in post-peak corrections.
Reduced Volatility : Bitcoin's price volatility in the current cycle is lower than in previous cycles. This may reflect more stability in market behavior and sustainable growth in Bitcoin.
Demand from ETFs and Institutional Investors : Bitcoin ETFs have opened up a large inflow of capital from institutional and traditional investors. This helps to alleviate anxiety and panic in the market, bringing greater stability. This new demand helps to minimize unrealized losses.
Conclusion and evaluation
Bitcoin is currently in a correction phase and is trading 11.1% below its all-time high (ATH) of $108,000 . However, despite the decline, Bitcoin’s price remains above several key support levels , indicating that the bullish market structure remains intact. This is further reinforced by the relatively low level of stress in the market, which is reflected in the fact that unrealized losses among investors remain at historically low levels.
Bullish Market Structure : Although Bitcoin is in a correction phase, key support levels and the MVRV Z-Score indicate that the market remains bullish in structure.
Short-Term Investor Cost Basis Watch : $88,400 is an important level to watch. If price holds above this level, optimism could continue in the market, helping Bitcoin recover quickly from the correction.
Low Stress Situation : Unrealized losses remain low, indicating that the market is not showing signs of strong stress, and investors still maintain confidence in Bitcoin's long-term recovery and growth.
Join the HCCVenture community to get the latest market information. Once again, we give our opinion on potential projects in the crypto market. This is not investment advice, consider your portfolio. Disclaimer: The views expressed in this article are solely those of the author and do not represent the platform in any way. This article is not intended to be a guide to making investment decisions.
API & Data : Glassnode
Compiled and analyzed by HCCVenture
Join our telegram community: HCCVenture
Explore HCCVenture group
HCCVenture © 2023. All rights reserved.


Connect with us
Popular content
Contact to us
E-mail : sp_contact@hccventure.com
Register : https://linktr.ee/holdcoincventure
Disclaimer: The information on this website is for informational purposes only and should not be considered investment advice. We are not responsible for any risks or losses arising from investment decisions based on the content here.
TERMS AND CONDITIONS • CUSTOMER PROTECTION POLICY
ANALYTICAL AND NEWS CONTENT IS COMPILED AND PROVIDED BY EXPERTS IN THE FIELD OF DIGITAL FINANCE AND BLOCKCHAIN BELONGING TO HCCVENTURE ORGANIZATION, INCLUDING OWNERSHIP OF THE CONTENT.
RESPONSIBLE FOR MANAGING ALL CONTENT AND ANALYSIS: HCCVENTURE FOUNDER - TRUONG MINH HUY
Read warnings about scams and phishing emails — REPORT A PROBLEM WITH OUR SITE.