

On-chain analysis week 31/2026: Ethereum is showing the longest-term opportunity
Ethereum is undergoing one of its biggest corrections since its bull cycle, with institutional profit-taking and continued tight monetary policy causing a sharp drop in ETH price.
PHÂN TÍCH
7/29/202614 min read
On-chain analysis week 31/2026: Ethereum is showing the longest-term opportunity.
Ethereum is undergoing one of its biggest corrections since its bull cycle, with institutional profit-taking and continued tight monetary policy causing a sharp drop in ETH price.
Analysis • 29 July, 2026


Market Summary
Amidst a correction phase in the cryptocurrency market following a strong growth cycle, Ethereum continues to be one of the most fundamentally stable blockchain networks. Although the price of ETH has significantly corrected from its historical peak, many indicators reflecting network health, such as Realized Price, Exchange Reserve, MVRV, staking activity, and the number of active addresses, still maintain a more positive trend than the market price movement.
Furthermore, 2026 marks a period when Ethereum shifts its focus from scaling to optimizing the performance of the entire ecosystem. The deployment of new protocol upgrades will enable Layer-2 to process transactions more efficiently, reduce data costs, and improve staking efficiency, thereby strengthening Ethereum's role as the core payment layer and application infrastructure of the blockchain economy. With prices currently trading near the market's cost basis, current on-chain signals share many similarities with accumulation phases that preceded historical bull cycles.
Fundamentally, the Ethereum ecosystem continues to maintain positive growth thanks to protocol upgrades, Layer-2 expansion, high staking volumes, and its central role in DeFi, stablecoins, and asset tokenization. This helps to strengthen the network's intrinsic value despite short-term price corrections. With rising capital costs and shrinking liquidity supply on exchanges, Ethereum is forming the necessary conditions to enter a new revaluation cycle as the global liquidity environment and capital flows become more favorable.
Analyzing on-chain metrics
The ETH MVRV and Realized Price indicators suggest that Ethereum is currently trading in an attractive valuation range based on on-chain data. The market price is approximately 20-25% lower than the network's average cost , while the MVRV has fallen below 1.0 and returned to a region that has historically marked several significant bottoming points. The consecutive appearance of MVRV Buy Signals reflects that much of the speculative activity has been eliminated after the prolonged correction. Simultaneously, the continuous upward trend of the Realized Price indicates that long-term capital continues to accumulate Ethereum, despite the weakening of short-term market sentiment.


Ethereum's Realized Price continues its upward trend, fluctuating around $2,300-$2,400 , although its actual price has fallen to around $1,800-$1,900. Simultaneously, the MVRV index has dropped to approximately 0.75-0.80 , corresponding to a low valuation zone that has frequently appeared before Ethereum's strong recovery phases in the past. This structure reflects a deeper market revaluation process, but without a clear weakening of the long-term accumulation base.
Historically, whenever Ethereum trades below its Realized Price for an extended period, selling pressure from speculative investors typically decreases sharply as most profits are wiped out. Supply then gradually shifts to investors with longer-term expectations, allowing the market to establish a new equilibrium before entering the next growth cycle. The continued increase in the average cost of the entire network reflects that long-term capital continues to flow into Ethereum at increasingly higher prices. This also signals that the accumulation process has not been reversed and the confidence of long-term investors remains strong despite short-term market volatility.


Ethereum CME Futures Net Position (Commitment of Traders – COT) reflects the net position of institutions and professional investors in the Ethereum futures market at CME. Currently, the CME Net Position remains in a net short position of approximately $250-350 million USD . However, this is still a negative state, with the size of the short position having decreased significantly compared to the peak of nearly $1.4 billion recorded during the sharp correction in 2025. This reflects the fact that institutions still maintain a cautious stance regarding the macroeconomic environment, but the intensity of hedging has weakened considerably compared to the period when the market experienced the strongest selling pressure.
Historical data shows that net short positions on the CME peaked in Q3 2025 , when the total Net Position fell to nearly -$1.4 billion , coinciding with Ethereum losing more than 50% of its value from its peak above $4,000 . Historically, periods of rapidly expanding net short positions often reflect extreme defensive sentiment among institutions regarding liquidity risks and macroeconomic volatility. However, after reaching this extreme state, current data shows that the size of net short positions has narrowed by more than 70% , to approximately -$300 million .
The fact that net short positions have narrowed by more than 70% from their peak reflects that institutions are no longer expanding their hedging activities with the same intensity as before, although they haven't yet shifted to net buying. The improvement in Net Position, coupled with Ethereum's price stabilizing around the $1,700–$2,000 range , suggests that selling pressure from the derivatives market is weakening. This aligns with other on-chain indicators such as MVRV , Realized Price , Exchange Balance , and Long-term Holder Accumulation , all of which reflect the ongoing re-accumulation process following the deep correction.


The Maker/Limit Orders Cumulative Volume Delta (CVD) is an indicator reflecting the cumulative difference between the volume of buy and sell maker orders in the spot market. Currently, this indicator has shifted to negative territory of approximately $80–120 billion after remaining positive for most of 2022–2024. While this shift reflects passive liquidity still skewed towards selling, the scale of the decline is significantly smaller than in previous periods of strong distribution.
Since the end of 2024, Maker CVD began to decline and by 2026 had turned negative, reflecting a significant decrease in buying liquidity as the market entered a prolonged correction phase. However, the current negative value is still much smaller than the previously accumulated liquidity, suggesting that most of the supply absorption process has been completed and the market is moving towards equilibrium.
Compared to past periods of strong distribution, particularly in 2021 when Maker CVD rapidly declined to around - $250 billion , the current net selling volume is significantly lower. Liquidity makers are no longer aggressively increasing their sell orders despite continued price corrections, reflecting weakening supply pressure from large-cap stocks. Historically, the phenomenon of continued price declines while Maker CVD does not expand at the same rate typically occurs at the end of a correction cycle, when active selling pressure gradually dissipates.


The Ethereum Net Taker Volume (NET Volume) indicates that active selling pressure still slightly dominates the market, but its intensity has significantly decreased compared to previous extreme sell-off periods. The fact that Net Taker Volume is now fluctuating around -50 to -100 million USD , much lower than the extremely negative level of approximately -500 million USD in 2025, reflects the gradual exhaustion of market order selling pressure.
Simultaneously, the narrowing of Net Taker Volume is occurring while Ethereum continues to trade below its Realized Price , MVRV remains below the neutral valuation zone, and many other on-chain indicators are simultaneously signaling accumulation. This suggests that new capital is gradually absorbing the remaining supply instead of allowing selling pressure to continue to expand.
A notable feature is that while Ethereum's price continues to remain significantly lower than its cycle peak of nearly $4,000 , Net Taker Volume is no longer expanding into new negative levels. This reflects a significant shift in seller sentiment compared to the early stages of the correction. Typically, when the market continues to decline but Net Taker Volume doesn't create new lows, it indicates that investors with strong selling demand have completed their distribution. The remaining supply is primarily held by long-term investors who tend to hold rather than sell off. This is a common phenomenon in the later stages of a correction cycle.


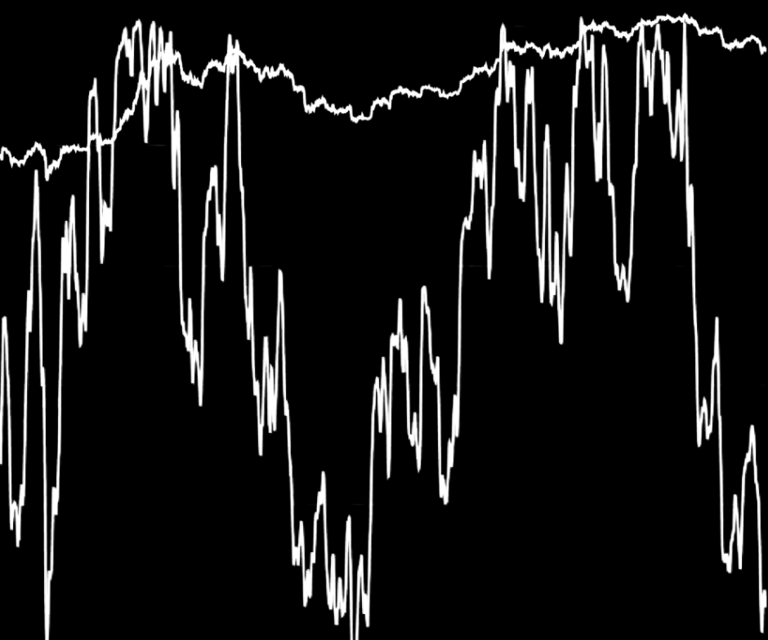
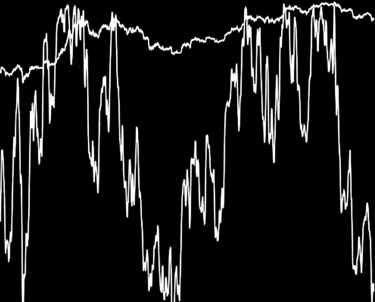
Current data shows that ETH Proxy MVRV SMA(14) has fallen to around 0.75–0.80 , significantly lower than the equilibrium threshold of 1.0 and much lower than the euphoric zone above 1.6–2.0 that appeared in previous cycle peaks. At the same time, the amount of ETH held by institutional whales (10k–100k ETH) remains stable, reflecting that the recent correction mainly narrowed unrealized profits instead of triggering large-scale distribution from long-term capital.
The Proxy MVRV is now fluctuating around 0.75–0.80 , equivalent to the low valuation range recorded during the market bottoming phases of 2018 , late 2022 , and the sharp corrections before Ethereum entered a new recovery cycle. Compared to the peak above 2.0 , the unrealized profits of institutional investors have narrowed by more than 60% , indicating that valuation pressure has been significantly relieved after the prolonged correction period.
Proxy is showing a decrease in unrealized profits, primarily due to a deep market price correction close to the cost basis of large investors. This phenomenon typically occurs in the later stages of a correction cycle, when the market completes the revaluation process but strategic supply continues to be held, and is a positive sign for the supply structure, as selling pressure from the largest ETH holders remains low.
The fact that the Proxy MVRV has fallen below 1 means that the market price of Ethereum has approached or fallen below the average cost basis of many institutional investors. Historically, periods where the MVRV remains below this threshold do not last long, as the market gradually attracts value demand when the discount becomes more attractive to long-term capital.


Ethereum Exchange Reserve is an indicator measuring the total amount of ETH currently stored on centralized exchanges (CEXs). A decrease in Exchange Reserve reflects capital outflows from exchanges for long-term storage, staking, or participation in DeFi protocols, thereby reducing potential selling pressure. Conversely, an increase in ETH on exchanges signifies increased liquidity supply and generally greater distribution risk.
Current data shows Ethereum trading around $1,800 , while the total ETH held across all exchanges is only about 15.1 million ETH , the lowest level during the observation period and also the lowest in recent years. Compared to the beginning of 2024 when reserves fluctuated around 20.6-20.8 million ETH , the market has seen over 5.5 million ETH withdrawn from exchanges, equivalent to a decrease of approximately 26-27% in trading supply.
This phenomenon reflects that the majority of investors did not choose to sell off during the recent correction but continued to withdraw ETH to cold wallets, staking, or decentralized finance platforms. This reduces the supply of liquidity that can be sold immediately on the spot market, while improving the supply structure in the medium and long term.
The downward trend of Exchange Reserve also aligns with changes in the Ethereum ecosystem following the Proof-of-Stake mechanism , as more and more ETH is locked in staking and decentralized finance protocols. Simultaneously, recent on-chain data also shows continued accumulation by long-term investors and whales, causing the amount of freely circulating ETH in the market to continue shrinking.


Research and Analysis
Market Summary
Analyzing on-chain metrics
ETH MVRV và Realized Price
Ethereum CME Futures Net Position (Commitment of Traders – COT)
Maker/Limit Orders Cumulative Volume Delta (CVD)
Ethereum Net Taker Volume
ETH Proxy MVRV SMA(14)
Ethereum Exchange Reserve
Ethereum Metcalfe Divergence Indicator
Price Upper Band
ETH Scenario Ensemble
Assessment and Conclusion
The Ethereum Metcalfe Divergence Indicator is a composite index that assesses the relationship between Ethereum's market price and the network's intrinsic value according to Metcalfe's Law , where the network's value is reflected through user activity and the number of wallet addresses participating in transactions. Current data shows Ethereum trading around $1,800 , while the Realized Price remains around $2,200–$2,300 , and the number of highly active addresses remains stable after a period of sharp correction. The Metcalfe Divergence Indicator continues to fluctuate slightly in negative territory, reflecting that the market price is still lower than the value supported by network activity.
Amidst a declining market, Metcalfe Divergence has returned to negative territory, similar to periods in late 2018 , late 2022 , and previous major corrections. This indicates that the current price of Ethereum is significantly lower than the value supported by the number of users and the actual usage of the ecosystem, reflecting a revaluation process following a sharp market correction.
Net Unrealized Profit/Loss (NUPL) data also shows that the market's unrealized profits have decreased significantly from the peak of the cycle. After remaining in high-profit territory in 2024 and early 2025, NUPL has now returned close to neutral, reflecting that most speculative profits have been absorbed through price corrections.
The stability of active Ethereum addresses during this correction phase suggests that the underlying ecosystem has not shown significant signs of weakening. Unlike previous downturns, which were primarily driven by a decline in demand, the current phase reflects valuations being more heavily influenced by macroeconomic factors such as tighter monetary policy, weakening ETF inflows, and the defensive sentiment of global financial markets.


Ethereum is currently trading near its Realized Price , while remaining significantly below the Upper Band and maintaining a safe distance from the Lower Band . Compared to previous cycles, this state reflects a neutral valuation leaning towards a discount zone , rather than a euphoric or speculative bubble.
Currently, after a sharp correction from its cyclical peak, the price of ETH has returned to trading close to its Realized Price. Compared to the market peak when the gap between price and cost widened significantly, the current difference has narrowed considerably. This reflects that much of the short-term speculation has been absorbed, while Ethereum's valuation is returning closer to the actual market capitalization of the entire network.
A notable signal is that although ETH's price has recovered after the correction phase, the gap between the market price and the Realized Price Upper Band remains quite wide. In previous cycles, Ethereum only approached or surpassed the Upper Band when the market entered a late-cycle euphoria phase with a surge in speculative capital. Currently, ETH is still about 35–40% below the Upper Band , reflecting that the market has not yet entered an overvalued state. This is significantly different from the peaks of 2018 and 2021 when the price consistently traded above the upper band before large-scale distribution pressure emerged.


The ETH Scenario Ensemble is a probabilistic forecast model built by aggregating multiple quantitative variables, including historical price data, market cycles, on-chain dynamics, statistical volatility, and capital flow behavior, to simulate medium- and long-term Ethereum price scenarios. Unlike traditional linear forecasting models, the Scenario Ensemble does not provide a fixed price but instead constructs probability ranges (10–90 percentile and 25–75 percentile), reflecting the reasonable range of Ethereum's volatility under various market conditions.
As of July 25, 2026 , Ethereum was trading around $1,857 , approximately 62% lower than its all-time high of $4,946 set in the previous cycle. However, probabilistic models suggest that ETH's expected distribution has begun to shift to a positive expansion phase from 2027, reflecting the possibility that the market is entering an accumulation phase in preparation for the next growth cycle.
An observation of the overall model reveals that the forecast range for the 2026–2027 period remains relatively narrow, reflecting a market re-evaluation phase after a correction cycle. However, since 2027 , both the 25–75 percentile and 10–90 percentile ranges have expanded significantly, indicating an increasing probability of a sustained uptrend over time.
Although the model maintains negative scenarios to reflect market uncertainty, the probability distribution suggests that the focus of the entire forecast set is shifting toward higher valuation ranges. This implies that as the global liquidity cycle improves and capital flows back into digital assets, the probability of Ethereum expanding its market capitalization is significantly higher than the likelihood of it remaining in its current valuation range.
Assessment and Conclusion
Although ETH's price has corrected by more than 60% from its all-time high, most valuation indicators and capital flow behavior suggest that active selling pressure is weakening, while accumulation by long-term and institutional investors continues to increase. This is a characteristic often seen after the market completes the supply absorption process and moves into a new price base building phase.
Unlike the periods of 2021 and mid-2025 when MVRV remained in a high valuation range and unrealized profits expanded significantly, the indicators have now returned to neutral or slightly discounted territory. This reflects that much of the speculative profit from the previous cycle has been realized, making Ethereum's valuation more sustainable and significantly reducing the risk of further large-scale distributions.
ETH holdings on exchanges continue to remain at multi-year lows, while institutional investors and large-scale holders continue to increase their capital gains through accumulation. Although active buying in the spot market has not yet exploded, the decline in liquidity supply combined with steady accumulation is creating a more favorable supply-demand foundation for subsequent recovery phases.
Furthermore, indicators reflecting network health such as Metcalfe Divergence , Realized Price , staking activity, and the expansion of the Layer-2 ecosystem suggest that the current market price is still lagging behind the rate of improvement of the fundamentals. The intrinsic value of the Ethereum network continues to be strengthened through increased usage, protocol optimization, and a downward trend in the circulating supply. This divergence between market valuation and fundamentals signals that Ethereum is trading below the full long-term value of the ecosystem.
Disclaimer
This report was prepared by HCCVenture Research with the aim of providing information, research, and market analysis. The entire content of the report is based on publicly available data, on-chain data, market data, venture capital (Venture Capital) data, macroeconomic data, and HCCVenture's internal research methodologies at the time of publication. Data sources are compiled from numerous reputable research platforms and organizations, including but not limited to Glassnode, CoinGecko, TradingView, Dune Analytics, CoinGlass, CryptoRank, RootData, PitchBook, DefiLlama, CryptoQuant, Messari, Token Terminal, Artemis, CoinMarketCap , public blockchain data, reports from financial institutions, investment funds, blockchain companies, and other publicly available information sources. HCCVenture strives to select reliable data sources and applies a verification and cross-checking process throughout its research. However, HCCVenture does not guarantee the completeness, accuracy, timeliness, or error-free nature of all data due to differences in statistical methods, data collection scope, update times, or adjustments from data providers.
All opinions, assessments, valuation models, cyclical analysis, on-chain data, capital flow analysis, Venture Capital activity, ETFs, Digital Asset Treasury Companies (DATs), technical indicators, macroeconomic indicators, and scenarios presented in this report reflect only the research views of HCCVenture Research at the time of publication, based on available assumptions and data. These contents are not investment advice, financial advice, legal advice, accounting advice, tax advice, brokerage advice, portfolio management advice, or recommendations to buy, sell, or hold any digital asset, security, financial product, investment fund, blockchain protocol, or business. The digital asset and blockchain markets are highly volatile and are influenced by global liquidity, monetary policy, regulatory regulations, macroeconomic conditions, and many other unpredictable factors. Therefore, the trends, patterns, correlations, or historical cycles mentioned in this report are not guaranteed to repeat in the future and should not be considered reliable predictions of market developments. Readers should conduct their own independent research ( DYOR – Do Your Own Research ) and consult with qualified financial, legal, tax, or investment professionals before making any decisions. Any investment decisions or actions arising from the use of information in this report are the sole responsibility of the reader.
HCCVenture, its affiliates, research team, personnel, or related parties may own or will own digital assets, invest in blockchain projects, investment funds, technology companies, or maintain commercial, research, media, consulting, or collaborative relationships with the organizations, protocols, businesses, or platforms mentioned in this report. These relationships may create actual or potential conflicts of interest, although HCCVenture always applies internal research standards to maintain objectivity and independence in its analysis. Nothing in this report is construed as an offering, brokerage, promotion, fundraising, or provision of investment services as regulated by any country or territory. The entire content of this report is protected under intellectual property and copyright law. It is strictly prohibited to copy, modify, reproduce, distribute, or use all or part of this report for commercial purposes in any form without the written consent of HCCVenture. Accessing, using, or quoting this report signifies that the reader has understood, accepted, and agreed to the entire content of this disclaimer.
Explore HCCVenture group
HCCVenture © 2023. All rights reserved.


Connect with us
Popular content
Contact to us
E-mail : sp_contact@hccventure.com
Register : https://linktr.ee/holdcoincventure
Disclaimer: The information on this website is for informational purposes only and should not be considered investment advice. We are not responsible for any risks or losses arising from investment decisions based on the content here.
TERMS AND CONDITIONS • CUSTOMER PROTECTION POLICY
ANALYTICAL AND NEWS CONTENT IS COMPILED AND PROVIDED BY EXPERTS IN THE FIELD OF DIGITAL FINANCE AND BLOCKCHAIN BELONGING TO HCCVENTURE ORGANIZATION, INCLUDING OWNERSHIP OF THE CONTENT.
RESPONSIBLE FOR MANAGING ALL CONTENT AND ANALYSIS: HCCVENTURE FOUNDER - TRUONG MINH HUY
Read warnings about scams and phishing emails — REPORT A PROBLEM WITH OUR SITE.