


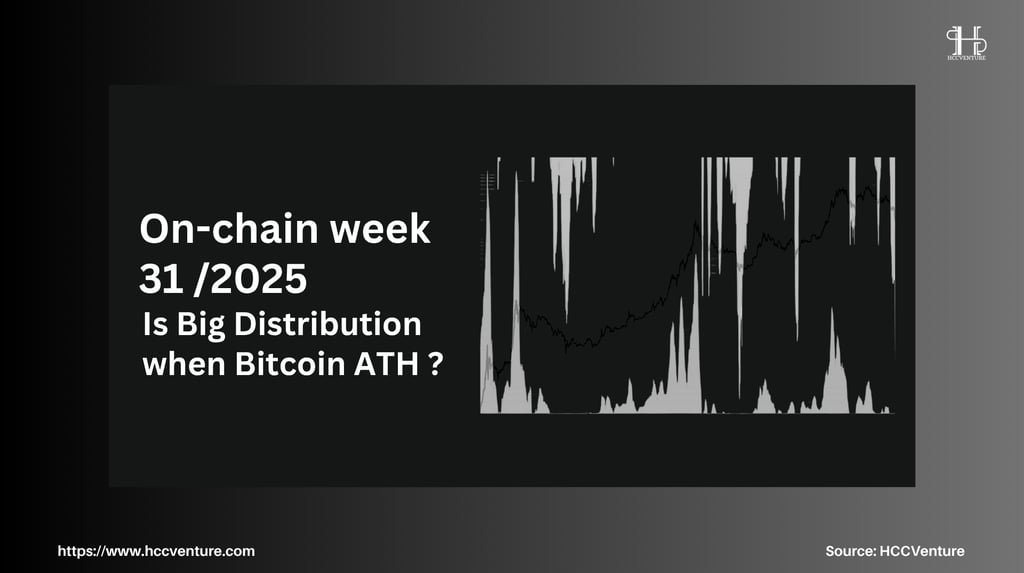
On-chain Analysis Week 31 / 2025: When Bitcoin Hits ATH, Will There Be a Massive Distribution?
Bitcoin has faced a massive liquidity stress test, as a long-term investor sold more than 80,000 BTC through Galaxy Digital’s OTC service – equivalent to $9.6 billion worth of sales.
8/3/20259 min read
Market Summary
The total unrealized value of on-chain investors reached $1.42 trillion, an all-time high. The supply in profit ratio (proportion of supply in profit) reached 97%, indicating that almost all investors are profitable on their BTC holdings.
The current market is more than six times as large in unrealized profits as it was at the cycle bottom in November 2022, when supply was only 53% profitable and total unrealized profits were only about $230 billion.
The peak of realized profits before the OTC distribution was $3.7 billion, according to the data. This is one of the largest realized profits ever. This shows that a large amount of assets were transferred to new investors.
Long-Term Holders (LTH) achieved their highest realized profit in the past week of $2.5 billion, surpassing the previous peak of $1.6 billion in 2021. The supply ratio of LTH to STH has decreased by 11% over the past 30 days, indicating a shift from long-term holders to short-term holders.
On-chain pricing models confirm that BTC is currently in a range between $105,000 and $125,000. There is a high chance that BTC will move to the $141,000 area if it breaks above $125,000. However, since most investors are taking large profits, this will also be the area with the strongest potential selling pressure.
On-chain metrics analysis
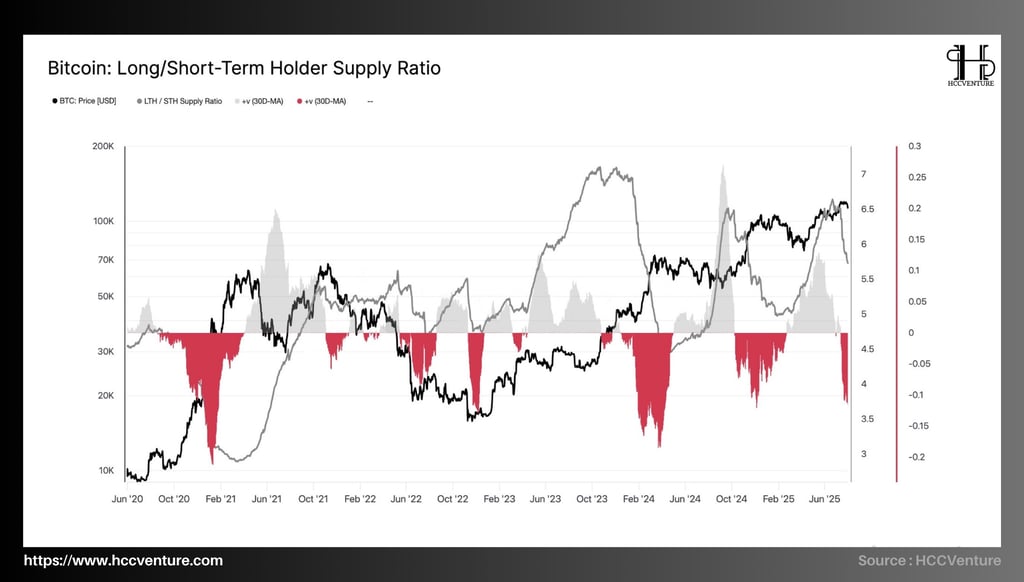
An important tool on the Bitcoin network is the ratio of short-term holdings (STH) to long-term holdings (LTH). These tools help determine investor behavior cycles and asset ownership flows on the Bitcoin network.
The LTH/STH supply ratio (gray line) is currently at 4.48, the lowest since early January 2023. This shows that the holdings of long-term investors have decreased sharply compared to the short-term group.
The index has fallen 11% in the past 30 days, and historical data shows that only 8.6% of trading days in history have seen a larger decline. This suggests that the intensity of distribution is at its peak. The entire chart from 2020 to the present shows a pattern of behavior that repeats itself at all three major price peaks of market cycles:
Accumulation phase: While short-term investors gradually withdraw from the market, long-term investors actively buy and hold, the LTH/STH ratio increases steadily.
Distribution Phase: The LTH group starts to make profits when the price approaches or surpasses the old peak. The LTH/STH ratio drops rapidly as it is now.
The index is at its highest distribution level since November 2021, when the market peaked at $69,000. This shows a systematic shift from long-term investors to a new generation of holders (STH).
During the 2021 bull run, the LTH/STH ratio fell from 7.2 to 3.9, representing a 45% correction. There was a significant price correction from $69,000 to $30,000 in just six months. While the index has not reached the extreme warning zone, it has fallen by about 32% from ~6.6 to 4.48. However, the recent 30-day moving average (red area — dv) is at -0.18 on the chart, indicating that the distribution momentum is as high as it was before the crash in May and December 2021.
For the long-term holders who have achieved expected returns during the bull market, the distribution pressure is being driven by the rapid contraction of the LTH/STH ratio. But importantly, the Bitcoin price has not changed too much; this shows that the market is able to effectively withstand this distribution pressure.
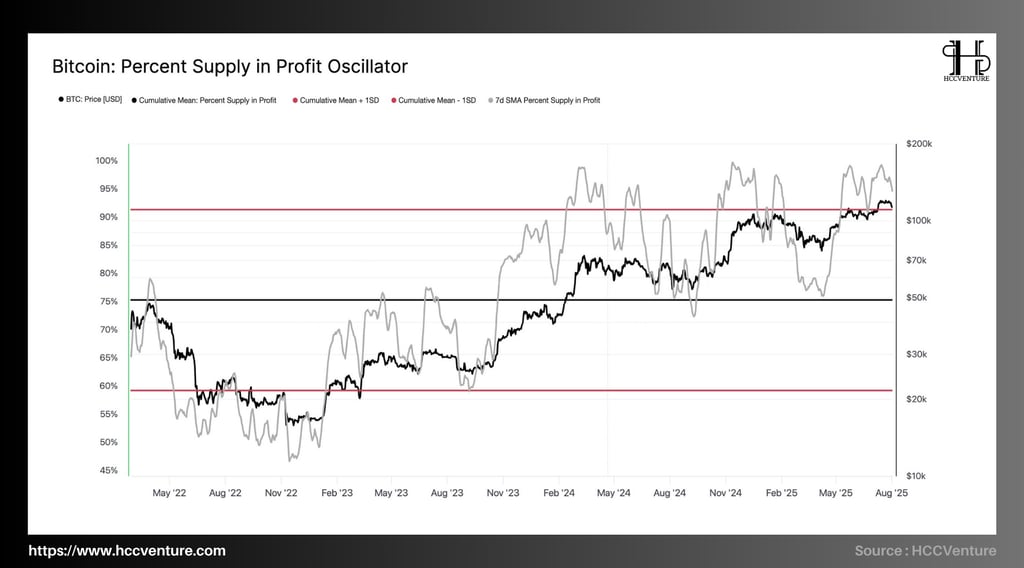
The “Supply to Profit Ratio” chart is an important tool that quantifies the percentage of Bitcoin supply that is in profit—that is, the current price is higher than the average purchase price of Bitcoins in circulation. According to the latest information:
Currently, over 97% of the total circulating supply is in profit, with the 7-day SMA ranging between 91 and 92 percent.
Bitcoin price is currently trading around $113,000–$119,000, significantly higher than the average price that most investors predicted.
The index is close to the +1SD band, or normal deviation, which is one standard deviation above the mean for the entire market cycle.
This index remained below 60% consistently from May 2022 to December 2022. This indicates a market bottom phase, when most investors have already taken unrealized losses.
The index begins to break out strongly from March 2023 onwards; it exceeds the historical average of 73 percent and peaks at 95 percent in the first quarter of 2024. The index remains stable at around 92 percent, near the peaks of previous cycles such as November 2021 and December 2017.
The unrealized profit ratio remaining above 90% for several consecutive weeks is a sign of a very sustainable holding structure. This reflects the expectation that prices will continue to rise rather than quick profit taking.
The high and sustainable unrealized profit ratio over a long period of time without a deep correction is the first event in history, showing that the current market has matured in terms of liquidity structure and investment expectations.

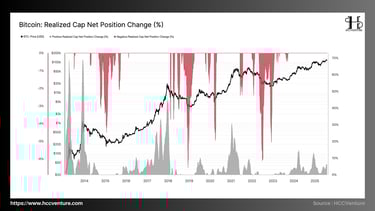
One of the fundamental tools in on-chain analysis is the overall position change index (%), which measures the amount of net capital flow (net inflow or net outflow) made by investors.
Bitcoin network cap surpassed $1.02 trillion in early August 2025. A prominent investor distributed 80,000 BTC, or about $9.6 billion, through Galaxy Digital over the past week, mostly through OTC trades.
Despite the large number of sales, the overall position change index completed did not record a significant negative decline compared to the 2021 or 2022 distribution phases. Instead, the index remained neutral to slightly positive, indicating capital inflows into the
Based on data from previous periods, there is no sign of an exodus or outflow of funds from the network. Instead, the data shows that new funds are continuing to pour in. There is no strong distribution wave on a large scale as evidenced by the lack of dense red clusters on the current chart compared to the capitulations in 2018, 2021, 2022.
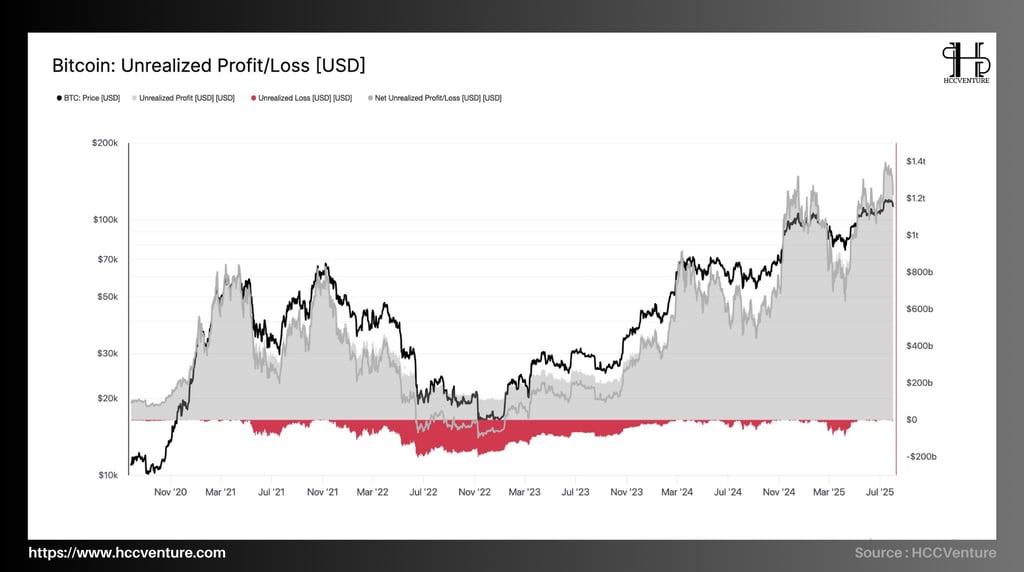
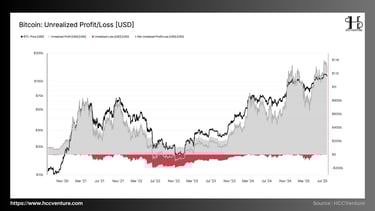
The Unrealized Profit/Loss (USD) index calculates the total value of unrealized profits or losses held by all investors. This index is created based on the difference between the current price and the average purchase price (cost basis).
As of now (August 2025), the Bitcoin network is at an all-time high. The total unrealized market profit has reached a record high of $1.4 trillion, demonstrating strong value accumulation and warning of potential profit-taking pressure.
Net Unrealized Profit/Loss (NUPL) is at an all-time high, matching the peaks in April and November 2021, when the subsequent major correction occurred. It is now well above past peaks in unrealized profits, indicating that speculation and expectations for further price increases are higher than ever before.
Several other indicators, such as the “Supply to Profit Ratio” and the “Realized Stock Position Change Ratio”, demonstrate that 97% of the supply is in profit. With such a large amount of unrealized profit, selling behavior, also known as realized profit taking, is likely to increase if the price continues to approach strong resistance levels such as $125K or $141K.
The market could continue its widespread distribution phase, the transition from "paper profits" to "real profits" if the price breaks above $125K.
Real money flow indicators show that Bitcoin can withstand the huge distribution pressure of the market, defining a highly mature liquidity structure, while its price is maintaining stability in the range of $115,000 to $120,000.
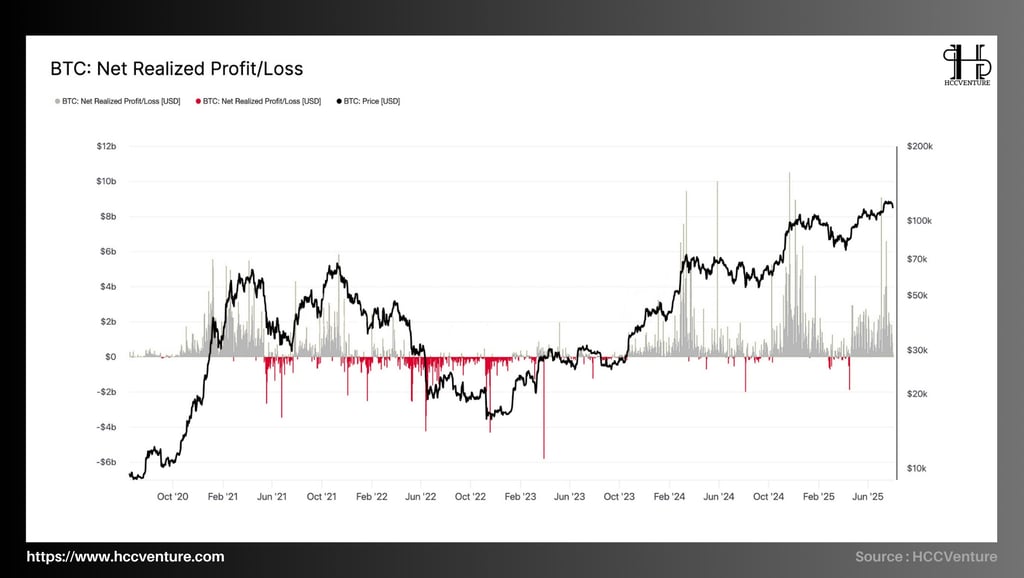
The difference between total profits and total losses made over a given period of time is shown by the Net Realized Profit/Loss indicator:
The index peaked at $3.7 billion in July 2025—an all-time high—far surpassing the $2.5 billion peak it reached in Q1 2024.
Notably, this notable increase comes on the heels of a distribution of 80,000 BTC—worth $9.6 trillion—from long-standing wallets via intermediary Galaxy Digital.
Negative realized values, also known as “red zones,” have been absent for more than 120 consecutive days, indicating that most recent trades have occurred in a profitable state, especially from investors who bought Bitcoin before it surged to $40,000 in
The market has received the largest amount of profit taking in history without a drop in price. This increases the sustainability and growth of current investment cash flow.
Due to the lack of liquidity depth in the market during the 2020–2021 bull cycle, spikes in Net Realized P/L (over $6B) typically resulted in sharp price corrections within the following 2–3 weeks. However, there was no apparent price weakness after the $3.7B spike in July 2025; on the contrary, prices continued to move sideways, hovering around $118,000–$120,000 in the most recent week.
Despite the huge profits being locked in, the market is still bullish, without any "dry demand" or panic selling like the previous cycle.
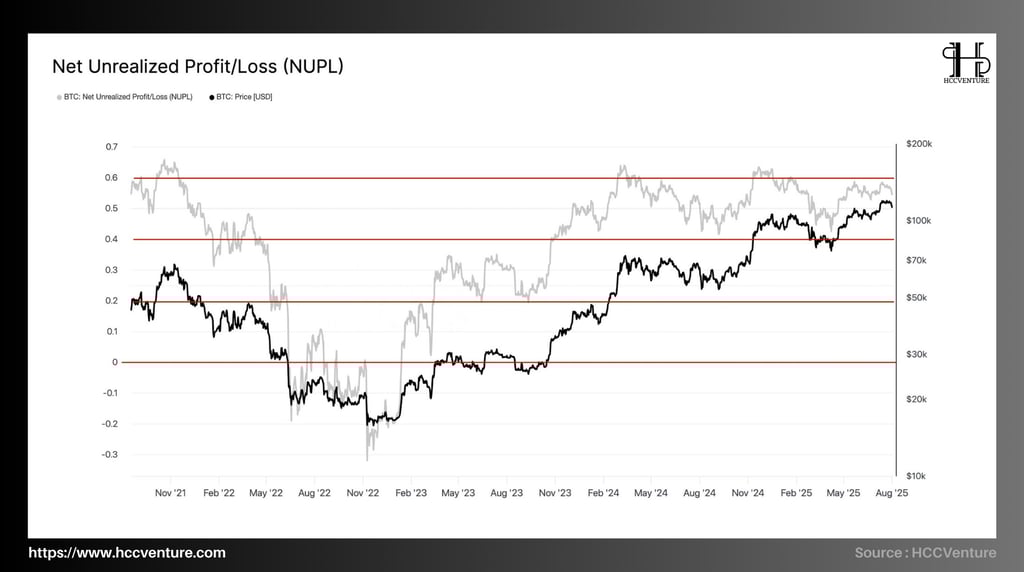
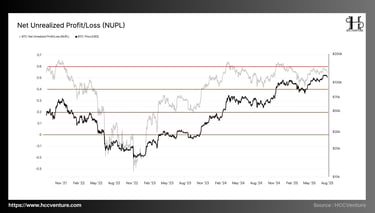
One of the best quantitative indicators of market sentiment is the NUPL index, which measures the difference between current holdings and average purchase prices. It shows profit-taking risk, expectations, and investor confidence across the market.
By early August 2002, the NUPL index reached a value of about 0.52, approaching the threshold of 0.6, marking the so-called "Greed and Faith" zone according to historical behavioral patterns.
Current NUPL (August 2025): ~0.52
All-time high (March 2021): ~0.61
The most recent cycle low was -0.28 in November 2022.
NUPL growth from bottom to present: from -0.28 to 0.52 → increase of +0.80 absolute points (equivalent to +286%).
The market is in unrealized profit as indicated by a positive NUPL (above 0). A reading above 0.5 indicates that most investors are booking temporary profits on their wallets. Although the market is still growing, it is still in a risky area in terms of psychological valuation. In previous cycles, this is an area that often leads to local tops or temporary technical corrections due to profit-taking pressure from long-term (LTH) and short-term (STH) investors.
From the bottom of the cycle in 2022 with negative NUPL (-0.28), equivalent to fear and despair (capitulation), the market has transformed strongly, especially from January 2022 to present, with sustainable growth and expansion of international institutional capital flows.
Therefore, when NUPL approaches the 0.6 threshold, market behavior is typically consistent with a euphoric optimism phase—a highly optimistic phase that is also the area with the highest probability of distribution in the history of cycles.
Evaluation and Conclusion
Blockchain data shows increased liquidity, tolerance for massive distribution pressure, and record levels of unrealized profit expectations, as the Bitcoin market nears a cyclical peak in terms of valuation.
Without any price structure break, the market has absorbed a large amount of value-changing coins. This is evidenced by the data from the maximum position change completed and the maximum number of transactions coming to the market.
The amount of USD liquidity accumulated in the Bitcoin network is now at an all-time high, surpassing the current $1.02 trillion mark. An example of the depth and quality of the current market is shown by the fact that the 80k BTC distribution via Galaxy Digital was done during a weekend time frame, when liquidity was low.
Unrealized profits, also known as unrealized profits, reached an all-time high of $1.4 trillion. Meanwhile, the proportion of profitable cryptocurrencies accounts for over 97% of the total circulating supply. The current NUPL is 0.52, surpassing the historical average (between 0.3 and 0.4) and approaching the distribution warning zone (above 0.6).
This is a bipolar zone where the market can move quickly in a strong bullish direction or make a technical correction in response to unrealized profit pressure with just a clear breakout.
Bitcoin has successfully weathered the biggest distribution crisis in its history while maintaining its technical and market sentiment. The current market is strong, supported by solid capital flows and on-chain confirmation data.
Disclaimer: The information presented in this article is the author's personal opinion on the cryptocurrency field. It is not intended to be financial or investment advice. Any investment decision should be based on careful consideration of your personal portfolio and risk tolerance. The views expressed in the article do not represent the official position of the platform. We recommend that readers conduct their own research and consult with a professional before making any investment decisions.
API & Data : Glassnode
Compiled and analyzed by HCCVenture
Join HCCVenture here: https://linktr.ee/holdcoincventure
Explore HCCVenture group
HCCVenture © 2023. All rights reserved.


Connect with us
Popular content
Contact to us
E-mail : sp_contact@hccventure.com
Register : https://linktr.ee/holdcoincventure
Disclaimer: The information on this website is for informational purposes only and should not be considered investment advice. We are not responsible for any risks or losses arising from investment decisions based on the content here.

TERMS AND CONDITIONS • CUSTOMER PROTECTION POLICY
ANALYTICAL AND NEWS CONTENT IS COMPILED AND PROVIDED BY EXPERTS IN THE FIELD OF DIGITAL FINANCE AND BLOCKCHAIN BELONGING TO HCCVENTURE ORGANIZATION, INCLUDING OWNERSHIP OF THE CONTENT.
RESPONSIBLE FOR MANAGING ALL CONTENT AND ANALYSIS: HCCVENTURE FOUNDER - TRUONG MINH HUY
Read warnings about scams and phishing emails — REPORT A PROBLEM WITH OUR SITE.