

On-chain analysis week 30/2026: The quiet actions of veteran whales
Following a recovery from below $58,000 to test $65,000, although the downtrend has been halted, the upward momentum is still not strong enough to create a new breakout trend as spot liquidity remains low.
PHÂN TÍCH
7/20/202611 min read
On-chain analysis week 30/2026: The quiet actions of veteran whales.
Following a recovery from below $58,000 to test $65,000, although the downtrend has been halted, the upward momentum is still not strong enough to create a new breakout trend as spot liquidity remains low.
Analysis • 4 July, 2026


Market Summary
One of the most important indicators comes from the Net Unrealized Profit (NUP) index . Bitcoin's NUP reached 0.358 while the price traded around $64,791 , a level close to the lowest point of its entire historical cycle rather than the profit zone typical of a bull market. The main reason for this is that the average cost (Realized Price) of the entire system has increased significantly after several quarters of continuous buying by institutional investors, Bitcoin Spot ETFs, and businesses accumulating Bitcoin at high prices. As the cost of the entire network increases, the unrealized profit ratio naturally narrows, even though the market price hasn't fallen significantly.
Besides NUP, the On-chain Trader Profit/Loss Margin indicator also shows a significant improvement in the status of short-term investors. Currently at -11% , it has recovered from deep losses and returned to a neutral range around -12% , reflecting that most trades executed during the recent downturn helped lower the average cost for short-term investors.
Although the derivatives market remains stable and shows no signs of excessive leverage, spot cash flow is still not strong enough to confirm the return of a medium-term uptrend. In this context, Bitcoin is likely to continue moving in a consolidation pattern with narrow fluctuations before forming new trend momentum.
Selling pressure from traders has eased, unrealized profits have re-established lows, and market structure is becoming more stable after months of correction. However, Bitcoin has yet to surpass the cost basis of short-term investors, nor has it attracted enough spot capital to confirm a new bull cycle.
Analyzing on-chain metrics
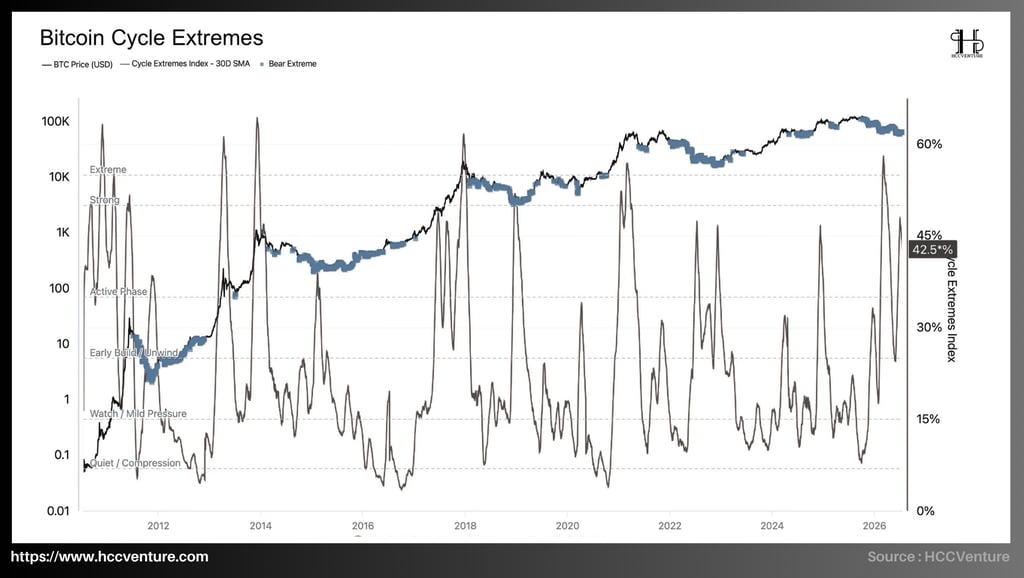
The Bitcoin Cycle Extremes Index is currently showing a positive neutral signal . The index has recovered significantly after a period of weakness but is still relatively far from the extreme zones that marked historical cycle peaks. The data suggests the market has not yet encountered the extreme conditions typically associated with cycle peaks, nor has it reached a level of panic large enough to form a long-term bottom. The index is currently hovering around 42.5% , reflecting Bitcoin's transitional phase between accumulation and trending, rather than entering an overly speculative phase.
The Bitcoin Cycle Extremes Index is a composite index of various on-chain signals and market data used to assess the extreme nature of the Bitcoin cycle. Historically, the index has often surged above 50-60% during periods of extreme market euphoria, and plummeted to below 10-15% during bear market phases. Therefore, the movement of this index often clearly reflects the warming or cooling of the entire Bitcoin ecosystem.
Currently, the 42.5% level is still significantly lower than the Strong and Extreme levels seen at the cycle peaks of 2013, 2017, and 2021 , when the index simultaneously surpassed 50% before Bitcoin entered deep corrections. Although Bitcoin has set new price highs in the recent cycle, the combined signals from investor returns, profit-taking, leverage, and cash flow have not yet unanimously confirmed an extreme euphoric state. Notably, the Cycle Extremes Index has remained above the 35–40% range for a relatively long period, instead of surging and then rapidly declining as in previous cycles.
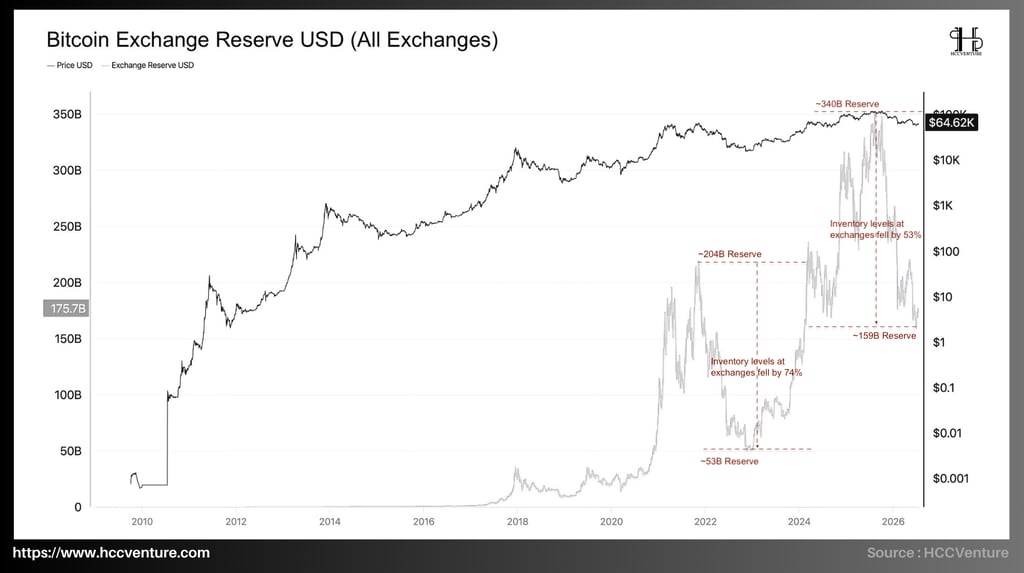
Exchange Reserve continues to reinforce the view that the supply of liquid Bitcoin on the spot market is becoming increasingly scarce , according to data from HCCVenture showing that the total value of Bitcoin held on exchanges is now only about $175.7 billion , significantly lower than the peak of nearly $340 billion recorded during the market peak in late 2025. Historically, the trend of Bitcoin withdrawals from exchanges has been ongoing for many years, but the rate has increased noticeably since 2021.
During the 2021–2022 cycle, the total amount of Bitcoin held on exchanges decreased from approximately $204 billion to $53 billion , a drop of about 74% . In the current cycle, after the value of Bitcoin held on exchanges reached nearly $340 billion at its peak, reserves have fallen to approximately $159–176 billion , a decline of about 53% . Although the rate of asset withdrawal is slower than in the previous cycle, the absolute scale still reflects a very large amount of Bitcoin being moved out of exchanges.
The decline in Exchange Reserves is generally seen as a positive signal for the long-term supply structure. As Bitcoin is withdrawn from exchanges and transferred to self-custodial wallets, ETFs, or specialized custodians, the amount of assets available for immediate trading decreases, easing natural selling pressure in the spot market and making liquidity scarcer during periods of increased demand. Instead of storing Bitcoin on centralized exchanges as in previous cycles, the majority of institutional capital is now held through professional custodians or long-term investment vehicles.
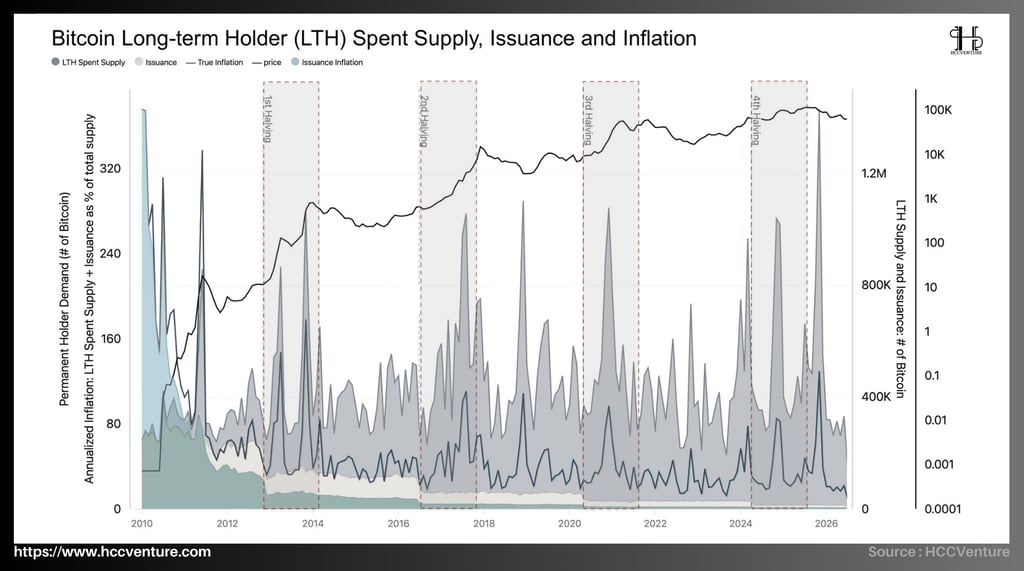
Bitcoin Long-term Holder (LTH) Spent Supply, Issuance, and Inflation indicate that Bitcoin's supply structure continues to heavily favor scarcity, with the supply of new Bitcoin issued after Halving becoming increasingly smaller while the amount of Bitcoin put back into circulation by long-term investors remains low. After the fourth Halving in April 2024, the block reward decreased from 6.25 BTC to 3.125 BTC , leaving only about 164,250 BTC issued annually , corresponding to a nominal inflation rate of less than 1% per year .
As primary supply continues to decline, the market's supply-demand balance becomes increasingly dependent on the selling decisions of long-term investors.
Historical data shows that after each Halving event, the issuance inflation rate decreases sharply and maintains a downward trend. Meanwhile, the amount of Bitcoin spent by long-term holders (LTH Spent Supply) only spikes during periods of extreme market euphoria or large-scale distribution events. The peaks of 2013, 2017, 2021 , and the 2025 cycle peak all recorded significant increases in LTH Spent Supply as long-term investors realized profits after years of accumulation.
However, after completing the distribution process during the peak of the cycle, the amount of Bitcoin sold by long-term holders has rapidly decreased again. Currently, the LTH Spent Supply line has returned to a significantly lower base compared to previous peaks, reflecting weakening distribution pressure from the long-term investor group.
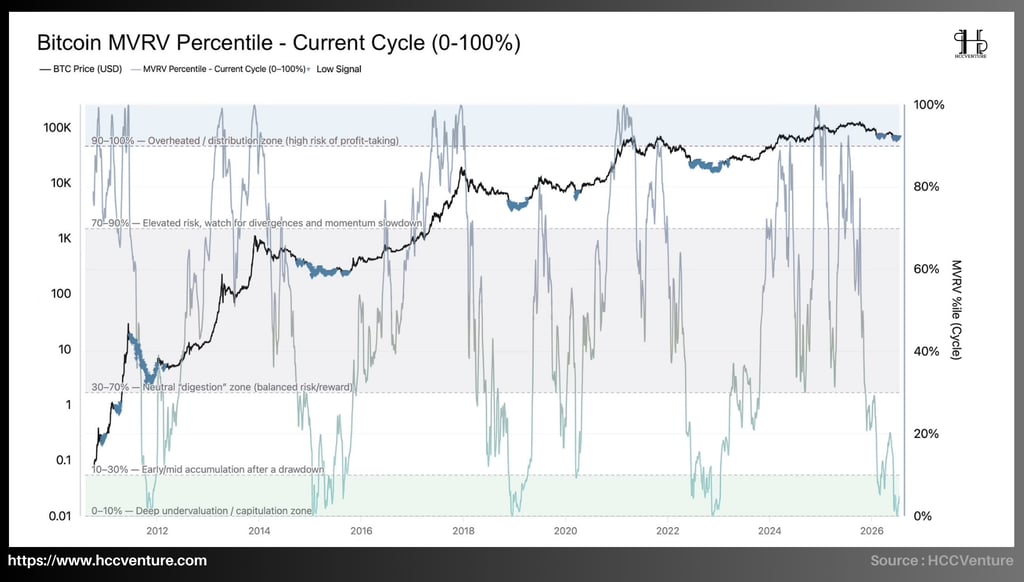
Bitcoin remains in the high valuation zone of the current cycle , reflecting continued positive unrealized profits for investors. However, the 90-100% range is also where the probability of profit-taking increases significantly, making the market more sensitive to short-term corrections.
Current data shows that the MVRV Percentile remains in the 90-100% range , although it has slightly declined after Bitcoin corrected from its peak above $100,000 to around $95,000-$97,000 . It is still trading in the highest valuation group of the 2022–2026 cycle, reflecting that a large proportion of investors on the network are still holding significant unrealized profits. However, the index has not recorded a breakout to the extreme and sustained levels seen at the peaks of the 2013, 2017, or 2021 cycles, suggesting that the euphoria is better controlled than in previous cycles.
The 0-10% range typically appears during the early stages of a bear market, when Bitcoin is undervalued and most investors are in a losing position. The 10-30% range reflects the accumulation phase after a sharp correction; 30-70% is the balance between risk and reward; 70-90% marks the beginning of valuation risk as network-wide returns increase; while 90-100% is the overheated market, where the probability of investors taking profits tends to increase significantly.
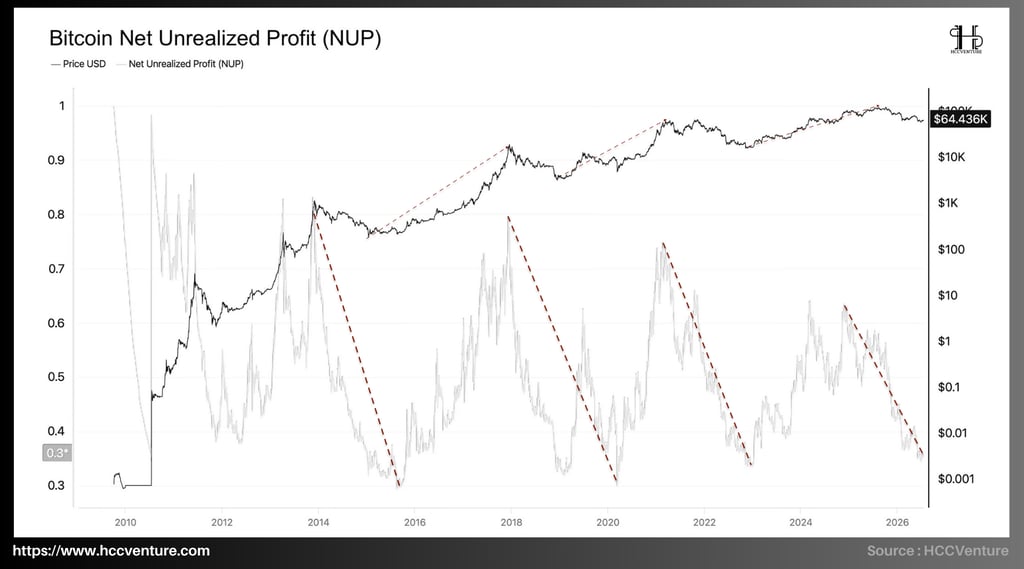
Bitcoin Net Unrealized Profit (NUP) is signaling that the network's profit margin has narrowed to the low end of the cycle, indicating that much of the euphoria has been removed from the market and the profit structure is moving closer to equilibrium. When NUP approaches 1, most investors are holding significant profits and the risk of taking profits increases; conversely, when NUP falls to 0.3 or lower, network profits are almost wiped out, and the market typically enters accumulation or bottoming phases.
Historical observations from 2011 to the present show that the NUP has consistently followed distinct cycles. Major market peaks in 2013, 2017, and 2021 all saw the NUP rise to the 0.75-0.85 range , reflecting periods of extreme euphoria where most investors reaped significant profits. After each distribution cycle, the index continuously declined, often bottoming out in the 0.28-0.35 range , corresponding to the sell-off and re-accumulation phases of a bear market. Currently, the NUP has returned to the 0.35 range , almost equivalent to historical lows, despite Bitcoin maintaining significantly higher market capitalization and price levels compared to previous cycles.
As a result, the unrealized profit margin has narrowed significantly, causing the NUP index to fall faster than the rate of Bitcoin's price decline. In other words, most of the profits accumulated during the previous growth phase have been absorbed through network revaluation rather than solely through the sharp drop in price. If Bitcoin continues to weaken below key support zones, the remaining profits will quickly turn into unrealized losses, increasing the likelihood of new sell-offs.
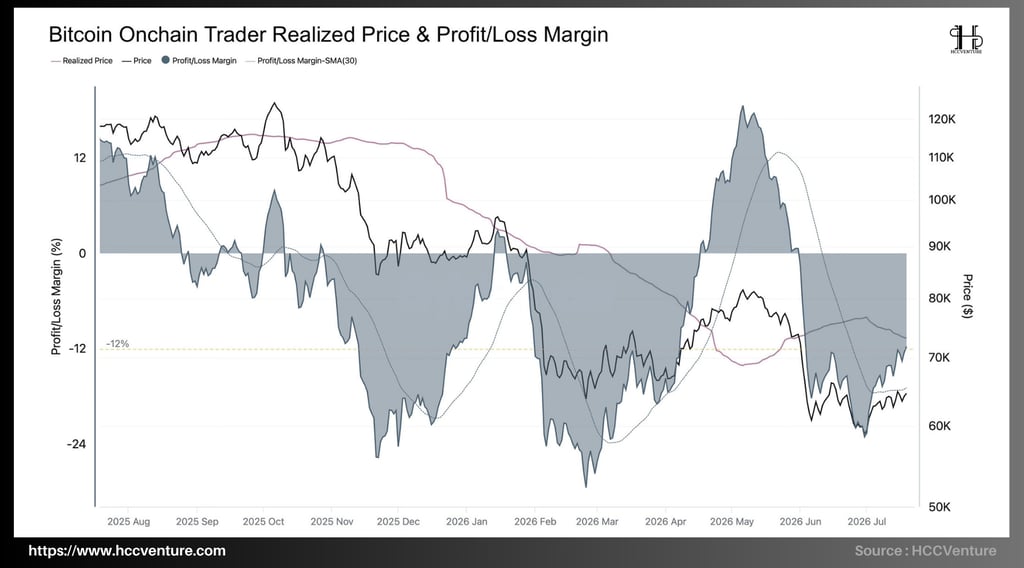
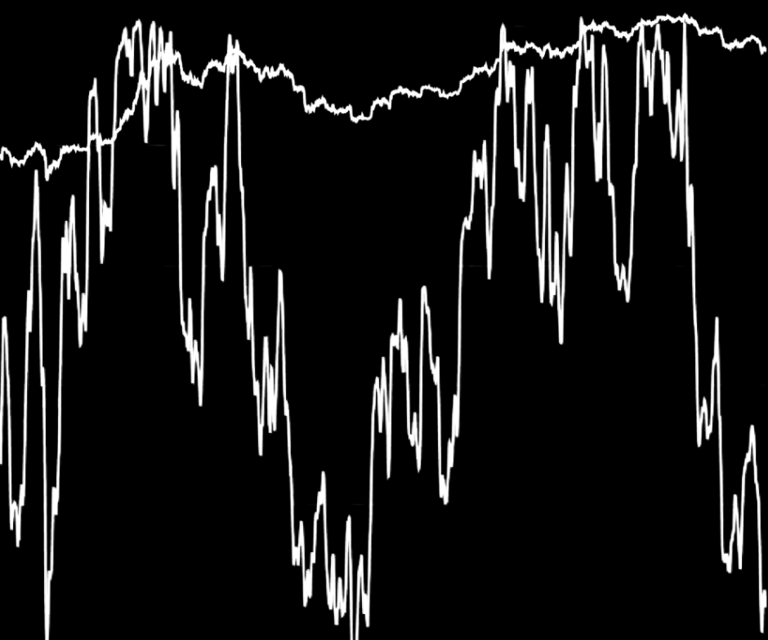
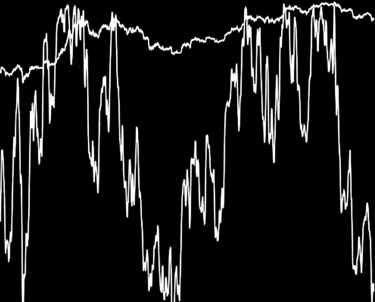
Bitcoin On-chain Trader Realized Price & Profit/Loss Margin reflects that selling pressure from short-term investors is significantly weakening after months of correction. Profit/Loss Margin has recovered from the capitulation zone of -11% , returning to neutral territory, while the average cost basis of traders continues to decline due to market revaluation. Simultaneously, the 30-day moving average of Profit/Loss Margin is also gradually rising after months of decline, reflecting a significant reduction in pressure to realize losses. However, the indicator remains below the break-even point (0%), suggesting that most short-term trading activity is still in a state of slight losses.
Historically, the -12% level has been considered a crucial equilibrium point for Profit/Loss Margin. When the index falls significantly below this level, the market often enters a state of intense selling as investors accept losses to exit their positions. Conversely, when Profit/Loss Margin recovers above the -12% level , selling pressure begins to weaken, and the market shifts from a surrender phase to a supply-demand equilibrium.
Another noteworthy factor is that the Trader Realized Price has been consistently declining over the past several months as the cost basis adjusted lower, and the gap between the spot price and the cost basis began to narrow. However, Bitcoin is still trading below the Trader Realized Price , meaning that the majority of investors who traded in recent months have not yet fully returned to a profitable state. In previous cycles, sustainable uptrends typically only formed after the price broke above the cost basis of short-term investors and maintained a sufficiently large gap to absorb the initial profit-taking supply.
Research and Analysis
Market Summary
Analyzing on-chain metrics
Net Unrealized Profit (NUP)
Bitcoin Cycle Extremes Index
Bitcoin Long-term Holder (LTH) Spent Supply
MVRV Percentile
Bitcoin Net Unrealized Profit
Bitcoin On-chain Trader Realized Price & Profit/Loss Margin
Power Law Oscillator
BTC Whale Taking Profit
Assessment and Conclusion
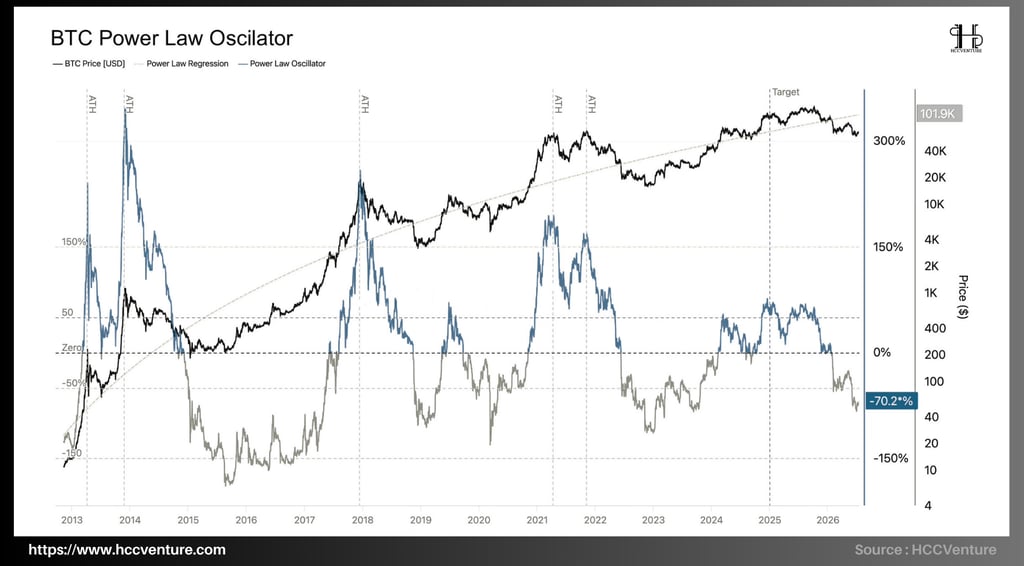
Unlike traditional valuation indicators such as MVRV or NUPL, the Power Law Oscillator assesses the long-term position of price by determining how high or low Bitcoin is trading relative to the historical upward trend of the entire network. A positive value indicates the market is trading above the long-term trend, while a negative value reflects Bitcoin being undervalued below the equilibrium level according to the Power Law model.
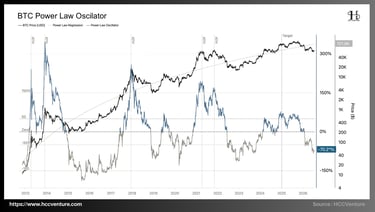
The Power Law Oscillator has fallen to approximately -70.2% , significantly below neutral and at its lowest level since the beginning of the 2023–2026 cycle. The index has steadily declined from positive territory in 2024–2025 to well below 0%, reflecting that the entire valuation extension of the previous bull cycle has been almost completely wiped out.
Historical observations show that the peaks of the 2013, 2017, and 2021 cycles all occurred when the Power Law Oscillator expanded to the 150–300% range , reflecting overvaluation relative to the long-term uptrend. Conversely, bear markets typically end when the index falls to the -100% to -150% range , corresponding to the period when Bitcoin was at its lowest valuation in the cycle. In the current cycle, the index has not entered the overheated zone like previous cycles, but has only achieved relatively modest expansion before reversing downwards.
The BTC Power Law Oscillator shows that Bitcoin is currently trading below its long-term uptrend with a deviation of approximately -70% , reflecting that much of the previous cycle's high valuation has been eliminated. This is a significantly more attractive valuation zone than the 2025 peak, and confirms the market has entered a long-term rebalancing phase.
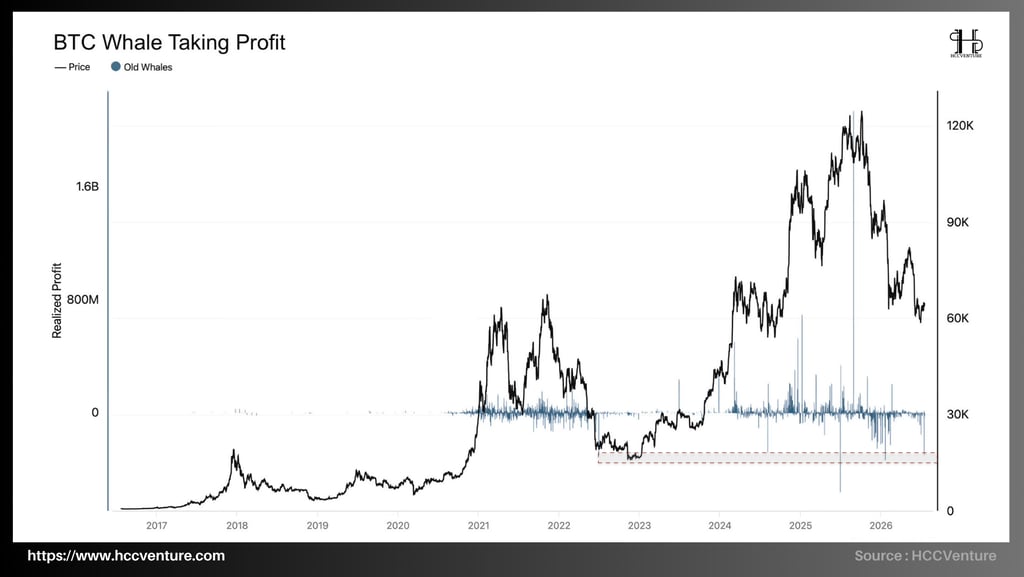
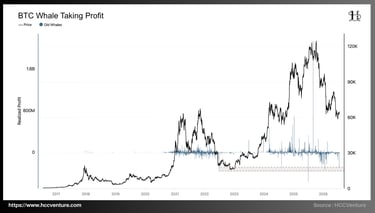
The BTC Whale Taking Profit trend shows that selling pressure from long-standing whales has significantly decreased after completing profit realization during the 2025 historical peak, which is a positive sign for the market's supply structure, as the low-cost supply that previously exerted significant pressure on prices has been largely absorbed by new capital inflows in the past cycle.
After successive large-scale profit-taking waves throughout Bitcoin's all-time high of over $120,000 , the Realized Profit (ROI) value of the Old Whales group is currently fluctuating around the neutral zone, even slightly negative at times. Observing the 2020–2022 cycle shows that strong increases in the Whale Taking Profit index often coincide with accelerated Bitcoin price surges. When profits reach extremely high levels, selling pressure from long-term holders increases, usually marking the end of an uptrend.
In the current cycle, although there have been many instances of whales realizing profits on a scale of hundreds of millions of USD, this selling pressure has been relatively effectively absorbed by the market for much of 2024 and 2025 thanks to capital inflows from spot ETFs, listed companies, and financial institutions. However, as new capital inflows weaken in 2026, the previously distributed supply will begin to put pressure on the price, causing Bitcoin to enter a prolonged period of correction and accumulation.
One notable point is that profit-taking activity has now significantly decreased since the peak , instead of continuing to expand. Instead of continuously selling, long-term wallets are now tending to reduce the frequency of asset transfers, suggesting that the main distribution phase of the cycle has likely been completed.
Our assessment and conclusions
Although prices have corrected by more than 50% from their all-time highs, most long-term valuation indicators such as MVRV, NUP, Power Law Oscillator, Profit/Loss Margin , and Whale Taking Profit reflect a significant reduction in market euphoria, while selling pressure tends to gradually decrease over time. Notably, many indicators show that the network's unrealized profits have narrowed to lows in the cycle , but the market has yet to show the full-blown surrender signals that marked bottoms in previous cycles.
The circulating supply on exchanges continues to remain low , while the amount of Bitcoin held by long-term investors remains at historical highs. Simultaneously, profit-taking activity by long-term whales has significantly decreased following a period of strong distribution at the peak.
The cycle peaked with lower levels of euphoria, institutional capital flows significantly increased Realized Capitalization, while the volatility of valuation indicators continued to narrow. This means the current correction is primarily occurring over time and through the re-valuation of the network, rather than an extreme sell-off like in previous cycles.
If institutional capital, ETFs, and businesses continue to absorb supply in the coming period while the amount of Bitcoin circulating in the market remains low, the possibility of forming a new growth phase with the goal of surpassing the previous historical peak will continue to strengthen. This scenario is supported by the current on-chain data structure, although it still needs to be confirmed by a simultaneous improvement in capital flows and market momentum.
Disclaimer: The information presented in this article is the author's personal opinion in the field of cryptocurrency. This is not financial or investment advice. All investment decisions should be based on careful consideration of your personal portfolio and risk tolerance. The views expressed in this article do not represent the official stance of the platform. We recommend that readers conduct their own research and consult with experts before making any investment decisions.
API & Data : Glassnode
Compiled and analyzed by HCCVenture
Turn on notifications on our channels: https://link3.to/holdcoincventure
Explore HCCVenture group
HCCVENTURE QUANT JSCO
© 2026 HCCVENTURE. ALL COPYRIGHTS RESERVED.


Connect with us
Popular content
Contact to us
Address: 8th Floor, Bach Dang Complex Building, 50 Bach Dang Street, Hai Chau Ward, Da Nang City, Vietnam.
Phone: 1900 1509
Gmail : sp_contact@hccventure.com
Disclaimer: The information on this website is for informational purposes only and should not be considered investment advice. We are not responsible for any risks or losses arising from investment decisions based on the content here.
TERMS AND CONDITIONS • CUSTOMER PROTECTION POLICY
ANALYTICAL AND NEWS CONTENT IS COMPILED AND PROVIDED BY EXPERTS IN THE FIELD OF DIGITAL FINANCE AND BLOCKCHAIN BELONGING TO HCCVENTURE ORGANIZATION, INCLUDING OWNERSHIP OF THE CONTENT.
RESPONSIBLE FOR MANAGING ALL CONTENT AND ANALYSIS: HCCVENTURE FOUNDER - TRUONG MINH HUY
Read warnings about scams and phishing emails — REPORT A PROBLEM WITH OUR SITE.