


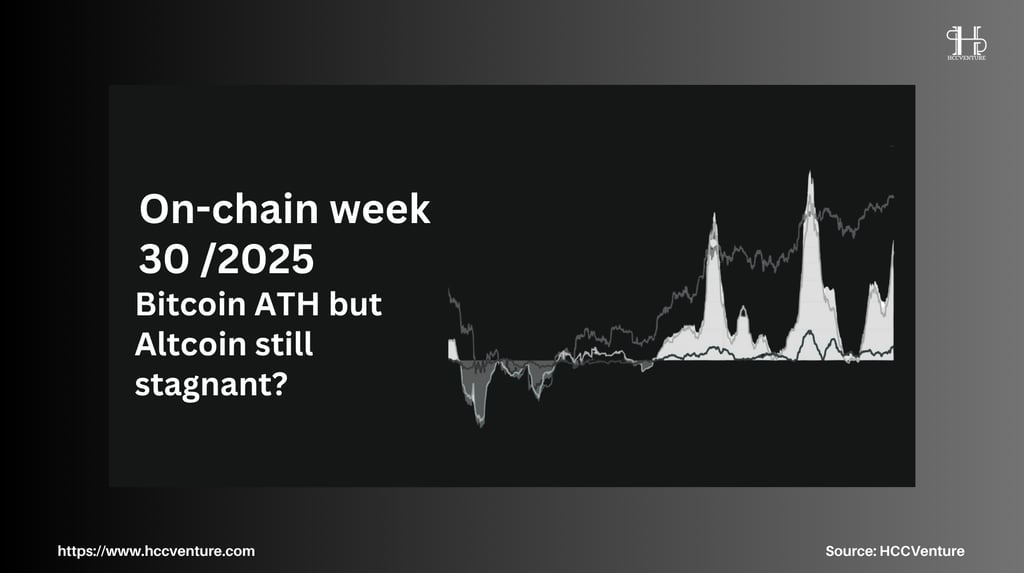
On-chain analysis week 30 / 2025: Bitcoin ATH but Altcoin still lying still ?
While the Altcoin market exploded, with a total capitalization increase of more than $216 billion in just two weeks, led by Ethereum, it announced the value of Bitcoin as a liquid macro asset.
7/27/202510 min read
Market Summary
Bitcoin's Realized Cap has hit $1 trillion for the first time in history, indicating that the largest ever committed long-term capital inflow into the BTC ecosystem is largely driven by short-term speculative behavior and primarily from large addresses, such as those
The total Altcoin market cap has increased by $216 billion over the past week. Ethereum is a notable example, with its current price ranging between $4,300 and $4,500, breaking through multiple layers of on-chain resistance, such as the current investor price ($3,850) and the real market price ($4,100).
But Open Interest (OI) figures in the derivatives market show a higher risk. Since the beginning of July, total Altcoin OI has increased from $26 billion to $44 billion. This shows that leverage is concentrated in sensitive price areas, with Ethereum accounting for 35%.
Market sensitivity to volatility (reflexivity) increases with market capitalization and OI. A small drop can trigger a liquidation cascade; volatility is “two-way”, amplifying both upside and downside.
On-chain metrics analysis
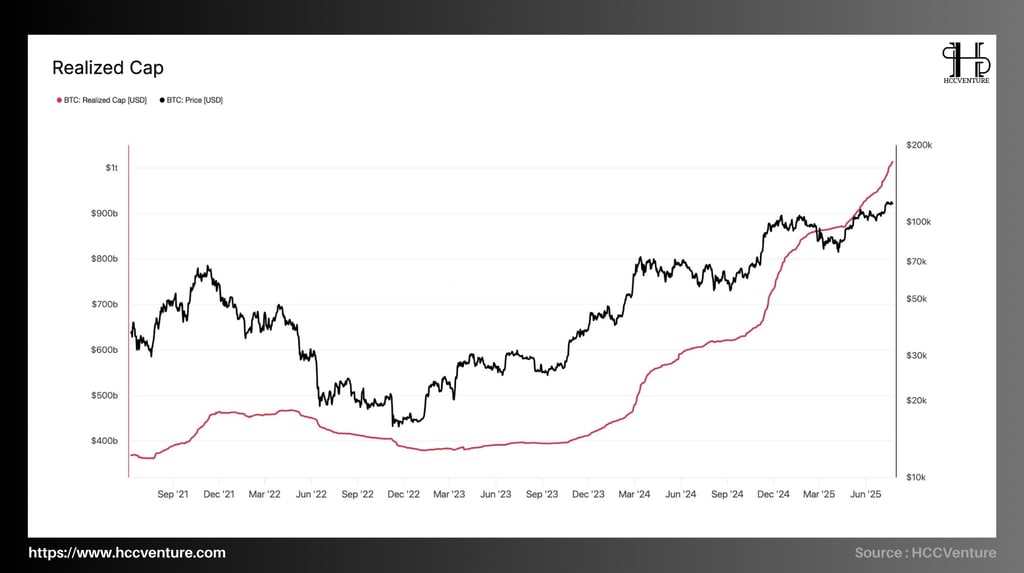
During the last trading week of July 2025 , the cryptocurrency market witnessed a major milestone in its history. Bitcoin's completed volume surpassed the $1 trillion mark for the first time , marking a major shift in liquidity and asset growth.
Realized Cap measures the value held by each coin at the time of its last move, reflecting the long-term confidence and expectations of investors. This is different from market capitalization, which is driven by short-term price changes. With a trillion dollar value, Bitcoin has officially become one of the most liquid macro assets on par with conventional financial instruments.
A steady growth trend is shown on the Realized Cap Chart (red line), starting from the December 2022 bottom (~$422 billion USD) to $1 trillion by the end of July 2025. Specifically:
Absolute growth increased by $578 billion
Total growth rate is 137% in just 18 months
The strongest bullish phase occurs from October 2023 to May 2025, when the market breaks the $70,000 resistance and attracts institutional money.
It is a sign that a lot of supply is being held at higher prices, indicating that investors are “committing capital” to the new price level rather than short-term speculation. The inflows are mainly from highly informed individuals, financial institutions (ETFs, custodian banks) and long-term holders. Holders claim that there is no tendency for capital outflow during corrections.
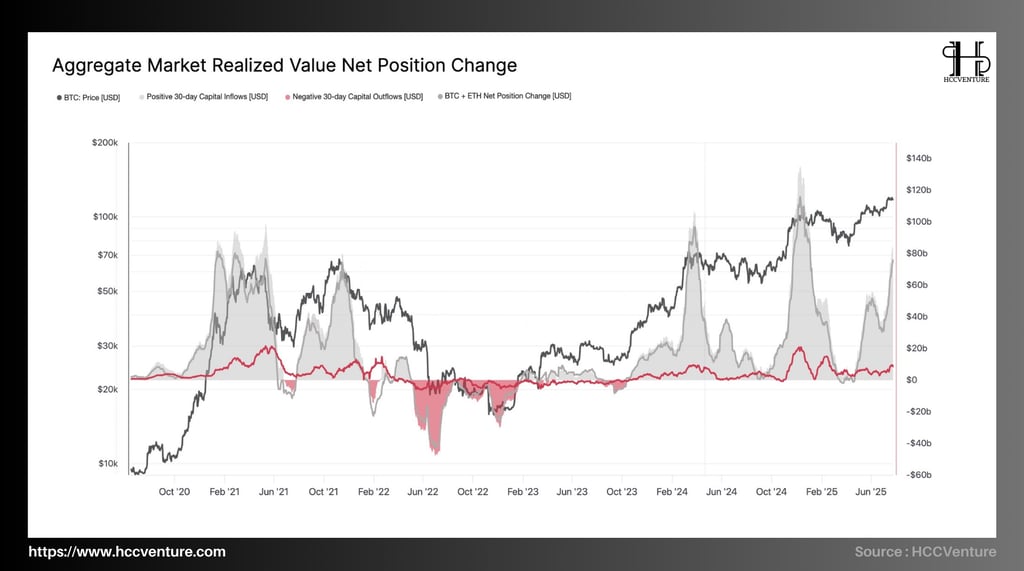

The digital asset market, especially Bitcoin, has recorded a positive comeback amid growing confidence in the global financial market due to expectations of a rate cut by the US Federal Reserve in the fourth quarter of 2025 .
The positive return of net cash flows suggests the growth cycle is continuing and provides a solid liquidity foundation to support higher valuations going forward.
As of the last week of July 2025, positive net capital flows—also known as average position changes— had surpassed $60 billion , the highest level since March 2024, when Bitcoin broke $75,000.
The large return of institutional and strategic investment flows in the current period is evidenced by the thirty-day grey margin. In addition, the red zone, representing net withdrawals, also known as outflows, has been completely absent since April 2025, after more than a decade of steady net inflows.
With previous notable growth stages:
During the 2021 crisis, net capital inflows peaked at $45–50 billion.
In March 2024, Bitcoin spot ETF speculation pushed capital inflows to $55 billion.
It is currently at an all-time high of $60–62 billion.
The net capital growth not accompanied by strong distributions or high volatility is evidence that the buying spree is not speculative. The inflows include not only Bitcoin but also Ethereum and infrastructure assets. This demonstrates long-term confidence in the entire crypto ecosystem as a new asset class.
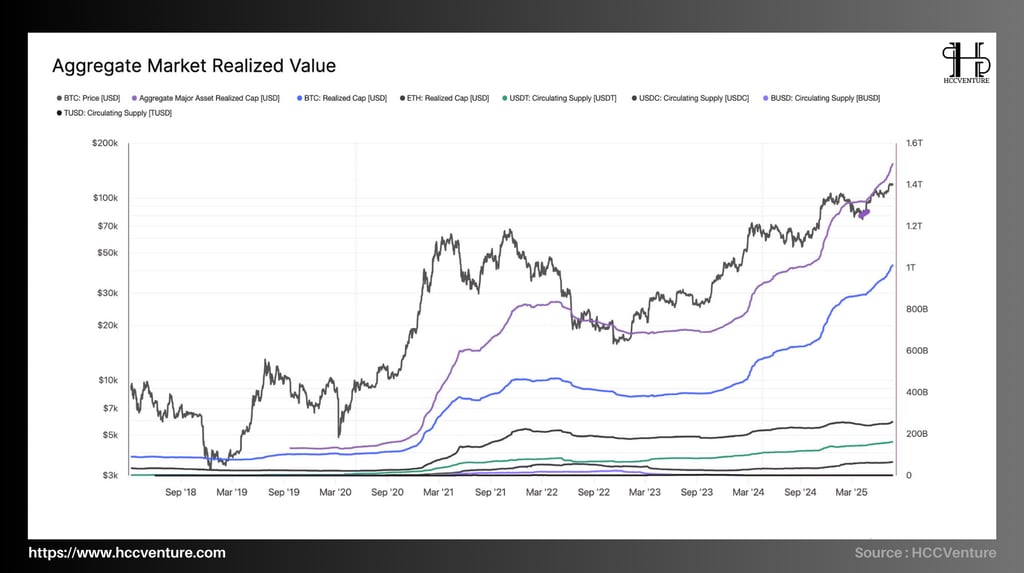
The aggregate real value of the digital asset market—known as realized market value—surpassed $1.45 trillion in the last week of July 2025, marking a major milestone in the valuation structure of the digital asset market. It includes:
Total actual capital achieved (total actual capital): currently at 1,450 billion USD
Bitcoin's real market capitalization has reached $1.03 trillion, marking the first time in history that it has reached a $1 trillion market capitalization.
Total value of ETH: still stable around $250 billion
Circulating supply of stablecoins (USDT, USDC, BUSD and TUSD): total around $138-150 billion, increasing sharply since the beginning of 2025.
The current growth is +115% from the December 2022 bottom, when the total liquid market capitalization was just $675 billion. In less than two years, the total liquid market capitalization has doubled.
The steady price increase of BTC and ETH is the main reason for this surge. This helps to increase the capital value across the entire network. Most investors do not sell immediately when they make a profit due to high HODL ratio and long-term accumulation behavior. This keeps the money in the system longer.
Market liquidity is fueled by the increase in stablecoin supply. With a circulating capitalization of over $115 billion, USDT accounts for the majority. The increase in stablecoin capital in the short term is an important sign of liquidity health and continued investment demand.
The current cash flow structure is not only larger in scale but also shows greater depth and sustainability. Real capital value is always superior while holding behavior and withdrawal rate are low.
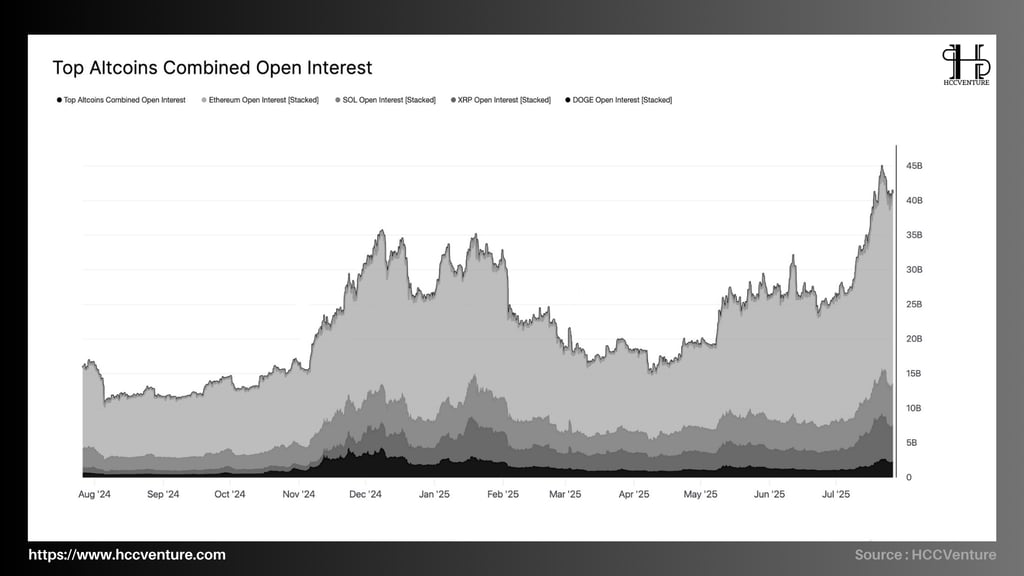

The “Combined Open Interest” index shows open positions (unliquidated futures contracts) of popular altcoins such as Ethereum, Solana, XRP, and Dogecoin. It has increased by a whopping 69% in less than a month from $26 billion at the beginning of July to $44 billion as of July 26, 202025.
The rapid expansion of leverage indicates that the market is moving into a state of euphoria and clear speculation. Traders are rushing to open long positions in the hope of short-term profits based on the recent bullish trend. This includes:
Ethereum (ETH) still accounts for more than 50% of OI, affirming its leading position in the altcoin market, while Solana (SOL) and XRP also increased sharply in OI, especially from mid-July onwards.
Although Dogecoin (DOGE) is smaller, it is clearly on the rise, demonstrating speculative spread to high-beta assets.
The expansion of OI volume not only stops at ETH but also spreads to mid- and small-cap altcoins, which is a sign that the market is entering a "leveraged bubble" phase, in which money is encouraged to take on higher risks in the hope of achieving higher returns.
The current leverage level is comparable to the late 2021 and early 2022 bull run. It is even higher than the peak of total OI in November 2021, which was around $40 billion. This was especially important during that period, as price corrections of 20 to 30% occurred within days of the peak leverage.
While prices are rising, the market is starting to exhibit high reflexivity, also known as “liquidity bias”. This could lead to a deep decline if there are any macro shocks, automatic liquidations or unexpected regulatory events.

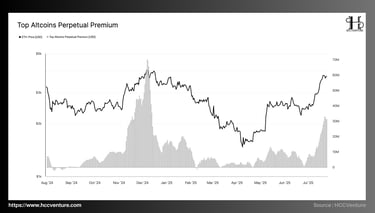
Total monthly investment in top altcoins reached $32.9 million on July 26, 2025, up sharply from an average of just $12–15 million in Q1 2025. Current levels are close to previous peaks:
Compared to Bitcoin's $100K peak in March 2024, funding profits reached $42 million per month, much higher than the bottom in early 2025 ($9 million per month).
Below the extreme $70M per month in November 2024, when the market exploded after the $100K breakout.
As investors are increasingly willing to pay high fees to hold long positions, leverage is growing rapidly. The chart shows that ETH price has increased from $2,100 to $3,800 in the last 45 days, which shows that the bullish momentum is real but also shows high accumulation risk.
A deeper analysis of the cyclical behavior will reveal that premium funding typically increases at peak speculative times, just before the market begins a correction phase:
Funding rates were consistently high in November 2021 and March 2022. Then, due to mass liquidations, funding rates dropped by 25–40%.
Currently, the premium rate has exceeded the 90-day average, a sign that the market is “overheated”.
A market structure model can break down when widespread liquidation occurs because futures trading volume does not increase in proportion to actual trading volume.
The current premium funding level of $33 million per month is a sign that the altcoin market is entering a period of active speculation, with leverage being widely used.
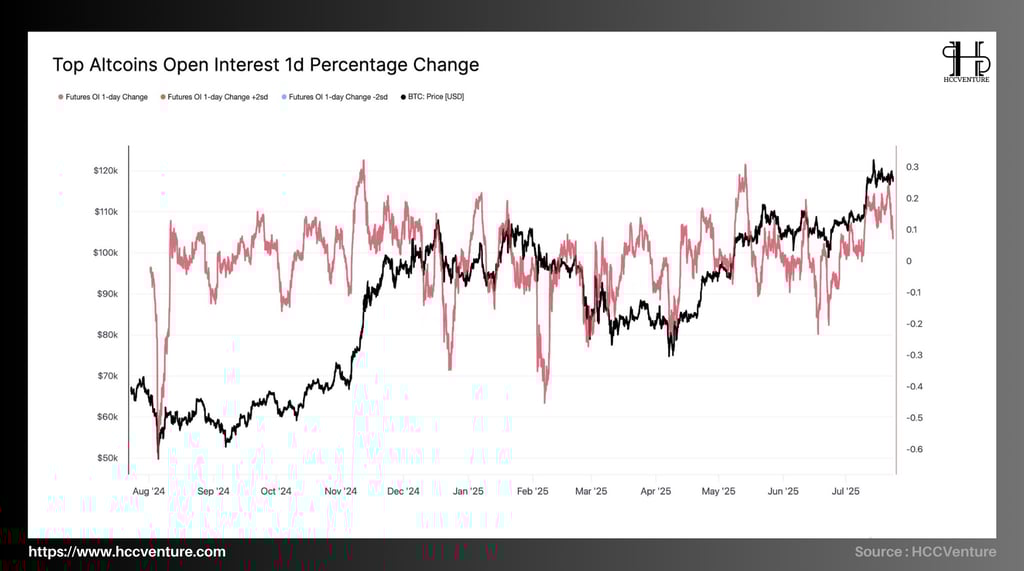
Since the beginning of July 2025, the Open Interest growth rate of altcoins has been consistently above the +2 standard deviation (2-sd) threshold, with a daily fluctuation range of +0.15 to +0.28 and has remained stable for more than twelve consecutive trading sessions.
OI increased more rapidly and consistently than in previous cycles, while BTC price rose in parallel over a similar period from $92,000 to $114,000.
The streak of days exceeding +2sd never lasted more than 7 consecutive sessions during the bull market period of late 2020 to early 2021. Before the breakout to $100K happened, there were only 5 consecutive sessions of strong OI increase. After that, it was a short-term correction.
The significant increase and its persistence above normal volatility levels suggest that this is a systematic manifestation of large-scale, synchronized, and potentially organized speculative money flows.
Three scenarios are typically associated with a spike in daily OI:
(1) The altcoin market receives new cash flow, showing confidence and high profit expectations.
(2) Clients can quickly open buying positions by increasing short-term leverage.
(3) After the funding level increases, the cost of maintaining the position increases—which can easily lead to mass liquidation when the price turns around.
All three factors are converging. This creates a risk of a sharp correction in the event of an exogenous factor, while allowing prices to continue rising in the short term. A particularly important signal in quantitative analysis is that the daily Open Interest Change remains above +2 standard deviations for twelve consecutive sessions.

The last trading week of July 2025 saw a stark divergence between Bitcoin and the rest of the digital asset ecosystem. Nearly all altcoins saw significant increases in both price and volume, while BTC remained in a sideways consolidation between $114,000 and $116,000. A common phenomenon occurring in the middle of a bull cycle is a wave of capital rotation along the risk curve.
During the middle of a bull cycle, investors start looking for higher returns by shifting capital from low-risk assets (such as BTC) to higher-beta assets (such as memes, NFTs, AI, games, etc.). This is known as
Money is gradually shifting to more speculative assets, marking an extension of the current bull run, as on-chain data shows. However, this also means that the market has become more sensitive to liquidity shocks or unexpected negative macro or policy news.
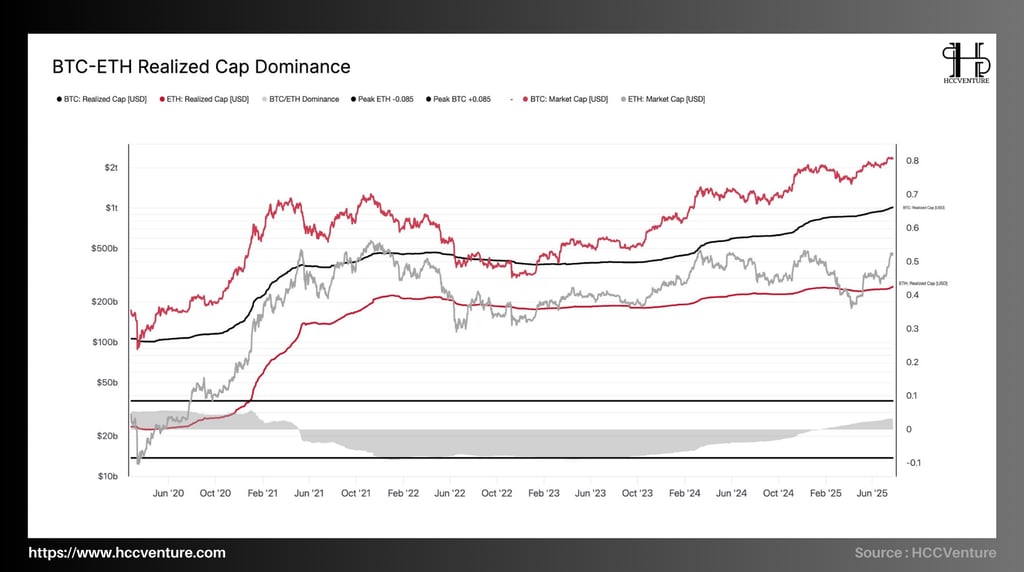
Reflecting the peak of Ethereum ecosystem expectations, ETH once approached BTC's 0.53 Realized Cap during the bull run in late 2021. However, from mid-2022 to mid-2024, BTC continuously widened the gap and maintained its dominance between 0.65 and 0.75 for nearly 24 consecutive months. This shows long-term confidence in BTC, especially in situations of liquidity crisis, strict monetary policy
While the ratio is currently hovering near neutral territory, it is sloping upward in favor of BTC, reflecting that long-term money flows tend to return to “safe havens” as the market enters a speculative cycle.
Despite short-term price fluctuations, long-term capital inflows—also known as long-term holders—continue to increase steadily, according to the stability of the Realized Cap BTC index. This is a sign of solid accumulation behavior, which is important for market sustainability.
In contrast, the total new capital entering ETH is mostly short-term speculation and has not been “built” into a long-term commitment, so the total capital gain of ETH has remained in a sideways range for the past twelve months.
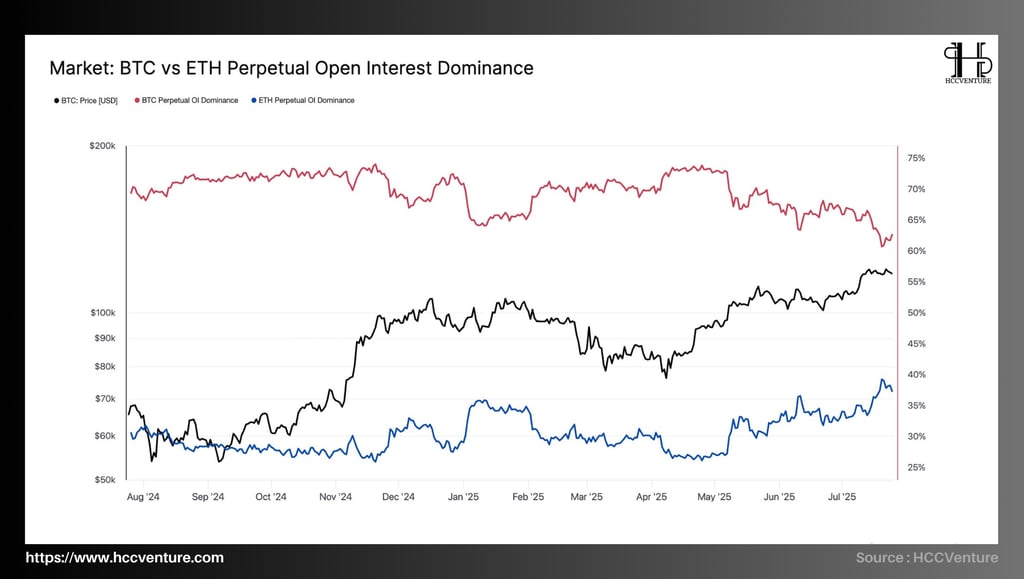
ETH's Perpetual OI dominance is 38%, while BTC's OI dominance is 62%. In the derivatives structure, BTC has decreased by 11 percentage points compared to the March 2025 period, when BTC accounted for 73% of OI and ETH was only at 27%.
DOMINANCE ETH OI is at its highest level since April 2023 and accounts for 5% of the trading sessions with the highest dominance over the past two years. This shows that speculative sentiment is tilted towards Ethereum, although BTC still plays the role of "core liquidity" in the spot market.
In line with Ethereum’s price recovery above $3,600, ETH’s OI increase is not random; this suggests that the majority of the OI increase is coming from active long positions with bullish plans, rather than hedging or technical shorting.
It is worth noting that since June, ETH's OI has been increasing steadily despite the sideways BTC price index. This shows a divergence between price momentum and expected leverage and confirms the risk allocation model is shifting towards altcoins.
Evaluation and Conclusion
The 2024–2025 cycle will see a clear divergence in the cryptocurrency market. Bitcoin is seen as a price anchor, while altcoins such as Ethereum, Solana, XRP, and Dogecoin are seen as high-performance speculative vehicles. Due to liquidity pressure and defensive sentiment, altcoins underperform for most of the cycle.
In July 2020, the total amount of available cash on major altcoins such as ETH, SOL, XRP and DOGE increased from $26 billion to $44 billion, a 69% increase. This is the fastest increase in a month since late 2021, when the bull market peaked.
The Perpetual Premium for altcoin contracts is now $32.9 million per month, approaching the $42 million per month peak in March 2022. It is also just behind the historic $70 million peak during BTC's $100K breakout in late 2024.
While Bitcoin trades between $110,000 and $115,000, ETH and altcoins are attracting new speculative inflows, creating a divergence between growth and defensive assets. This is evidenced by the decline in BTC Perpetual Dominance from over 70% to 62%.
The correlation between altcoin groups is increasing strongly, indicating that the current rally is comprehensive and no longer affected by the fundamental components of each token. This is mainly due to the risk-on-chain flow, also known as risk-on-chain
We are seeing a clear shift in market risk appetite, and on-chain metrics and speculative indicators are demonstrating a strong resurgence of speculative capital into altcoins.
Disclaimer: The information presented in this article is the author's personal opinion on the cryptocurrency field. It is not intended to be financial or investment advice. Any investment decision should be based on careful consideration of your personal portfolio and risk tolerance. The views expressed in the article do not represent the official position of the platform. We recommend that readers conduct their own research and consult with a professional before making any investment decisions.
API & Data : Glassnode
Compiled and analyzed by HCCVenture
Join HCCVenture here: https://linktr.ee/holdcoincventure
Explore HCCVenture group
HCCVenture © 2023. All rights reserved.


Connect with us
Popular content
Contact to us
E-mail : sp_contact@hccventure.com
Register : https://linktr.ee/holdcoincventure
Disclaimer: The information on this website is for informational purposes only and should not be considered investment advice. We are not responsible for any risks or losses arising from investment decisions based on the content here.
TERMS AND CONDITIONS • CUSTOMER PROTECTION POLICY
ANALYTICAL AND NEWS CONTENT IS COMPILED AND PROVIDED BY EXPERTS IN THE FIELD OF DIGITAL FINANCE AND BLOCKCHAIN BELONGING TO HCCVENTURE ORGANIZATION, INCLUDING OWNERSHIP OF THE CONTENT.
RESPONSIBLE FOR MANAGING ALL CONTENT AND ANALYSIS: HCCVENTURE FOUNDER - TRUONG MINH HUY
Read warnings about scams and phishing emails — REPORT A PROBLEM WITH OUR SITE.