On-chain Analysis Week 29: Short-term Investors Aiming for Huge Profits?
Bitcoin has officially entered a price discovery phase after reaching ATH. Although early signals show that demand pressure is showing signs of fatigue, all investors, including short-term holders, are profitable.
7/21/20259 min read
Market Summary
Bitcoin has now rallied more than 370% from its recent bottom in November 2020 to a new high known as ATH, breaking all previous major accumulation zones, especially the $69,000 and $100,000 areas, which were considered technical and psychological resistance.
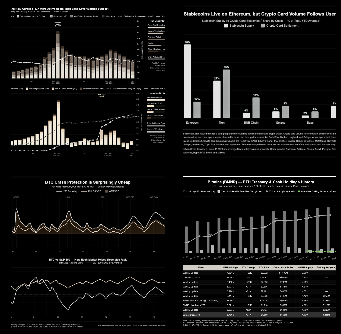
Across the system, the total unrealized profit (Unrealized Profit) is at an all-time high. This is demonstrated by the fact that Net Unrealized Profit/Loss (NUPL) is currently approaching the euphoria/greed zone (>0.75), which only occurs during peak cycles such as 2017 and 2021.
The unrealized profit ratio, such as signals from short-term investors, has increased beyond 30% in the previous two benchmark overshoots. The realized profit-to-loss ratio hit over 2.4x as Bitcoin hit a new ATH, indicating that the STH group has capitalized on significant profits.
The data suggests that the initial wave of profit-taking has not yet spread throughout the ecosystem. Compared to previous market tops (2017 and 2021), long-term tops only occur after at least two or three major distribution cycles, when outflows begin to persist for weeks.
On-chain metrics analysis
After reaching a new all-time high of over $123,000, Bitcoin is currently in a price discovery phase. In this situation, there is a clear shift from equilibrium to euphoria, where the majority of circulating supply is in high-profit zones.
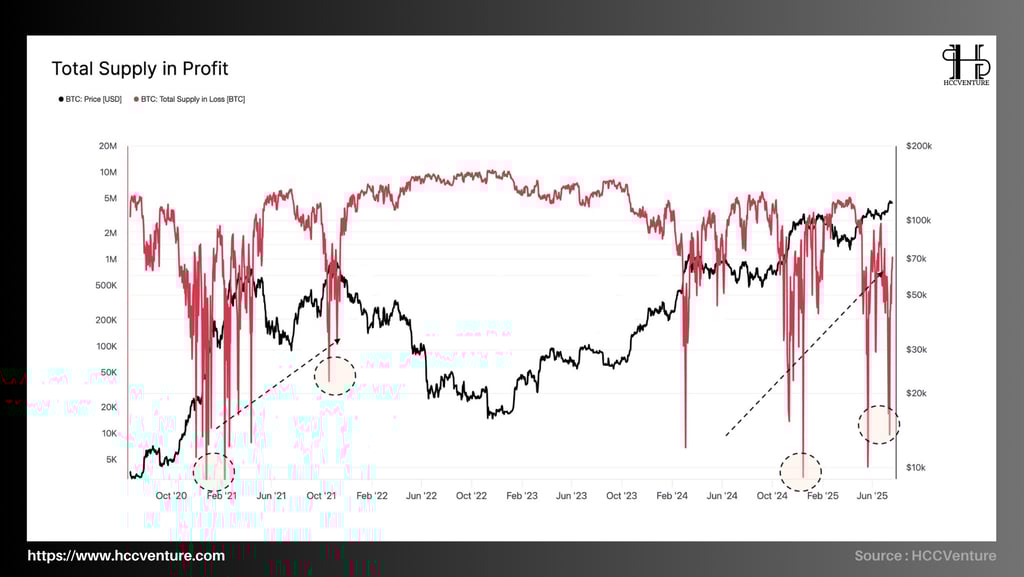
The number of Bitcoins losing money has bottomed out at around 10,000 BTC, the lowest level since February 2021 and has been close to zero on several sessions over the past week.
In contrast, during the peaks of previous bull cycles (Q4/2017 and Q1/2021), the entire network was in a profit state of over 99.95% of the total circulating supply.
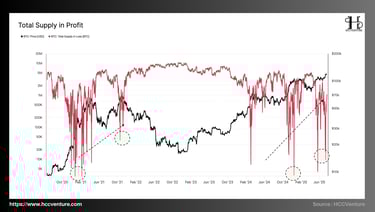
The key signs in a 370%+ Bitcoin bull run since 2022 were overshadowed by three points:
February 2021 , November 2021 , and July 2025 – all three coincide with the strongest bullish phases in the cycle.
Whenever the “Total Supply in Loss” index drops to <100,000 BTC, the market usually approaches or exceeds its peak , then a strong correction occurs within the next 1–2 months.
BTC price has broken out strongly while the "Supply in Loss" indicator is close to 0, showing that the market is too "euforic".
The supply ratio held by short-term investors (STH) is 95% of profits, one standard deviation above the historical average of 88%. This is the third time the indicator has crossed the warning threshold since May 2025. In previous cycles, the indicator has experienced small-scale technical or distribution changes.
However, a key warning is if this ratio falls back below 88% , it could signal weakening demand or distribution flows starting to overwhelm buying pressure.
The Bitcoin market is experiencing a “profit saturation,” where nearly all of the supply is in profit. While this state represents the strength of the uptrend, it is also highly risky as profit-taking pressure may occur. The historical precedent for major corrections is a “defective supply” that is close to zero, especially when accompanied by high short-term profit margins and distribution rates from newly launched wallets.
STH is holding the total supply of BTC, which indicates a profit-taking trend after the price peaked. In addition, the "STH Supply Ratio in Profit" Index is currently at 95%, one standard deviation above the long-term average (88%), indicating that the market is in an overheated valuation zone and there is a clear risk of a short-term correction.
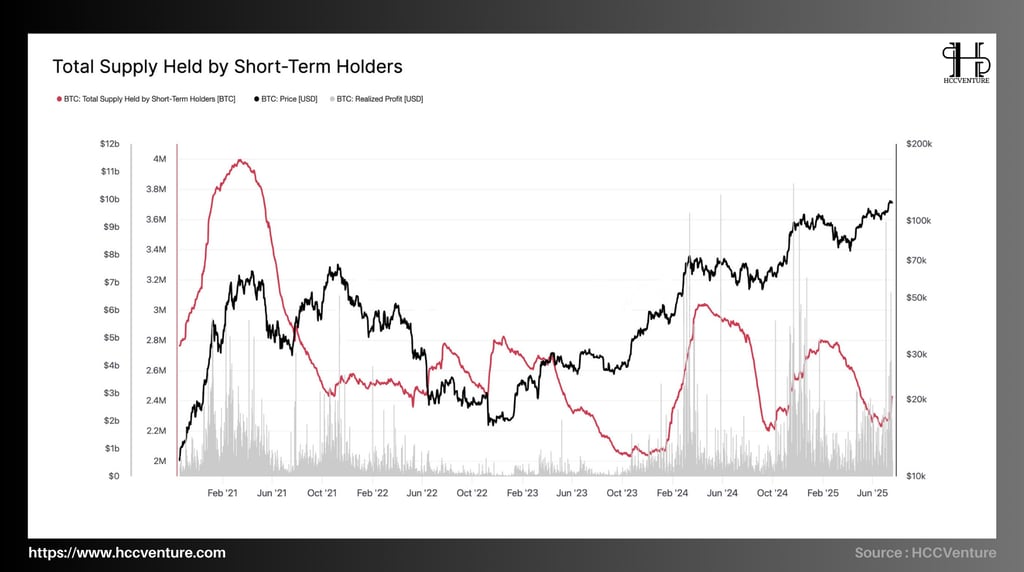
Currently, STH holds about 10.2% of BTC's circulating supply, with a total supply of only about 2.0 million BTC. This is considered the lowest level since early November 2023. This is significantly lower than its recent peak in February 2025, when it reached nearly 3.1 million BTC, accounting for 15.5% of the total supply.
It is worth noting that the sharp declines in STH supply accompanied the peaks in BTC price, indicating that short-term investors took strong profits during the surge.
Realized Profit spikes (gray) usually occur right after STH supply peaks and then starts to decline sharply as shown on the chart. Realized Profit has increased significantly since June. This shows that STH is taking large profits as the market breaks above $110,000–122,000.
The STH Supply Index peaked in January 2021, November 2021, and March 2024 before rapidly declining along with Bitcoin's price. The bearish structure of the index is due to the short-term investor group entering the distribution phase.
The warning suggests that a corrective cycle from $122K to the $105K–$110K range is entirely possible in the coming weeks if the STH ratio in profits starts to fall below 88% and STH supply continues to decrease.
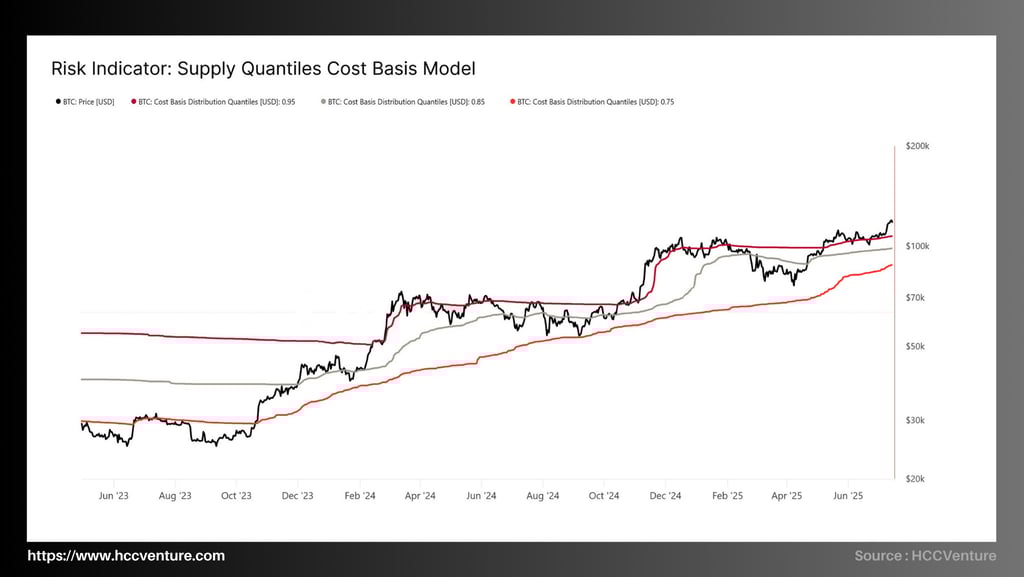
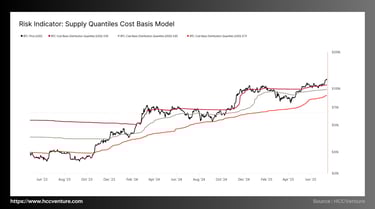
The chart shows three ranges of holding costs for investor groups:
0.75 Quantile – 75% of investors with a lower cost base (~$82,000)
0.85 Quantile – 85% of investors with lower cost basis (~$96,000)
0.95 Quantile – 95% of investors with lower cost basis (~$107,400)
→ The current price is above the 0.95 line , confirming that the majority of investors have entered the zone of significant profits.
In mid-June 2025, Bitcoin price crossed the $107,400 threshold (0.95 line) for the first time, marking the first time since November 2021 that the market price crossed the entire cost quantile spectrum. Due to the strong selling pressure from the large profit group, each time BTC crossed the 0.95 quantile (e.g. in April and October 2021), the market recorded a strong distribution phase.
This pattern shows that BTC is reestablishing a top structure with a new high cost basis. Investor valuations have increased significantly, making market behavior sensitive to price changes.
Most owners are holding significant profits when the trading price exceeds the 95th percentile. This leads to large profit-taking behavior. According to historical patterns, when this distribution does not meet strong enough buying power to absorb, the market will form a heavy structure, which is likely to lead to a "cascade sell-off" effect.
With 95% of supply having a cost basis below $107,400, the current price exceeds that level by nearly 13%, creating a significant yield gap. However, this also means that many investors will move from profitable to near-breakeven in the event of a market correction below $105K. Therefore, the risk of selling the property increases.
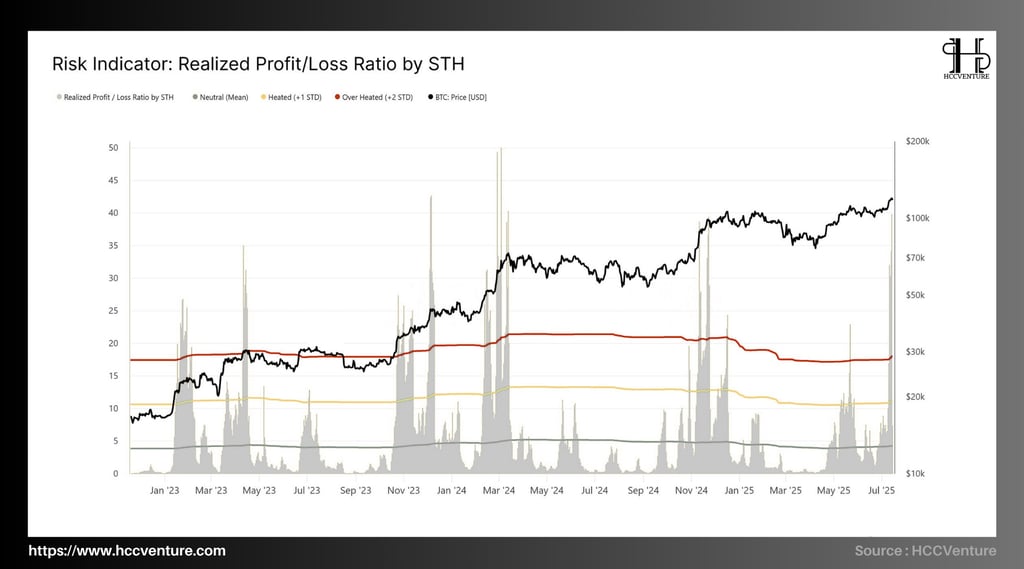
Realized profit/loss (STH) is determined by the actual profit/loss ratio of the group of investors who held Bitcoin for less than 155 days. Overheated condition occurs when the index exceeds +2 standard deviations (STD) from the long-term average.
Data updated on 20/7/2025 shows that the index has peaked at 15.4, above the +1 STD threshold (hot zone), and is approaching the overheated threshold at ~17–18, indicating that profit-taking activities are increasing strongly.
However, the index has contracted to 13.6 in recent sessions, indicating that the market is in the process of a slight correction after the first profit realization after the ATH collapse.
The index surged above +2 STD on its previous two peaks in April and November 2021. It then gradually declined as selling pressure intensified and prices failed to sustain the trend. In particular, when the index began to decline or decline while prices continued to rise—this is often a sign of weakening demand and signals a medium-term top.
The first profit was realized in mid-July 2025, but it was not at the historical peak. The index's decline from 15.4 to 13.6 does not negate the risk, indicating that the market is in the process of gradual distribution and has not yet fully topped out. This shows that the market is still bullish, but with increasing caution from the demand side.
If prices continue to rise but the index fails to break above the 15–17 peak as in previous cycles, this is a sign of “weakening demand”, indicating that buyers are no longer willing to absorb at the new price zone. Conversely, the market may enter a clear quantitative top phase if the index suddenly surges above 20.
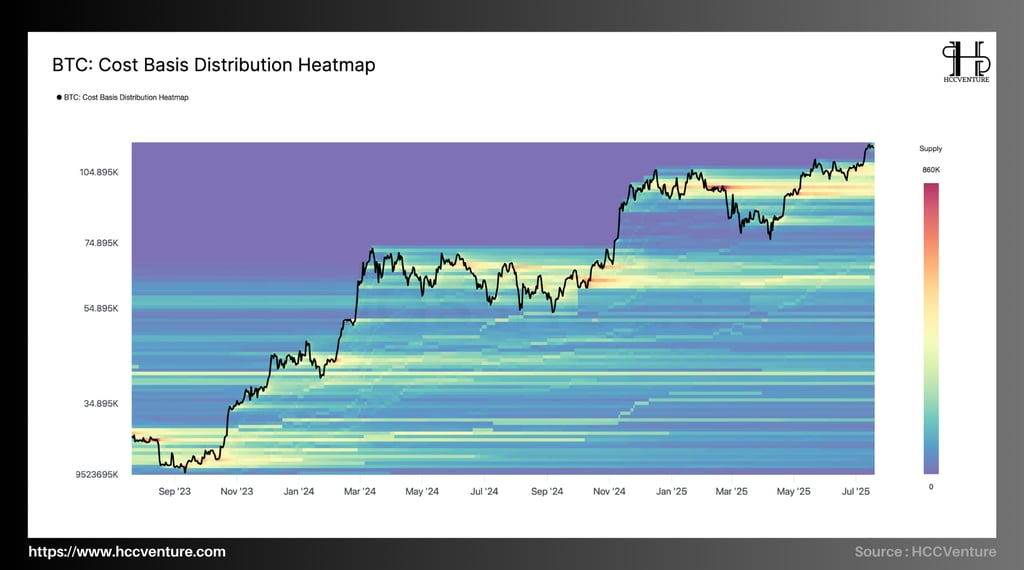

Since mid-June 2025, Bitcoin has broken out of a long-term accumulation phase from $100,000 to $110,000 and reached a new all-time high. A significant support base was previously established by a long-term accumulation phase in the neutral price zone. The supply distribution density at key price zones also confirms this.
The $93,000 to $97,000 area is the first accumulation area after a correction in early 2025.
$104,000 to $110,000 Area: The main accumulation phase lasts more than six weeks, starting from May to June 2025.
The fact that BTC price broke above all this dense accumulation is clearly evidence of a change in market structure, moving from the accumulation phase to real price discovery.
Prior to the successful breakout, previous rallies have all formed high-density consolidation bases. With a high success rate of breakouts through dense supply clusters, also known as cluster zones, the last one occurred in February 2022 at around $54k–$58k, which led to a strong rally to $74k afterwards.
BTC is in a real price discovery phase. The accumulation structure below is a strong technical buffer. If the correction meets significant buying pressure, a return to $104k-$110k is possible. According to many on-chain models, the next resistance zone is between $130k-$136k.
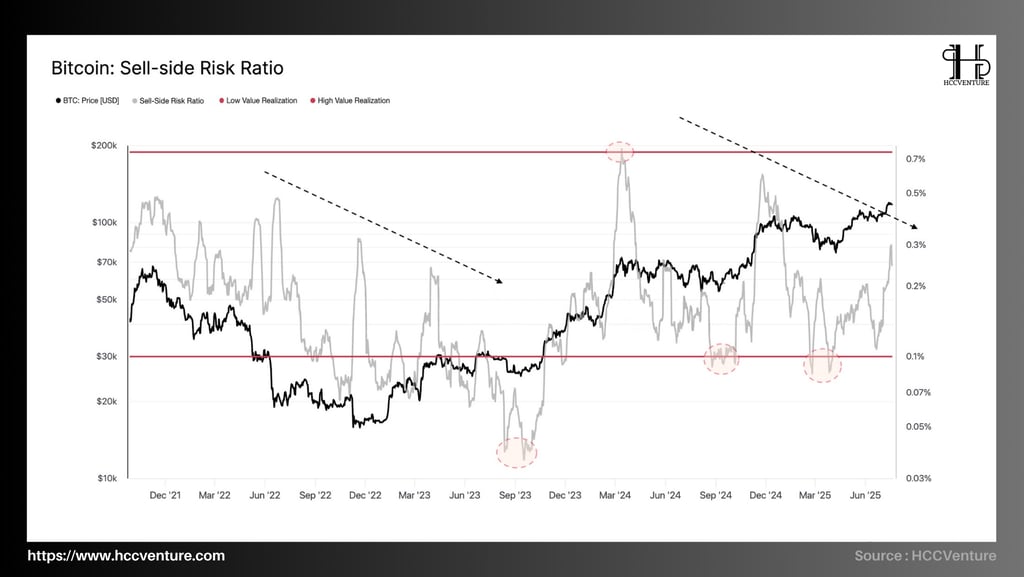
Sell-side Risk Ratio measures the risk from profit-taking behavior:
High index (>0.6) : The market is in an overheated speculative state, money flow is shifting from holding to realization.
Low index (<0.15) : Selling pressure is very low, accumulation psychology prevails.
Profit-taking has increased but not to the point where it threatens the uptrend, although the index remains below its all-time high. The short risk ratio is now at 0.33, up sharply from 0.12 in March 2002. The index last peaked at 0.65 in March 2022, coinciding with the local price peak as BTC approached $100,000.
The sell-side risk ratio is gradually decreasing over time (downward trend from 2021 to 2025), indicating that the market is shifting to an accumulation cycle and a speculative cycle. More organized distribution and increasing long-term capital flows limit sudden short-term profit-taking.
Bottoms formed between 0.10 and 0.15 have consistently coincided with sustainable price accumulation zones (September 2023 and March 2025), proving that the indicator is an effective reversal indicator. Currently, the Sell-Side Risk Index is in the neutral-benign range (0.3–0.35), suggesting a sustainable growth cycle that is not overheated.
Evaluation and Conclusion
Bitcoin is currently trading near $122,600, marking a new all-time high. As shown on the Cost Basis Distribution Heatmap, the price has broken through two high-intensity accumulation zones: $93,000–$97,000 and $104,000–$110,000. Breaking through these cost distribution clusters suggests that the supply structure is shifting to a localized scarcity; this suggests that a steady medium-term uptrend is in place.
In terms of profit/loss ratio, STH crossed the 2 standard deviation (STD) threshold from the long-term average in late June 2025, peaking near 46, but has since corrected slightly to the ~31 area. This is a sign that profit-taking from short-term investors (STH) has started to become stronger, a common behavior when the market enters the euphoric zone.
STH's unrealized profit is now at 13.6% , down slightly from its recent peak of 15.4% (equivalent to +1 STD). This development suggests that selling pressure is gradually being absorbed, but the profit is still large enough to stimulate distribution behavior in the next price increases.
The current price is hovering just above the +1 STD line of the Cost Basis model for STH. In the current cycle, the previous two touches of this zone have coincided with new BTC highs (December 2024 and July 2025). The next resistance level is located at the +2 STD zone ~ $130,000 , which is a possible upside target in case of continued short-term speculative inflows.
With its stable supply structure, Bitcoin's price is rising and speculative money has not been withdrawn strongly. Short-term indicators show that the first wave of profit realization has appeared, but the magnitude is not large enough to create a market top. Therefore, there is still room for growth, and our next target is around $130,000.
Disclaimer: The information presented in this article is the author's personal opinion on the cryptocurrency field. It is not intended to be financial or investment advice. Any investment decision should be based on careful consideration of your personal portfolio and risk tolerance. The views expressed in the article do not represent the official position of the platform. We recommend that readers conduct their own research and consult with a professional before making any investment decisions.
API & Data : Glassnode
Compiled and analyzed by HCCVenture
Join HCCVenture here: https://linktr.ee/holdcoincventure
See other on-chain analysis
Explore HCCVenture group
HCCVenture © 2023. All rights reserved.


Connect with us
Popular content
Contact to us
E-mail : sp_contact@hccventure.com
Register : https://linktr.ee/holdcoincventure
Disclaimer: The information on this website is for informational purposes only and should not be considered investment advice. We are not responsible for any risks or losses arising from investment decisions based on the content here.
TERMS AND CONDITIONS • CUSTOMER PROTECTION POLICY
ANALYTICAL AND NEWS CONTENT IS COMPILED AND PROVIDED BY EXPERTS IN THE FIELD OF DIGITAL FINANCE AND BLOCKCHAIN BELONGING TO HCCVENTURE ORGANIZATION, INCLUDING OWNERSHIP OF THE CONTENT.
RESPONSIBLE FOR MANAGING ALL CONTENT AND ANALYSIS: HCCVENTURE FOUNDER - TRUONG MINH HUY
Read warnings about scams and phishing emails — REPORT A PROBLEM WITH OUR SITE.