


On-chain analysis week 28/2025: Strong cash flow, Bitcoin sets new ATH
As the Bitcoin market continues to fluctuate around the $105,000–$110,000 price range, on-chain data shows a strong tightening in the supply structure, while implied volatility is increasing simultaneously in both spot and derivatives markets.
7/14/20259 min read

Market Overview
Long-term investors are holding more than 72% of the circulating supply, reaching an all-time high of 15.8 million BTC.
Retail groups like Shrimps (<1 BTC), Crabs (1–10 BTC), and Fish (10–100 BTC) buy around 19,300 BTC per month.
The amount of newly mined BTC per month is less than 13,400 BTC as the block reward is only 3,125 BTC after the halving in April 2024. Since 2024, the price standard deviation in the range of 7D–30D is decreasing.
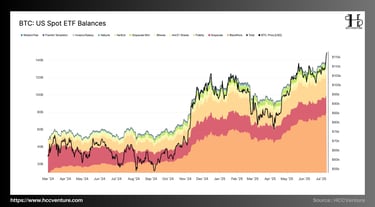
On July 10, 2025, the total assets under management (AUM) of BTC spot ETFs in the United States reached an all-time high of approximately $137 billion. BlackRock IBIT currently accounts for 55% of the AUM, approximately $75.35 billion. Grayscale and Fidelity account for 14.7% and 16.2%, respectively.
The market is on the cusp of a new price expansion cycle, as evidenced by the consensus between on-chain and volatility-capturing derivatives. A demand break would have a significant impact on price in cases where there is no selling pressure and the supply structure remains stable.
On-chain metrics analysis
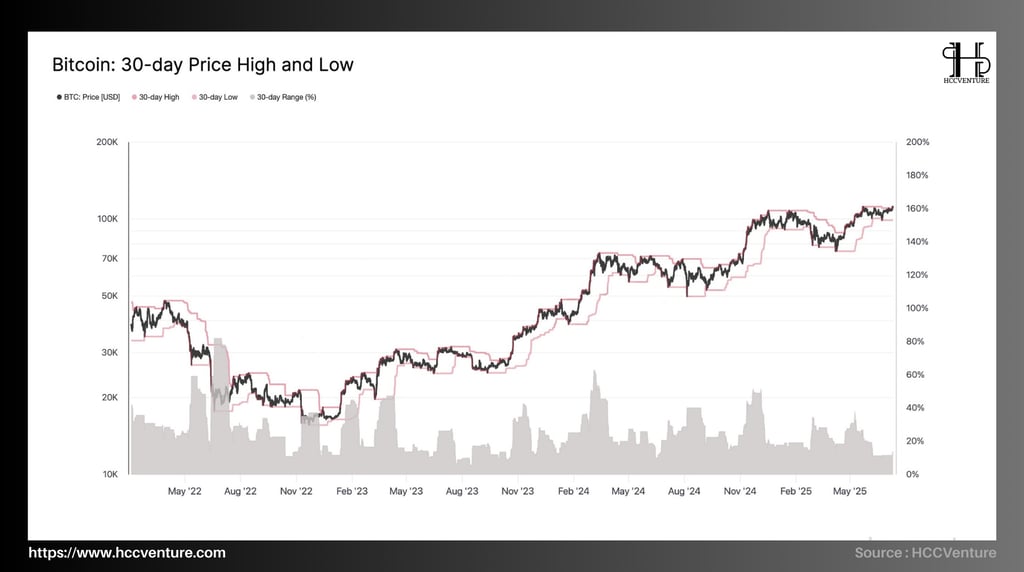
The “Highest to Lowest Price Range over the Last 30 Days” indicator, calculated as a percentage of the highest and lowest prices over that period, shows that only 6% of historical trading days have had smaller swings than today. This is a clear signal that the market is being restrained to reduce volatility.
Although this has also passed, on July 13, 2025, statistics show that Bitcoin's current 30-day price fluctuation has only changed a small 4.1%, however the fluctuation range has had a large divergence from $108 to $112.
The 30-day range (light red line) has been significantly reduced since June 2025 (light red line in the chart). In a flat accumulation zone, the price is moving sideways before a strong market bounce. In line with other signals such as:
Realized Volatility is hitting an 18-month low.
Funding rate is neutral , indicating that there is no excessive leverage in the derivatives market.
Number of on-chain transactions
The action count and spot liquidity volume also decreased temporarily – reflecting the wait-and-see state of the whole market.
This suggests that the market is waiting. In all previous cycles (2017, 2020, and 2021), there have been very significant moves of over 20% in the two to four weeks following a 30-day drop below 5%.
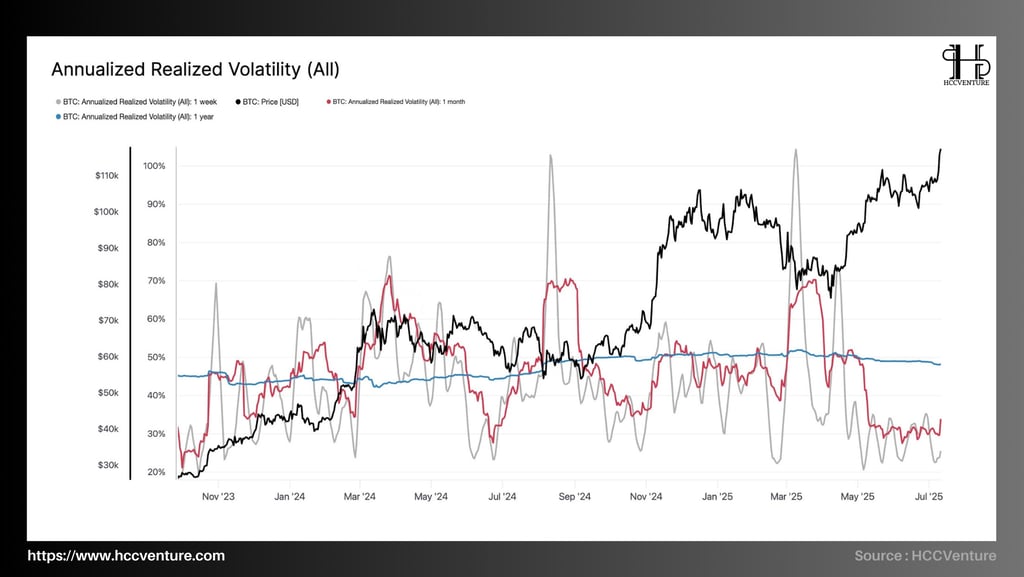
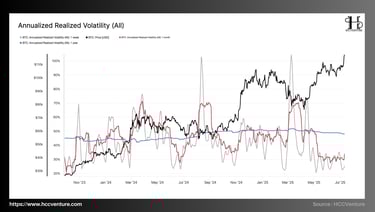
In a given week, month, or year, the Annual Realized Volatility (ARV) measures Bitcoin's real-world volatility —using the mean squared deviation method, then the data is annualized.
The data chart shows the following figures:
Weekly ARV is currently at just 25%, above 84. The likelihood of a reversal to the upside is very low when forced. When compared to ARV measurements taken from any of the past 951 trading days , there are currently only over 155 single-day declines that we can track this information on a weekly basis.
The monthly ARV fluctuated in the range of 28-30%. When we looked at the individual days later and checked our conclusions with the profit and loss figures each morning from April 1 to September 18, it was clear : 89% of the trading days had this type of result.
History should bear this out: 3-month ARV has also been at its lowest level of 4% in historical examples. This means that the market rarely stays this calm.
12-month ARV remains stable at 46-48%, meaning the long-term structure of the market remains unaffected by short-term noise and speculation.
The synchronization of all timeframes moving into the compression zone is a system signal that shows that the market lacks general volatility.
Bitcoin’s past suggests that, often, strong—that is, simultaneous—volatility marks the beginning of major boom periods. This is because the market’s energy is depleted. As long as nothing too alarming happens, anyone who has successfully weathered one or more of these stressful booms can expect their fortunes to change—like someone sitting on a jackpot without even knowing it.
Q4 2023: Two days in October, ARV bottoms at 30%, then Bitcoin rallies 60%—from $30,000 to $48,000—in just six weeks.
One-week ARV dropped below ~26% in September 2015; in late 2017 and early 2018 (January), it increased again.
Currently (February 13, 2006), the technical price structure (based on 30-day high-low price series data) is consolidating into horizontal plateaus. It has the support of fundamental factors from the development of ETF capital flows, which still exists. However, depending on the supply and demand factors, the long-term dynamics for external influences are extremely important.
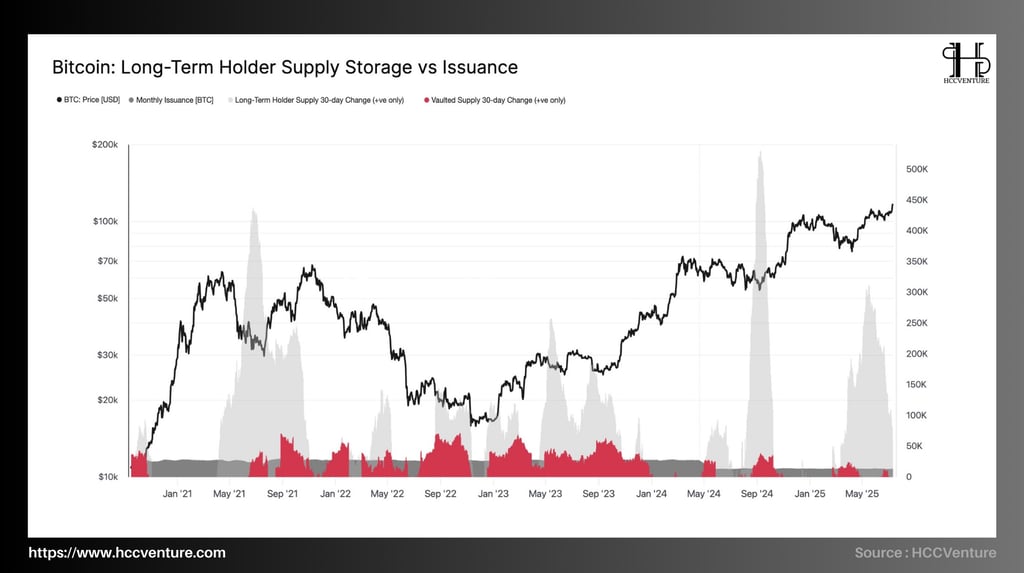
During accumulation and also during price corrections, the chart shows that the largest accumulation areas (gray) appear. Even when short-term price changes occur, it shows that confidence in trading does not decrease.
Currently, from the BTC outflow pie chart, almost no new BTC minted this month went into LTH ; even if miners sold some coins.
In April 2022, with the halving event, the current monthly BTC issuance volume is around 13,400 units . In contrast, LTH (long-term holders) are accumulating an average of around 19,300 BTC per month, exceeding the issuance rate by around 44%.
This means there is virtually no supply pressure to speak of. All the newly mined BTC is just absorbed and further shortened.
It is quite clear that the BTC supply being drawn into the " locked " state (sealed - red) continues to increase, and squeezes right at the sleepy stage (price). This clearly reveals that:
Short term price changes do not affect LTH.
The “lockdown” behavior is a stable investment strategy that allows for unlocking for distribution only when a significant new value is realized in the market.
Therefore, long-term investors, less inclined to accept short-term risks, are currently holding the market, providing psychological support and stable liquidity.
As LTH continues to accumulate and accumulate, Bitcoin's supply structure is clearly tightening. Coupled with internal accumulation buying and liquidity exhaustion from the rest of the market, there is no selling pressure coming from new supply. This is strong evidence that the market is accumulating a wave of strength for mid-term growth.
Currently, due to a relatively stable supply structure and most investors thinking long-term, the Bitcoin market is in a buoyant phase of the market cycle with no signs of failure in sight.
Currently, long-term investors holding Bitcoin have absolutely no incentive to sell. Barring a valuation shock or unusual market sentiment, it is hard to imagine them participating in a large distribution.
The specific reasons are:
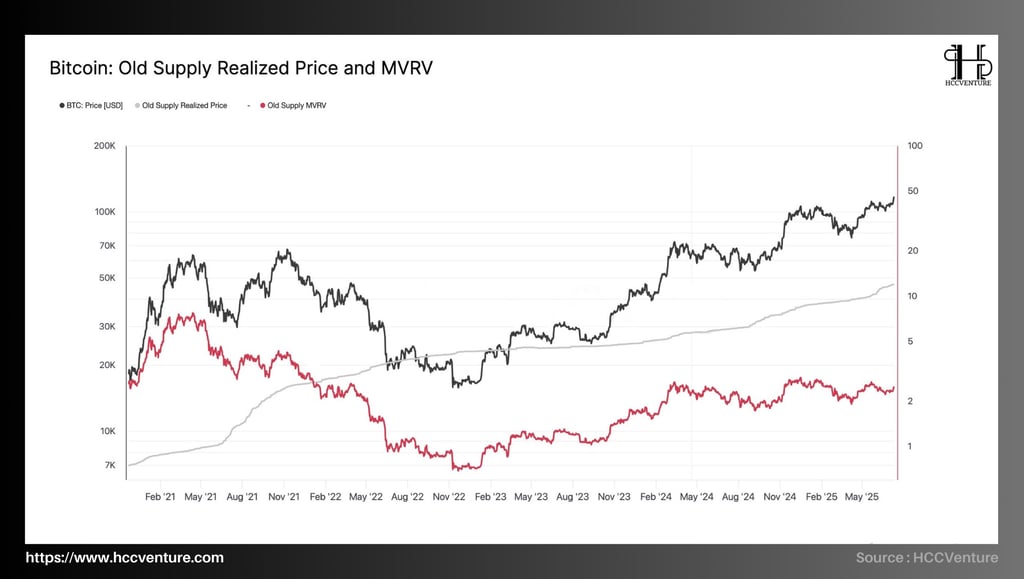
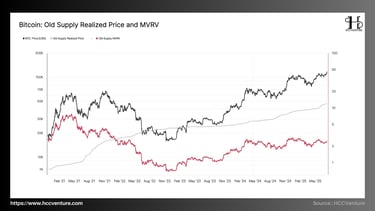
The price of the donated old product is about $14,500 from there or just a little bit more.
Bitcoin's market trading price of $106,000-$108,000 has increased at least 7.4 times.
The old supply MVRV is at 7.2 - 7.5, almost as crazy as recent market cycle peaks but not above historical distribution levels, which are 8.5 - 9.0.
In other words, long-term players are currently sitting on large unrealized profits, but there is no major selling pressure or outright “letting go.” Long-term investors are not selling their Bitcoin, but while the steady hand continues to hold it, the implication is a prolonged cycle of rising prices.
Historical MVRV is at a very high level - but not inflated. This represents large profits without significant selling pressure. HODLing enthusiasm is still playing a leading role in price. Long-term investors continue to hoard Bitcoin because there are currently large profits in their pockets, but not yet cashed out. This shows that the fundamentals of the market are currently very strong, supporting a continued uptrend.
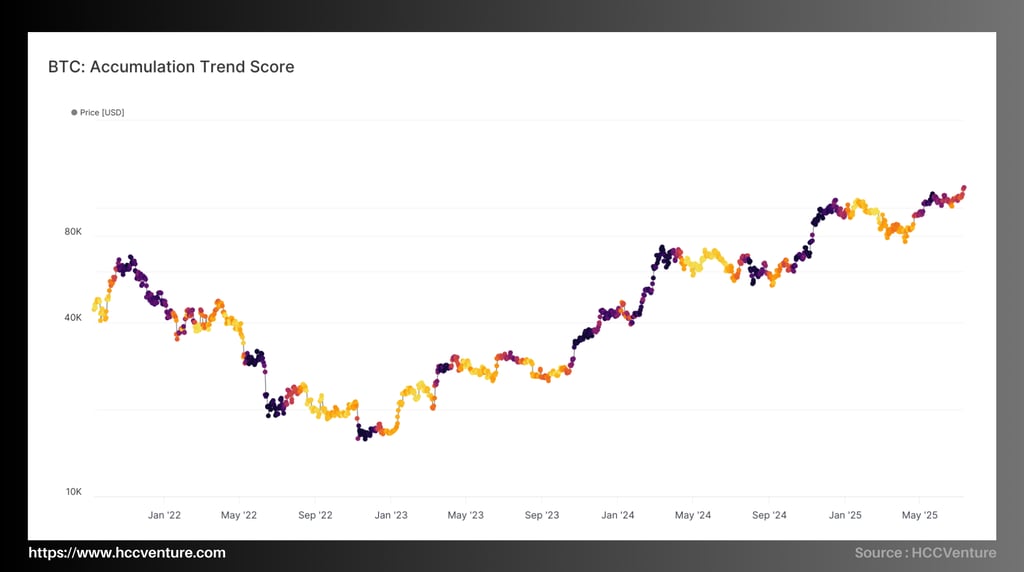

The Accumulation Trend Score is used to evaluate Bitcoin accumulation behavior across the network. It is based on the net volume purchased and distributed to each group of wallets according to their size and holding period.
This includes any positive cash flow, and also calculates for each wallet group by size and holding period how much money they have on hand at any given time.
The Bullish Direction Index has been in the range of 0.65 - 0.85 for the past two months, indicating a moderate to strong accumulation mode. The chart color, a mix of light purple and dark orange, suggests strong accumulation behavior even at high prices.
When prices peak, profit-taking pressure sets in and accumulation behavior often takes a nosedive — as seen in last year’s bull market. However, investors, especially large wallets like whales and institutions, are not affected by short-term volatility. They are now even more patient in the market.
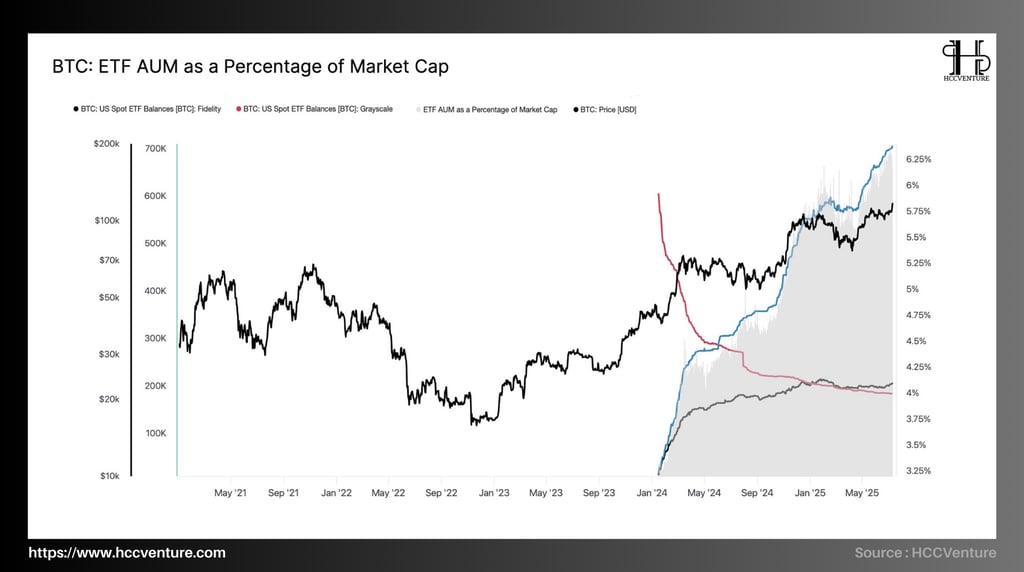
ETFs hold nearly 1/16 of all BTC in circulation, showing that the ETF AUM/Market Cap ratio has increased to 6.2% since the beginning of July.
While Grayscale has reduced its holdings to under 400,000 BTC, Fidelity now holds over 650,000 BTC , far exceeding its competitors. This shows a shift from closed-end funds to more transparent and liquid spot ETFs.
It is worth noting that the ETF AUM ratio continues to increase even as BTC price has reached a high of above $105,000. This shows that institutional demand is not decreasing but is accumulating.
The increase in ETF holdings reflects the representation of conservative and long-term money. Institutional money has a longer average holding period and is less affected by short-term volatility than retail money.
Despite this short-term decline, the overall trend remains solid. When viewed over multiple months, buying pressure remains consistent and significant, highlighting the continued rise of institutions.
Total assets under management (AUM) across all U.S.-based Bitcoin spot ETFs have surged to a new record high of $137 billion in recent days despite declining net inflows. The milestone shows the difficulty and resilience of institutional custodian demand for access to Bitcoin.
Indeed, in terms of AUM, the combined size of the ETF portfolio puts it among the top 10 largest ETF portfolios globally, further highlighting Bitcoin’s position among prominent global investment instruments

In recent days, net ETF inflows have eased slightly, with sessions recording inflows ranging from +$100 million to -$200 million per day.
However, total assets under management (AUM) of the spot ETF system reached an all-time high of $137 billion as of March 2025, up more than 45% from the previous year. Consider the issuer's capital structure:
BlackRock maintains its leading position with continuous capital attraction sessions.
Fidelity and Ark/21Shares' positive capital inflows are a result of a consensus growth trend among major ETF providers.
Grayscale still recorded some outflows, but the magnitude has decreased significantly compared to the beginning of the year, suggesting that the pullback is largely over.
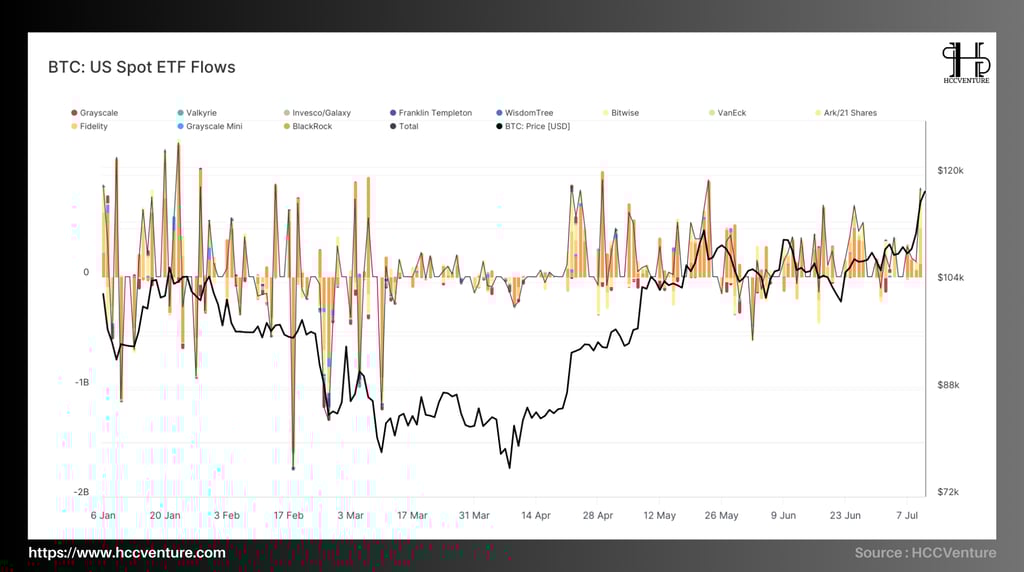

After a long accumulation cycle and strong price momentum, ETF inflows have slowed down in recent sessions. But the important thing is:
Major funds show no signs of major outflows.
AUM levels remain at all-time highs.
Bitcoin price is still rising despite the neutrality of capital flows. This shows that the market is relying on long-term structural factors rather than short-term money.
As of now, the constellation of Bitcoin spot ETFs in the United States has risen to become one of the top 10 ETF portfolios in the world by AUM value, on par with conventional sectors such as QQQ (Nasdaq 100), SPY (S&P500) and TLT.
Evaluation and Conclusion
Long-term investors (LTHs) are still increasing their Bitcoin holdings, according to the latest data from on-chain analytics, suggesting that the Bitcoin market is entering a structured accumulation phase. The total supply controlled by LTHs has reached a new all-time high. This reinforces the idea of a long-term investment trend that is not affected by short-term fluctuations.
Small investor groups, such as Shrimps (<1 BTC), Crabs (1–10 BTC), and Fish (10–100 BTC), are accumulating a total of over 19,300 BTC per month, far exceeding the net monthly issuance of the entire network after the halving event. An example of a supply squeeze, also known as a supply squeeze, is the shrinking supply of Bitcoin over time.
When it comes to volatility, data from the volatility chart shows that the actual volatility timeframes—also known as realized volatility—are narrowing across the board. This expansion is often a sign that the market is building up energy to move into a volatile state.
The total assets under management (AUM) of the entire US spot Bitcoin ecosystem has hit a record $137 billion, up sharply from the first quarter of the year, although ETF inflows have shown signs of a slight decline in the short term.
The main tool to promote institutional capital into the market, BlackRock's IBIT accounts for more than 55% of the market share. Grayscale and Fidelity account for 16.2% and 14.7% of total AUM, respectively, occupying an important position in the investment environment.
Currently, the Bitcoin market is entering its final accumulation phase before the price starts to change. The market structure is sustained by long-term confidence and steady institutional money flows. All mainstream on-chain indicators agree on one thing: the rise is continuing based on high-quality investment demand and supply squeeze.
Disclaimer: The information presented in this article is the author's personal opinion on the cryptocurrency field. It is not intended to be financial or investment advice. Any investment decision should be based on careful consideration of your personal portfolio and risk tolerance. The views expressed in the article do not represent the official position of the platform. We recommend that readers conduct their own research and consult with a professional before making any investment decisions.
API & Data : Glassnode
Compiled and analyzed by HCCVenture
Join HCCVenture here: https://linktr.ee/holdcoincventure
See other on-chain analysis articles :
Explore HCCVenture group
HCCVenture © 2023. All rights reserved.


Connect with us
Popular content
Contact to us
E-mail : sp_contact@hccventure.com
Register : https://linktr.ee/holdcoincventure
Disclaimer: The information on this website is for informational purposes only and should not be considered investment advice. We are not responsible for any risks or losses arising from investment decisions based on the content here.
TERMS AND CONDITIONS • CUSTOMER PROTECTION POLICY
ANALYTICAL AND NEWS CONTENT IS COMPILED AND PROVIDED BY EXPERTS IN THE FIELD OF DIGITAL FINANCE AND BLOCKCHAIN BELONGING TO HCCVENTURE ORGANIZATION, INCLUDING OWNERSHIP OF THE CONTENT.
RESPONSIBLE FOR MANAGING ALL CONTENT AND ANALYSIS: HCCVENTURE FOUNDER - TRUONG MINH HUY
Read warnings about scams and phishing emails — REPORT A PROBLEM WITH OUR SITE.