


On-chain analysis week 27/2026: Signs of reversal from Long-Term Holders
After a volatile week, Bitcoin investor sentiment remains dominated by outflows from US spot Bitcoin ETFs, increased hedging demand in the options market, and interest rate anxieties.
PHÂN TÍCH
7/4/202611 min read
On-chain analysis week 27/2026: Signs of reversal from Long-Term Holders
After a volatile week, Bitcoin investor sentiment remains dominated by outflows from US spot Bitcoin ETFs, increased hedging demand in the options market, and interest rate anxieties.
Analysis • 4 July, 2026


Market Summary
One of the most positive signals of the past week came from the behavior of Long-Term Holders. After a prolonged profit-taking phase in the first half of the bull cycle, current data shows that the amount of Bitcoin held by this group is increasing again. This reflects current support from experienced investors who are taking advantage of discounted prices to re-accumulate rather than continue distributing.
The supply absorption process is not only occurring among long-term holders but is also spreading to various wallet groups. Notably, the supply distribution data shows that Bitcoin is being accumulated simultaneously across multiple asset sizes, reflecting an improvement in market confidence amidst sharp price corrections and often occurring during bottoming phases of previous cycles, when selling pressure is gradually absorbed by long-term capital flows.
Contrary to market sentiment, US spot Bitcoin ETFs continue to record a prolonged net outflow, reflecting a reduction in the proportion of risky assets in the portfolios of many large institutions compared to Q1 2026. ETF trading volume has also decreased significantly, indicating that new capital has not yet returned to the market. On the other hand, data from Coinbase's order book shows a notable shift in liquidity structure. The volume of buy orders (bids) has increased significantly and is now dominant over sell orders, reflecting institutions actively providing liquidity and building support zones instead of pushing prices up with market buy orders.
The macroeconomic environment continues to put pressure on digital asset markets, following the Federal Reserve's June meeting which concluded with a fourth consecutive decision to keep interest rates unchanged. However, the more important factor lies in the policy message, as Fed Chairman Kevin Warsh continues to maintain a hawkish stance on inflation. The market has now largely abandoned expectations of a Fed interest rate cut in 2026, shifting expectations to 2027.
Analyzing on-chain metrics
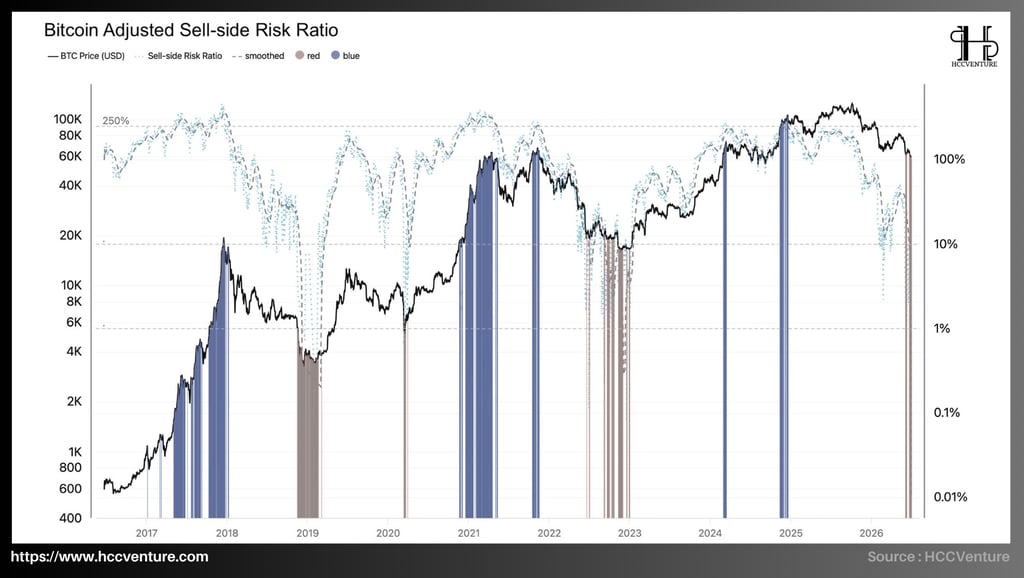
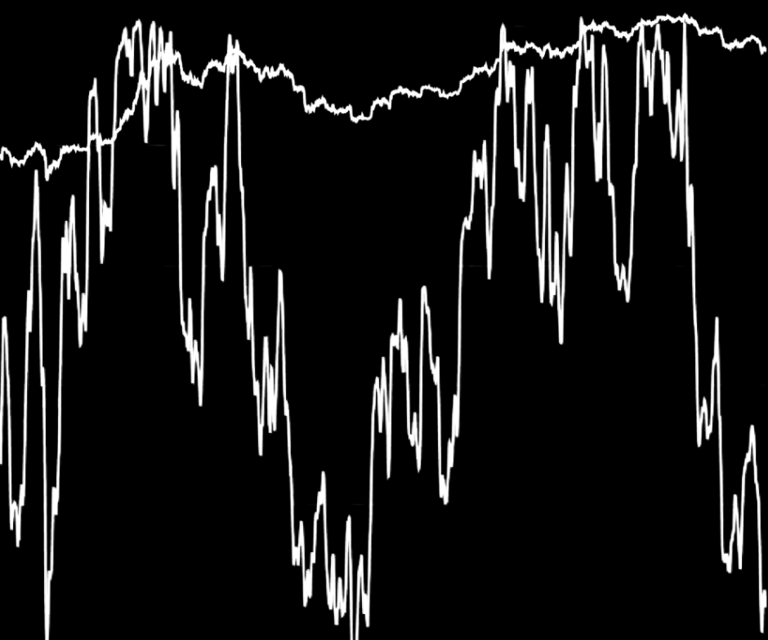
The market entered a rebalancing phase after a distribution cycle. Selling pressure from institutional capital, withdrawals from Bitcoin Spot ETFs, and a high-interest rate environment kept market sentiment cautious. However, our assessment of the Adjusted Sell-side Risk Ratio (ASSR) reflects a more positive structural picture. After a deep correction from the peak above $100,000 to below $60,000, the amount of Bitcoin capable of generating short-term profits has decreased sharply, while the group of investors who suffered losses have gradually completed their selling. As a result, supply turnover on the chain has decreased to a low level, reflecting a gradually forming supply-demand equilibrium.
Comparison with previous cycles shows that each instance of ASSR remaining in a prolonged low range occurs after the market has largely completed its revaluation process. The 2015 period marked the bottom after a more than 80% decline, followed by 2019 after Bitcoin fell from nearly $20,000 to around $3,200, and the late 2022 period after the FTX crash when Bitcoin was trading around $15,500-$16,000.
In all three cycles, the market entered a prolonged consolidation phase before forming a new uptrend.
A key feature of the Adjusted Sell-side Risk Ratio is its ability to reflect the behavior of long-term holders. When the index falls to low levels, it indicates a significant decrease in the amount of long-term Bitcoin being brought into the market. The long-term investor perspective is significantly reducing the natural supply pressure on the market, allowing new capital to absorb circulating Bitcoin at a lower cost. Although investment demand has not yet recovered strongly due to the macroeconomic environment, the decrease in selling pressure from long-term holders is an important signal that the market structure is gradually stabilizing.
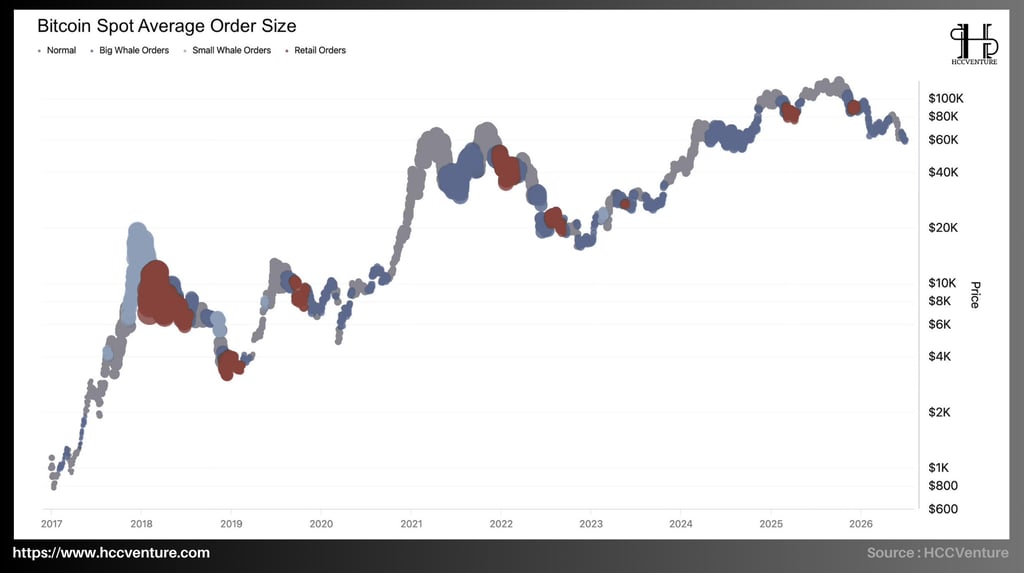
While institutional capital flows through Bitcoin Spot ETFs continue to weaken and market sentiment is influenced by the Federal Reserve's tightening monetary policy, on-chain data on Bitcoin Spot Average Order Size shows a more positive signal at the micro level, with the average transaction size in the market increasing primarily due to the participation of large-value orders.
Sustained bottoming phases are often accompanied by an increase in the proportion of large-scale trades as long-term investors actively absorb supply from short-term investors. Conversely, euphoric phases at the end of a cycle often see a sharp increase in small retail orders, reflecting FOMO (fear of missing out) sentiment and asset distribution.
Observations on the chart show that after Bitcoin fell below $60,000, the number of large-scale transactions remained stable, while trading by retail investors did not increase correspondingly. This indicates a supply absorption process primarily driven by institutions and large-scale investor groups, rather than short-term speculative capital. A notable feature of the current period is that although spot trading volume is no longer as high as at the beginning of the year, the average value of each transaction remains stable thanks to large-scale orders.
Throughout the entire bull cycle from late 2023 to early 2025, Retail Orders activity only surged when Bitcoin approached its historical peak. Following the recent correction, the trading volume of this group has decreased significantly and has not shown a clear recovery. Instead of large-scale sell-offs like those seen in the early stages of a bear market, current data shows that high-value transactions are primarily driven by supply balancing, Long-Term Holders are returning to accumulation, the amount of Bitcoin held for over 155 days continues to increase, and the available supply in the spot market is gradually decreasing.
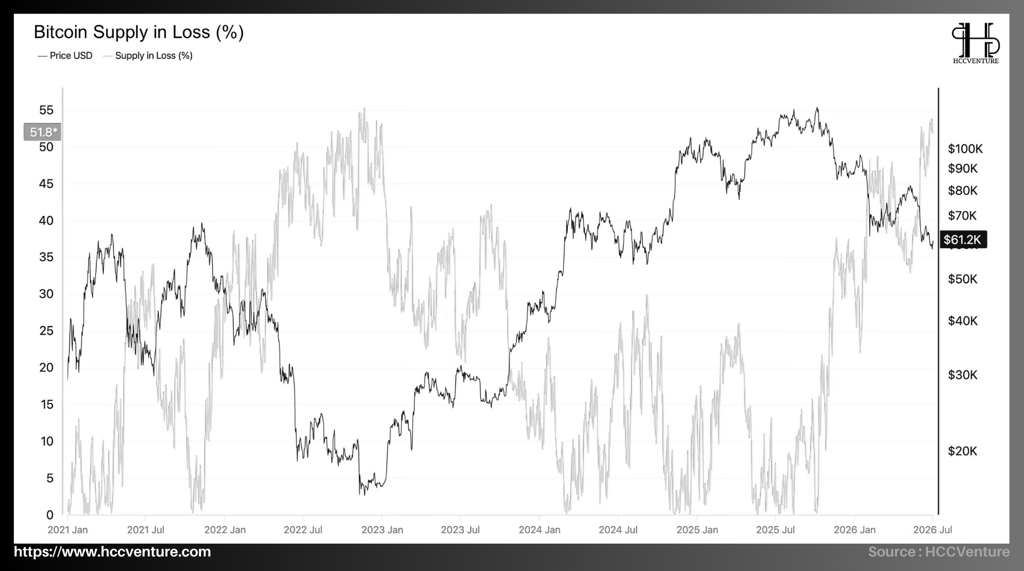

With increasing selling pressure and supply shifting toward long-term holders, Bitcoin has entered a significant revaluation phase as the percentage of supply in loss ( Bitcoin Supply in Loss (%) ) has risen to its highest level since late 2022. The rapid increase in the amount of Bitcoin held below cost reflects a cautious sentiment spreading across the market, particularly among investors who participated in the late stages of the uptrend.
Current data shows that Bitcoin Supply in Loss has increased to approximately 51.8% , meaning that more than half of the total circulating Bitcoin is currently held in unrealized loss positions. This is the highest level since the market recovered from the 2022 downturn and marks a sharp reversal from the early 2025 period, when this indicator only fluctuated around 2-8%. The rapid increase in Supply in Loss mainly stems from Bitcoin's more than 40% correction from its historical peak. A large proportion of investors who participated in the final months of the bull cycle were pushed into loss positions, increasing psychological pressure across the market.
In other words, the majority of current losses are concentrated among new investors rather than long-term holders, indicating that asset redistribution is underway, shifting Bitcoin to entities capable of long-term holding. Simultaneously, the increase in losses while the realization of those losses hasn't exploded suggests that most investors are choosing to hold rather than sell at any cost. This is a crucial factor in limiting the risk of chain sell-offs.
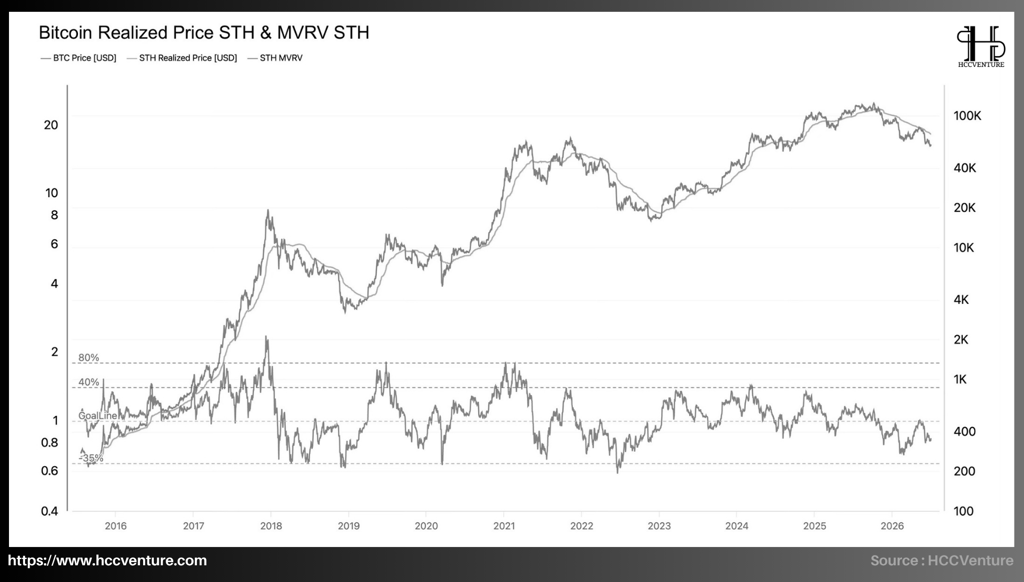
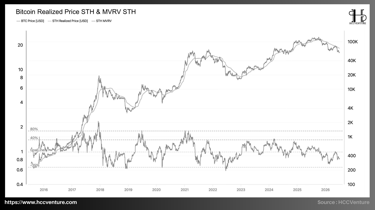
Unlike long-term investors, STH is entering a discounted valuation zone, with most of the selling pressure in the Bitcoin market concentrated among short-term holders. When STH MVRV falls below 1.0 , most short-term investors are holding the asset below cost. Historically, this situation often occurs during sharp corrections or at the end of a downtrend, when selling pressure from speculators is gradually absorbed by long-term investors.
Current data shows that STH MVRV is fluctuating around 0.80-0.85 , significantly lower than the equilibrium level of 1.0, meaning that short-term investors are recording an average unrealized loss of approximately 15-20% compared to the cost basis. This is the lowest level since the end of 2022 and marks a clear reversal from the beginning of 2025, when STH MVRV fluctuated around 1.15-1.25 , reflecting double-digit unrealized profits.
The fact that prices remain below the STH Realized Price reflects that the majority of new transactions in recent months are in a loss-making state. This is significantly reducing the incentive for short-term investors to take profits, while simultaneously encouraging the transfer of supply to entities capable of holding for the longer term.
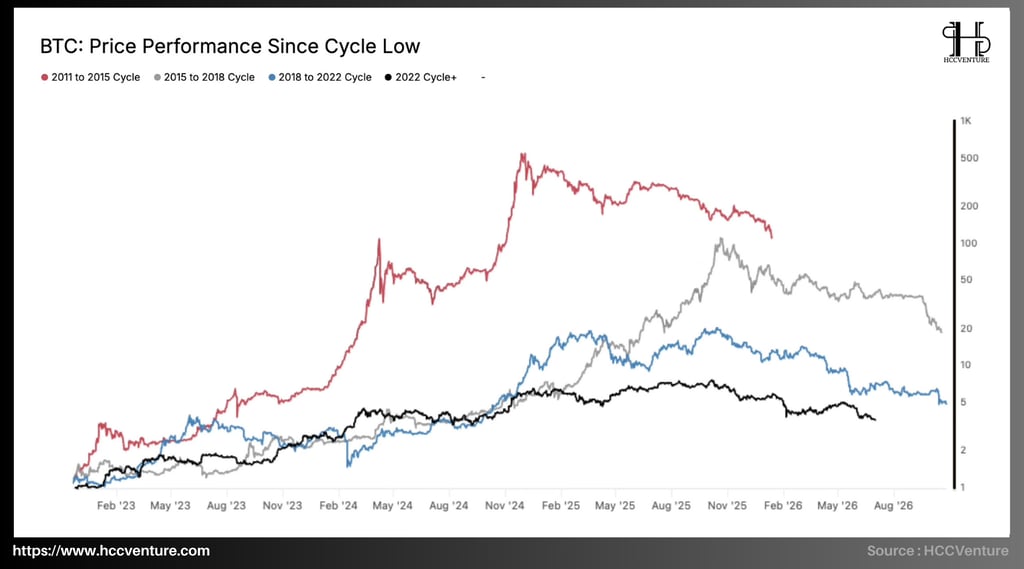
The current cycle is recording the lowest growth in Bitcoin's history; the all-time high (ATH) of $127,000 is not actually the highest point in this cycle. As market capitalization grows and the level of participation from financial institutions increases, each cycle generates lower returns than the previous one, but at the same time tends to be more stable in terms of structure and Bitcoin's maturation process from a small-cap speculative asset to a global financial asset with increasingly deep liquidity.
According to the data on the chart, Bitcoin formed a cyclical bottom at the end of 2022 around the $15,500 - $16,000 range . From this bottom, the price rose to a peak of approximately $127,000 in 2025 before correcting to the current range of $60,000 - $65,000 . Thus, the maximum increase of the current cycle is about 6 to 7 times from the bottom, significantly lower than all three previous cycles combined.
This decline doesn't reflect a weakening of Bitcoin, but rather stems primarily from its market capitalization having surpassed the trillion-dollar mark. Creating another cycle of price increases like before requires a much larger amount of new capital than in the initial stages.
In the 700–900 days following the bottom, both the 2015 and 2018 cycles entered a period of rapid acceleration with exponential growth. In contrast, the current cycle only recorded a stable upward surge before entering a prolonged correction phase. Small-scale speculative capital no longer plays the dominant role as in previous cycles; instead, Bitcoin is more heavily influenced by ETFs, investment funds, listed companies, and global liquidity conditions. As market size increases, price volatility gradually decreases, and the growth cycle becomes more sustainable rather than a rapid, volatile one.
Although Bitcoin has undergone a sharp correction in recent months, its current price of around $60,000-$65,000 is still nearly four times higher than its low point at the end of 2022. Therefore, much of the value created during the current cycle remains intact, but this is a period where growth performance has slowed down while the quality of capital flows and asset ownership structure have significantly improved.
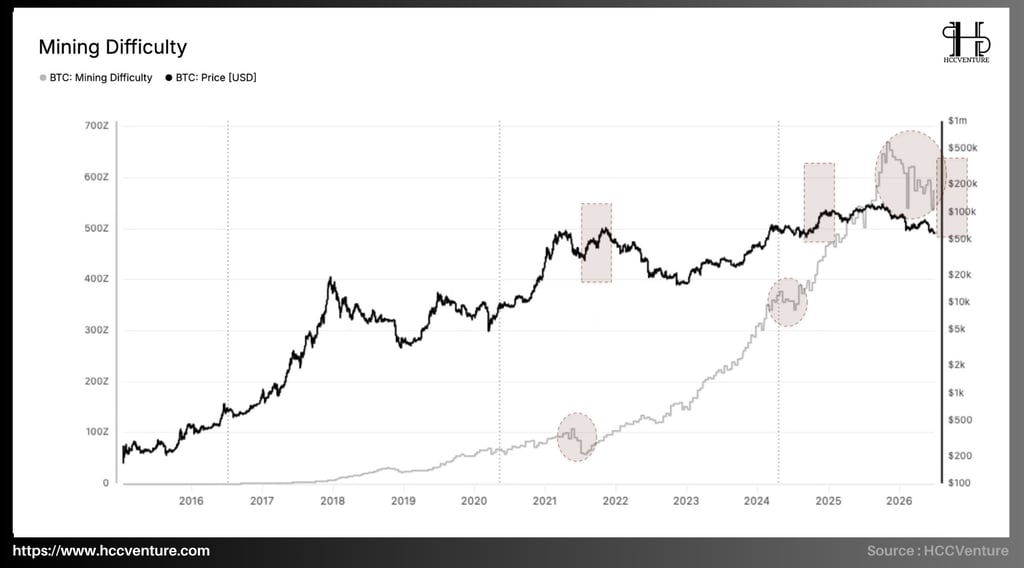
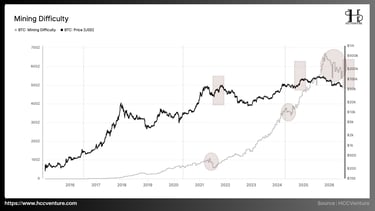
Alongside investors, miners are also facing difficulties as mining difficulty continues to remain at historically high levels, reflecting long-term confidence in the Bitcoin network. Historically , strong growth cycles in mining difficulty have always been associated with the expansion of hashrate, investment in mining infrastructure, and positive expectations for Bitcoin prices in the medium and long term. Conversely, periods of sharp decline in difficulty usually only occur after periods of capitulation, when many miners are forced to cease operations due to declining profitability or operating costs exceeding revenue.
According to current data, Mining Difficulty is still fluctuating around the 600–650 Z range , only slightly below its previous historical peak. Notably, the scale of the Difficulty correction is much smaller than the price drop; in previous cycles, Difficulty only experienced a few short corrections before quickly returning to a long-term uptrend. We are seeing that the majority of mining systems are continuing to operate stably instead of a widespread withdrawal.
Unlike previous cycles where price drops often led to sharp declines in hashrate, the current cycle reflects a more mature mining structure, with significantly improved financial capacity and operational efficiency of mining companies.
Research and Analysis
Market Summary
Analyzing on-chain metrics
Adjusted Sell-side Risk Ratio (ASSR)
Bitcoin Spot Average Order Size
Bitcoin Supply in Loss (%)
Short-Term Holders MVRV
BTC Price Performance Since Cycle Low
Mining Difficulty
Number of Transactions
Bitcoin Cost-Basis Comparison
Assessment and Conclusion
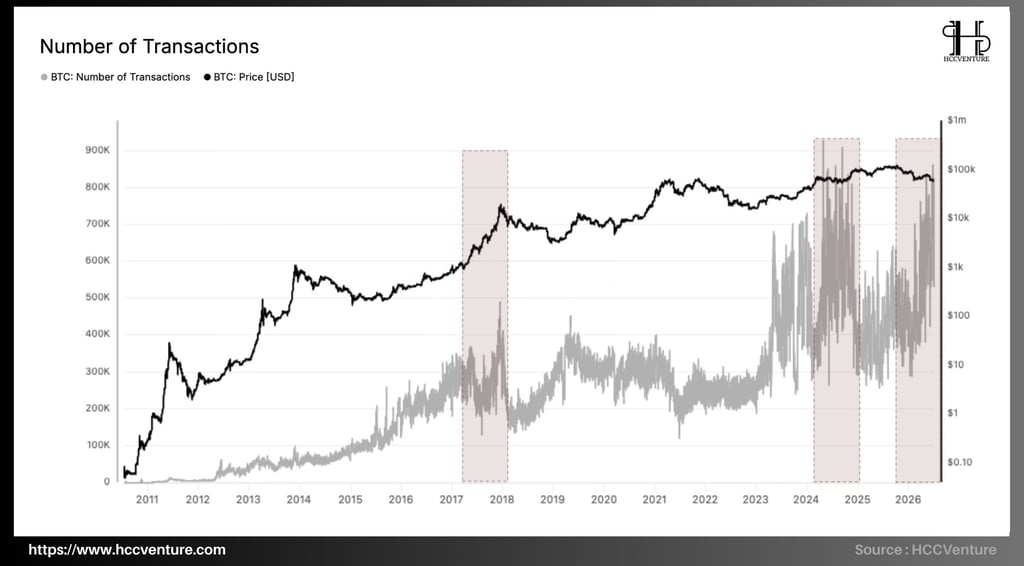
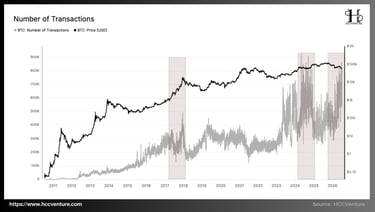
Transaction activity remains at historically high levels, reflecting stable demand for network usage, and the Number of Transactions is one of the key indicators reflecting the actual usage of the Bitcoin network, measuring the total number of transactions confirmed on the blockchain each day.
According to current data, the number of Bitcoin transactions fluctuates around 700,000-900,000 transactions per day , only slightly lower than the historical peak set in the 2024-2026 period. This is a much higher level of activity than in previous cycles, however, demand for network usage has not decreased correspondingly.
A prominent feature of the current cycle is the divergence between price volatility and trading activity. In previous cycles, when prices fell sharply, the number of transactions typically declined significantly due to speculative capital withdrawing from the market. This stability reflects that the price drop is primarily driven by corrective pressure from financial capital flows and macroeconomic factors, rather than a weakening in demand for Bitcoin.
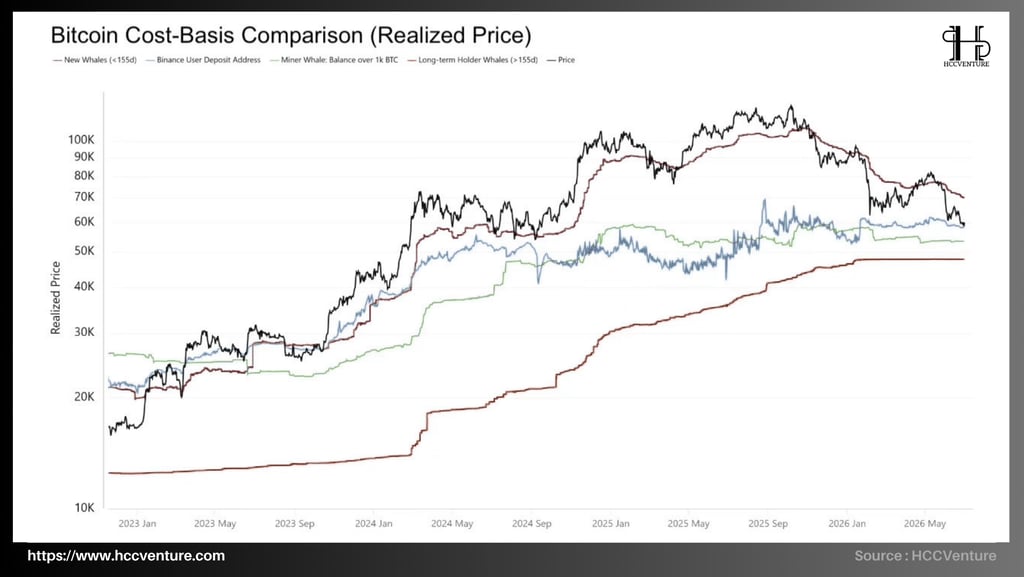
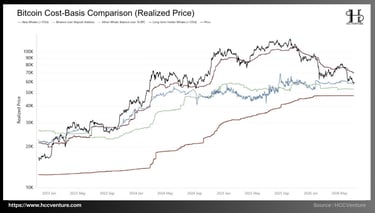
The Bitcoin Cost-Basis Comparison index shows that the market is currently entering a phase of testing the cost of capital for short-term investors, while long-term holders maintain significant profits and there are no signs of widespread capitulation. In previous deep downturns, the cost basis of many groups often remained flat or decreased due to prolonged sell-offs. Conversely, the fact that the entire cost basis structure continues to shift upwards is evidence that Bitcoin's long-term revaluation process is still ongoing.
Currently, this gap has been almost completely eliminated as market prices fluctuate just above the cost basis of recent buyers. This indicates that most of the profit-taking pressure from new investors has been absorbed, and the market is gradually entering a supply-demand rebalancing phase. Meanwhile, the gap to the cost basis of long-term holders remains relatively large, suggesting that the long-term accumulation trend has not yet been broken.
More importantly, the cost basis for this group continues to steadily increase over time, reflecting their consistent absorption of supply at higher price levels rather than distributing all assets. This is a characteristic often seen in the middle of a growth cycle, when assets shift from short-term investors to owners with longer holding periods.
Our assessment and conclusions
Bitcoin has approached the cost of capital zone for short-term holders and new whales , causing the supply-in-loss ratio to rise above 50% , the highest level since the 2022–2023 correction. Historically, whenever more than half of the circulating supply is in a loss-making state, the market typically enters a phase of asset transfer from weak investors to institutions and long-term investors with a better ability to absorb liquidity.
Simultaneously, the Adjusted Sell-side Risk Ratio has fallen to historically low levels, indicating a significant contraction in the value of realized transactions on the chain. This reflects a large proportion of investors no longer willing to sell Bitcoin at the current price, causing a sharp decrease in natural supply pressure after the correction phase. In previous cycles, this state typically occurred when the market approached a price equilibrium, where supply and demand began to stabilize before forming a new trend.
Valuation indicators suggest that the majority of supply has shifted from short-term investors to owners with longer-term confidence. Simultaneously, profit-taking activity has decreased significantly, natural selling pressure has weakened, and market prices are approaching the cost of capital for the new investment group, creating a relatively solid accumulation base for the next cycle.
Provided global liquidity conditions do not worsen further and institutional capital flows return following a more stable interest rate environment, the probability of Bitcoin completing a medium-term bottoming process will continue to increase. In terms of on-chain valuation, the market is no longer in a euphoric or overvalued state; instead, Bitcoin is trading near its fair value based on the cost of capital for most new investors, while long-term investors continue to accumulate.
Disclaimer: The information presented in this article is the author's personal opinion in the field of cryptocurrencies. This is not financial or investment advice at all. Every investment decision should be based on careful consideration of your personal portfolio and risk tolerance. The opinion in the article does not represent the official position of the platform. We recommend that readers do their own research and consult experts before making any investment decisions.
API & Data: Glassnode
Synthesized and analyzed by HCCVenture
Join the HCCVenture organization here: https://link3.to/holdcoincventure
Explore HCCVenture group
HCCVenture © 2023. All rights reserved.


Connect with us
Popular content
Contact to us
E-mail : sp_contact@hccventure.com
Register : https://linktr.ee/holdcoincventure
Disclaimer: The information on this website is for informational purposes only and should not be considered investment advice. We are not responsible for any risks or losses arising from investment decisions based on the content here.

TERMS AND CONDITIONS • CUSTOMER PROTECTION POLICY
ANALYTICAL AND NEWS CONTENT IS COMPILED AND PROVIDED BY EXPERTS IN THE FIELD OF DIGITAL FINANCE AND BLOCKCHAIN BELONGING TO HCCVENTURE ORGANIZATION, INCLUDING OWNERSHIP OF THE CONTENT.
RESPONSIBLE FOR MANAGING ALL CONTENT AND ANALYSIS: HCCVENTURE FOUNDER - TRUONG MINH HUY
Read warnings about scams and phishing emails — REPORT A PROBLEM WITH OUR SITE.