


On-chain analysis week 27/2025: Is the psychology of LTH and STH fear or expectation?
A notable feature of the current Bitcoin market is the long-term holding trend, or HODLing, among the majority of investors. The majority of Bitcoin investors are currently holding unrealized profits, or unrealized profits, after Bitcoin's price rose to $107,000.
7/6/202511 min read
Market Summary
Bitcoin currently has a market capitalization of around $2.1 trillion and a realized capitalization of $955 billion. While the Bitcoin market is still maturing into a multi-trillion dollar asset, the difference between its market capitalization and realized capitalization shows that investors have made a lot of money from previous price increases.
Currently, unrealized profits total $1.2 trillion. This suggests that most investors are not taking profits immediately; instead, they are holding their positions for the long term.
The number of Long-Term Holders (LTH) has increased significantly, according to the HODLing index in on-chain indicators, reaching an all-time high (ATH). The number of investors holding Bitcoin for a long time is increasing, indicating a shift from using Bitcoin as a store of value asset to a short-term trading instrument.
As of July, Bitcoin's realized profits index shows a significant decline in profit taking, while realized profits—also known as yield—are trending downward.
Institutions Still Want Bitcoin. Despite Bitcoin's soaring price, investment funds and institutions have continued to pour money into it, according to blockchain indicators.
On-chain metrics analysis
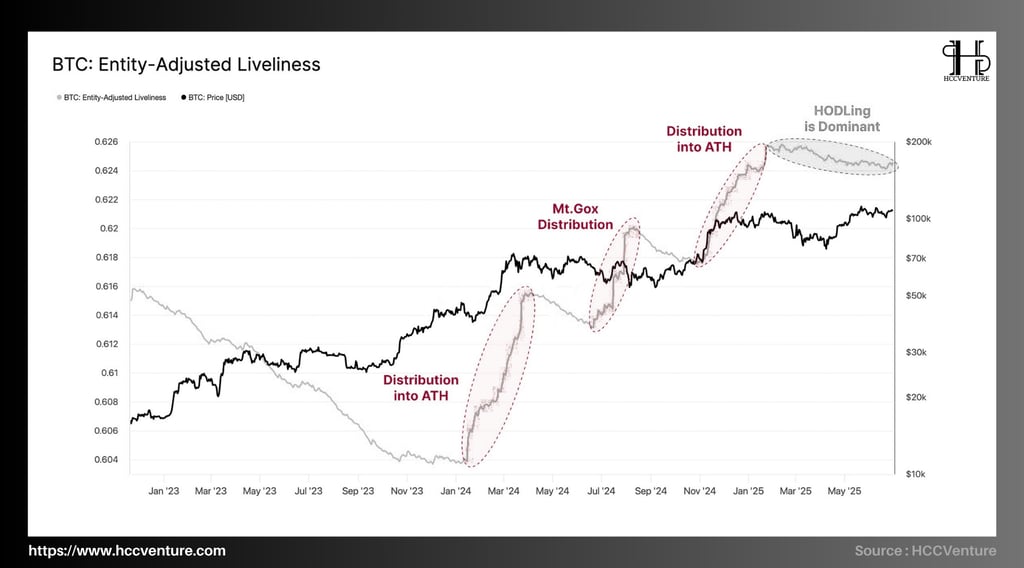
Liveliness is an on-chain metric that reflects the overall behavior of Bitcoin investors in choosing between holding (HODLing) and spending (spending).
Liveliness increases → The market prioritizes spending, profit-taking, and distribution trends.
Liveliness decreases → Investors mainly hold, accumulation psychology prevails.
During the period from June 2024 to June 2025, only Liveliness continued to decline again and entered a low stability zone, although the price of BTC fluctuated around the $100,000 threshold. On the chart, "HODLing is Dominant" indicates this period.
Current Liveliness levels hover around 0.606–0.608 , close to the 2021 low.
The negative correlation between Life and BTC price remains: the Life index is falling again, indicating long-term investor sentiment and lack of selling pressure, while BTC price recovers to the $100,000 to $110,000 range.
Even though Bitcoin is at an all-time high, investors have no incentive to sell. The market’s sensitivity to new demand increases when there is less liquidity. This is the basis for the price to rise to new value areas.
The HODLing trend is driven by low cost of holding BTC when real interest rates are negative or traditional financial system risks increase.
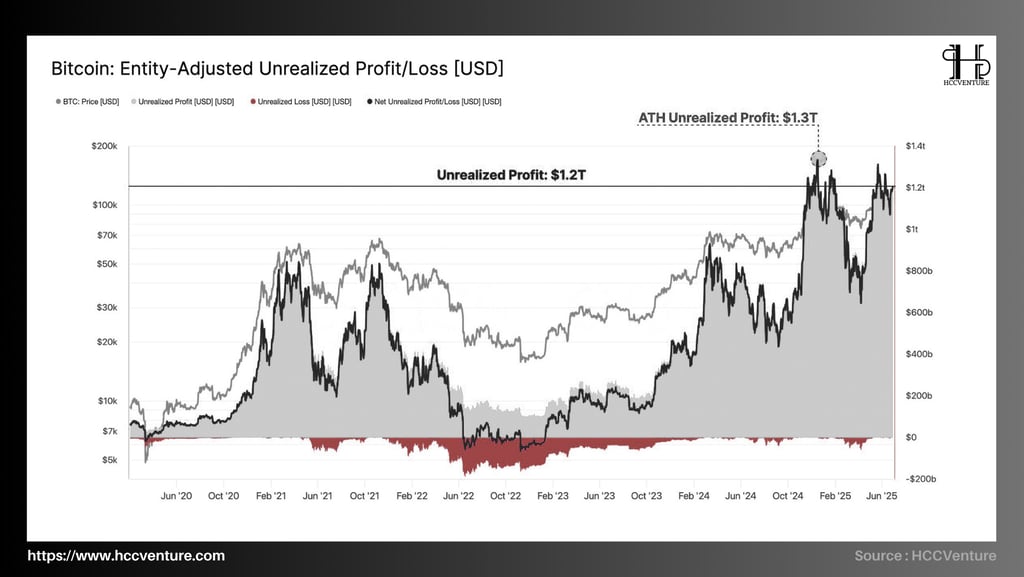
The entity-adjusted Unrealized Profit/Loss (P/L) metric is an important tool in on-chain analysis, reflecting the unrealized profit (or loss) on the entire circulating Bitcoin supply.
Unrealized Profit = Market Cap – Realized Cap
If market price > average purchase price → investor is holding unrealized profit.
According to the chart provided by HCCVenture:
Currently, the entire Bitcoin network is sitting on about $1.2 trillion of idle cash.
By the end of Q1/2025, when Bitcoin price approaches $120,000, the all-time high (ATH) will be $1.3 trillion.
Most investors are in profit as unrealized losses are now almost completely eliminated.
The chart shows a strong correlation between the sharp increase in Unrealized Profit and the BTC price momentum throughout the entire cycle from 2020 to mid-2025.
In particular, the market often faces local profit-taking pressure when profits have not exceeded the threshold of 1.0–1.2T USD. This leads to adjustments.
Despite Bitcoin's price trading between $105,000 and $115,000, unearned profits have remained stable at around $1.2T instead of falling sharply after recent corrections. Two arguments are made:
1 - The market remains stable and there is no panic selling.
2 - Many investors favor long-term beliefs over immediate gains.
Unrealized Loss has dropped to its lowest level since December 2020. The so-called “loss zones” on the chart have almost completely disappeared. This shows that the selling pressure from current losing addresses is very small.
In mature markets, long-term holding strategies replace short-term speculative strategies and high unrealized profits are maintained over long periods of time.
While high unearned returns are often a necessary condition for a distribution phase (distribution phase), the stability in the profit and loss ratio as well as the lack of negative volatility in HODL behavior suggest that there is no major systemic risk in the short term.

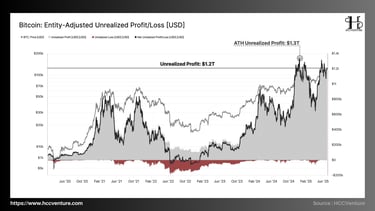
Net buying power of stablecoins (USDT, USDC, DAI, and BUSD) has experienced consistent declines in the first six months of 2025. The most notable declines occurred in March–April and May–June.
April 2025, the largest drop in purchasing power since early 2023, surpassing $80 billion.
At the end of June 2025, the index was still in the negative zone below -40 billion USD , showing that stablecoin capital flows have not yet returned to the market.
Although Bitcoin's price remains high between $100,000 and $110,000 , the slowing increase shows that liquidity pressure is starting to impact the upside momentum.
Between late 2023 and early 2024, each spike in the index—known as the “ grey zone ” —coincided with a BTC rally, suggesting that stablecoin inflows acted as a “trigger” for the growth. Conversely, strong stablecoin outflows coincided with BTC price changes in April and January 2020.
During the “ short-term liquidity tightening ” phase of the market, stablecoins were withdrawn from the exchange as the price of Bitcoin increased significantly.
Instead of holding stablecoins on exchanges, investors may be moving capital into major cryptocurrency assets (BTC, ETH) —this reflects a “capital flight” trend, which is positive in the long term but negative in the short term for liquidity.
From the perspective of asset liquidity cycle, the decrease in the number of stablecoins on the exchange does not mean there is selling pressure. Instead, it is a sign of capital shifting from stablecoins to native crypto.
But if the stablecoin withdrawal momentum continues in an environment without new inflows, market liquidity will erode, leading to greater volatility and a higher likelihood of correction.
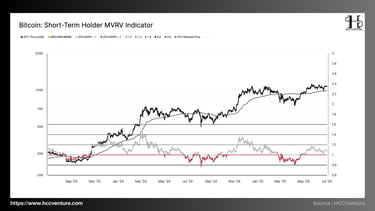
The market cap slowed down, stabilizing around $2.15–2.25T in the first six months of 2025. However, the Realized Cap continued to grow strongly and has now surpassed $950 billion. This shows that real capital is flowing into the Bitcoin ecosystem through buy and hold transactions.
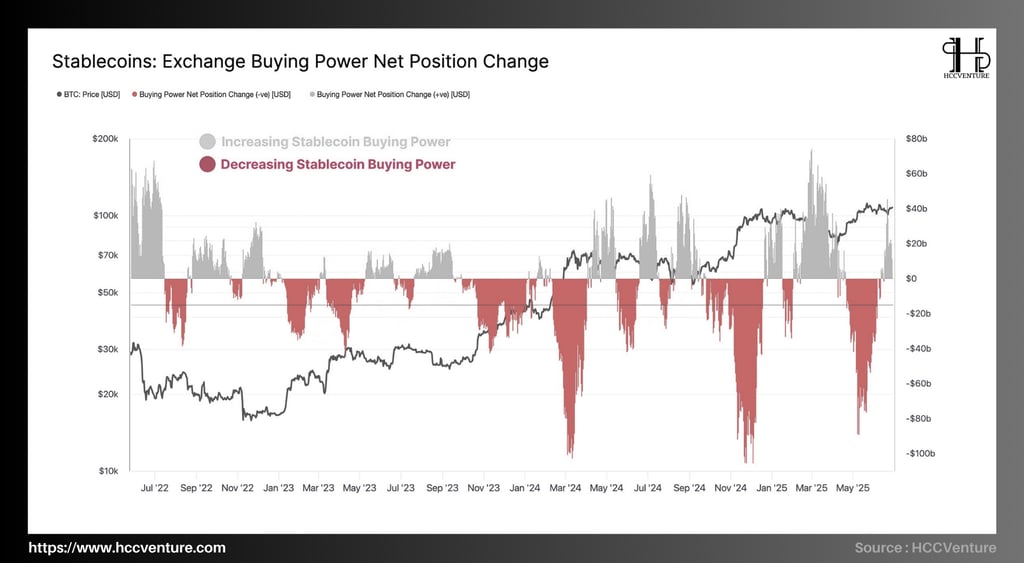
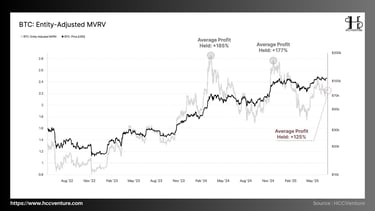
The current MVRV at ~2.25 suggests the average investor has an unrealized gain of approximately +125% on their initial capital.
The current level is down significantly from MVRV's last peak in March 2022, when it reached around 3.2, representing a +180% return at the ATH price of $73,000.
MVRV also only increased to around 2.7 after the BTC price broke $100,000 in December 2022. This is lower than previous cycles such as 2017 (4.5) and 2021 (3.7).
Although nominal returns are near ATH levels, MVRV has not increased significantly due to the divergence between the two components created by Realized Cap increasing faster than Market Cap recently.
Although investors are recording significant profits, the MVRV index is not rising too high, indicating that profit-taking pressure is low.
The capital structure is shifting from long-term accumulation to speculation, with Bitcoin being bought at higher price zones. This raises the Realized Cap but does not increase the Market Cap, which reinforces a sustainable price base.
From the perspective of behavioral finance and the theory of asset cycle distribution:
The current MVRV indicates that market returns are healthy but not in a “bubble” state – which is often associated with MVRV > 3.5.
The market is reflecting investor maturity , as high interest rates do not lead to FOMO or hasty distribution.
The deviation between Unrealized Profit and MVRV Ratio further reinforces the view that BTC price can continue to rise without fear of massive profit-taking pressure.
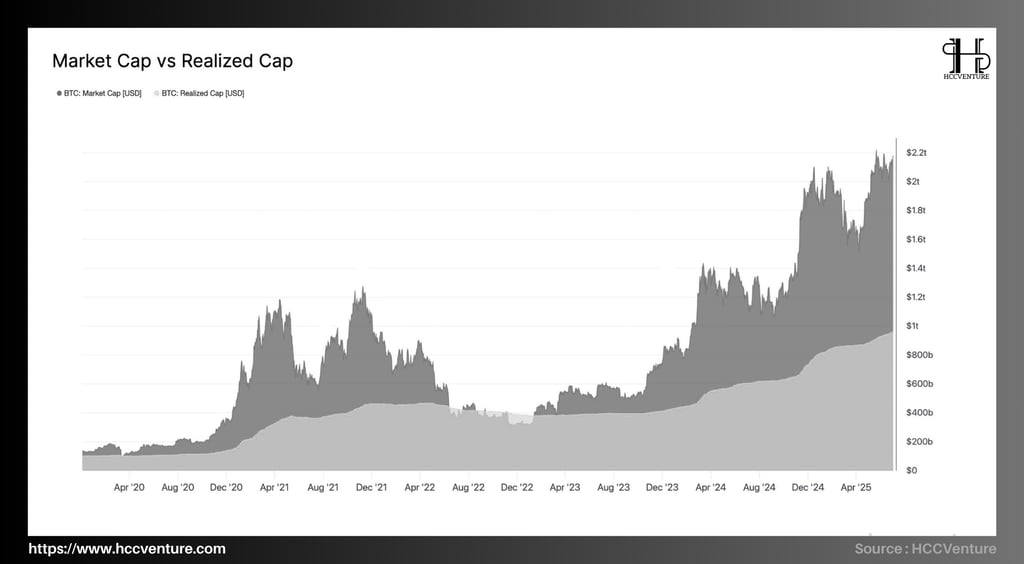
By mid-2025, the market value has increased more than 6.9 times, rising from the cycle bottom ($304 billion at the end of 2022) to the current peak of more than $2.1T.
On the other hand, the realized value increased more than 2.4 times, from about 400 billion USD to nearly 960 billion USD.
The chart shows that both the total sale amount and the total amount raised have increased sharply and synchronously since the beginning of 2023. This shows not only a short-term price increase but also an actual expansion of the network's capitalization.
Investors are buying at higher prices, reinforcing the market's new underlying cost structure, showing real capital is pouring into the market.
Currently, the difference between market value and realized value is about $1.17 trillion , representing the total unrealized profit of the market.
This spread is not as extreme as previous peaks (2021, 2017)—distribution risk has not yet erupted.
The reasonable unrealized profit spread and the synchronization between market value and realized value indicate a healthy Bitcoin market, driven by a sustainable price structure.
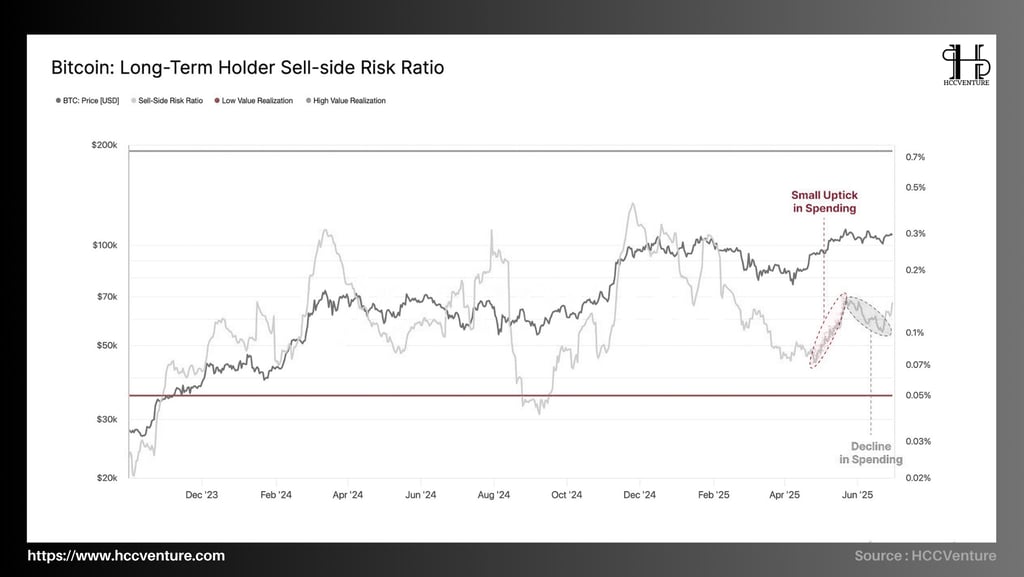
The current Sell-Side Risk Ratio is at its lowest level in the past 10 months , hovering around 0.004 – 0.005 , equivalent to the previous mid-cycle accumulation period (May 2023).
During the period of February - April 2025 , this index peaked above 0.015 , coinciding with the period when BTC broke the $100,000 peak and reached the high of $110,000 → a large amount of BTC was booked at a high profit level.
However, since mid-May, the index has fallen sharply and remained in a stable low zone, reflecting that market behavior has shifted from distribution to capital retention .
The early 2025 period saw strong distribution pressure from the STH group , especially at the $100k–$111k price range. However, this pressure has decreased significantly in the last 6 weeks . The reason is that most of the BTC held by this group has been transferred to new buyers, increasing the average cost and reducing profit margins → reducing the incentive to sell.
The sharp decline in the Sell-Side Risk Ratio reflects that the market is entering the cost equilibrium zone , where it is no longer attractive enough to encourage profit-taking selling behavior.
Sell-Side Risk Ratio is an indicator of potential sell-side pressure . When this indicator is low, there are two strategic implications:
No pressure to sell → stable market, tight supply structure.
New supply can only be unlocked if the price moves stronger → creating a “psychological trigger threshold” for investors.
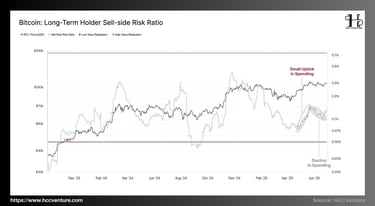
According to data provided by HCCVenture, the LT-H SSRR is currently in the low zone of 0.07%, below the historical median of 0.10% and within the long-term safe zone.
A slight increase of 0.18% occurred from March to April 2025, corresponding to the period when BTC broke the $100,000 peak, indicating a short-term profit-taking phase for LTH.
But the index has been falling since mid-May, showing that selling pressure from the LTH group has weakened significantly.
The slight increase in SSRR at the time of BTC's new peak was caused by some long-term investors, mainly those who earned accumulated profits from previous cycles. After that, most LTH returned to HODL status, as shown by the decrease in SSRR and the increase in supply held by LTH.
The decline in this index is consistent with other indices such as:
Liveliness continues to decline → HODLing activity dominates.
Realized Profit/Loss is declining → less profit taking or stop loss action is taking place.
LTH supply increases steadily → there is no reversal of coin flow from LTH to exchanges.
When the market tops, it is no longer attractive for long-term investors to sell. This shows the certainty of expecting higher prices in the future.
The market supply structure is very stable, with high elasticity of upward breakout in the context of low SSRR.
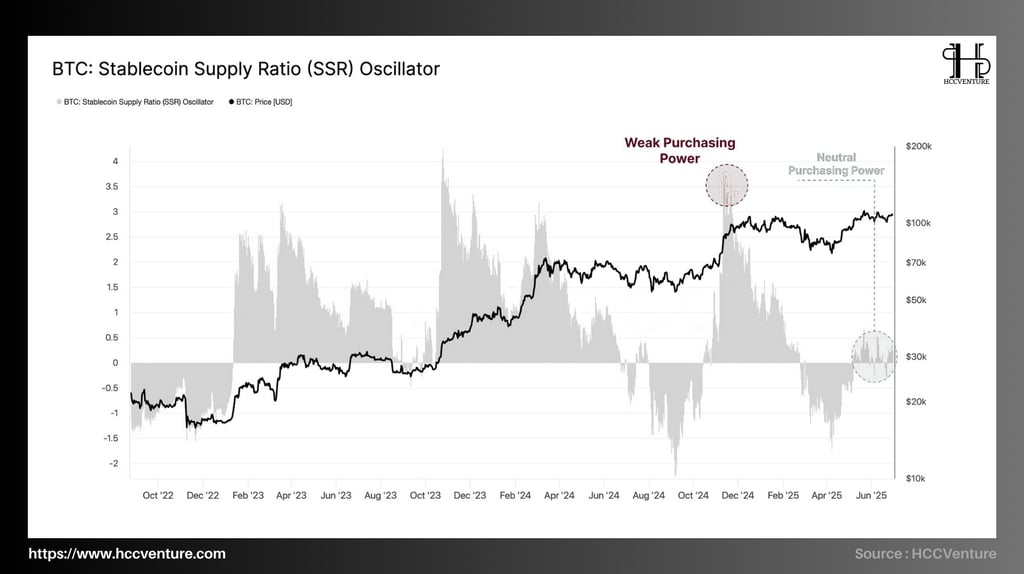
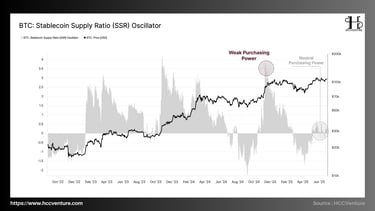
Stablecoin Supply Ratio (SSR) is an important indicator that measures the relative purchasing power between stablecoins (representing USD liquidity) and BTC supply. Specifically, SSR is defined as:
SSR = Total BTC supply / Total stablecoin supply (normalized to BTC)
Low SSR : large amount of stablecoins compared to BTC → strong buying power → market has a lot of “dry powder”.
High SSR : relatively small amount of stablecoins → weak purchasing power → risk of lack of liquidity, decreased demand.
The SSR Oscillator is currently hovering around the 0.00 equilibrium level. It is no longer as negative as in Q1/2025 or as bullish as in the early stages of Q4/2024.
The index peaked above 3.5 in December 1924, a clear sign of weak buying. This happened at the time BTC broke $100,000, which shows the usual reaction structure: price increases but no sustained buying.
Currently (June 2025), SSR has returned to neutral territory as the market has balanced the amount of usable stablecoins and the BTC supply at the current price of $110,000.
The main reason why BTC failed to sustain its bullish momentum was when BTC broke the $100K peak for the first time in late 2024. The rise in SSR shows weak stablecoin buying power and shows that capital inflows are not ready to expand.
Although the BTC price remains high, SSR has dropped significantly, demonstrating that the purchasing power of stablecoins has increased significantly. This proves that investor demand is indeed supporting the current market capitalization.
Low SSR while prices remain near the top is a very positive sign: the market is not driven by speculation, but reflects improved endogenous demand and increased real liquidity.
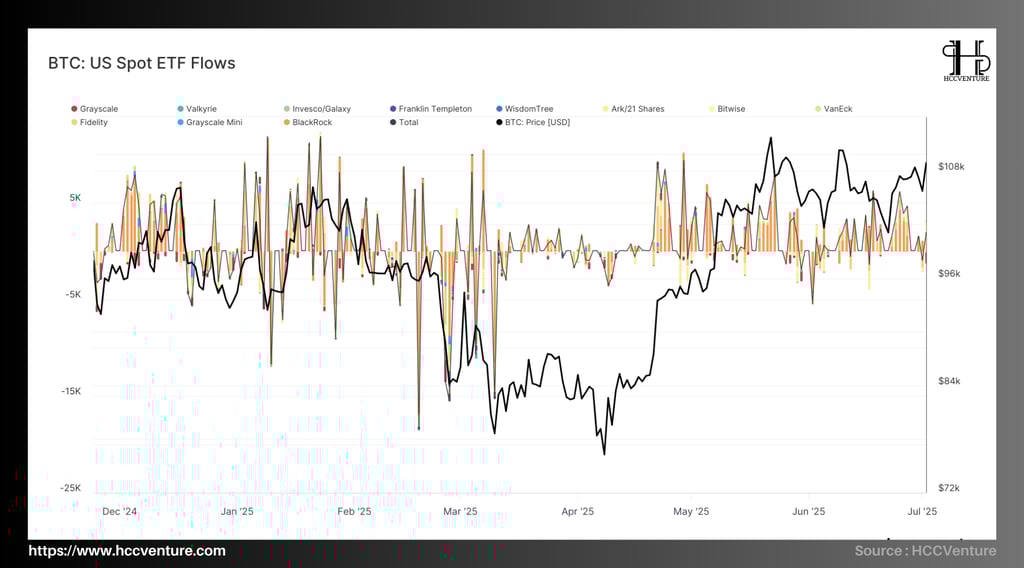
Bitcoin spot ETFs in the United States have become a conduit for institutional capital to enter the crypto market since their approval by the SEC in early 2024. The flows from these ETFs provide an important indicator of:
Capital allocation trends of institutional investors .
Direct impact on liquidity and buying/selling pressure in the spot market .
Reflects macroeconomic expectations and risk asset market sentiment .
Overall cash flow—showing a steady accumulation trend from May to early July 2025—remains in a slightly positive zone, although not as strong as in Q1.
BlackRock remains stable and strong, regularly recording positive net inflow sessions above 5,000 BTC.
Grayscale shows a trend of negative net inflows, suggesting that investors holding GBTC are trying to divest before moving to a direct ETF.
While small funds like WisdomTree, Franklin Templeton and VanEck all contribute little, they all reflect the trend toward diversification and capital allocation among asset managers.
Despite Bitcoin's price swings from $95,000 to $108,000 in the short term, data shows that there has been no major capital outflow since the beginning of June. This shows that the market sentiment is stable.
In the current period, capital flows tend to reduce the amplitude of fluctuations, but they still remain at a positive level, which reduces the risk of deep adjustment and creates a solid liquidity support foundation.
Evaluation and Conclusion
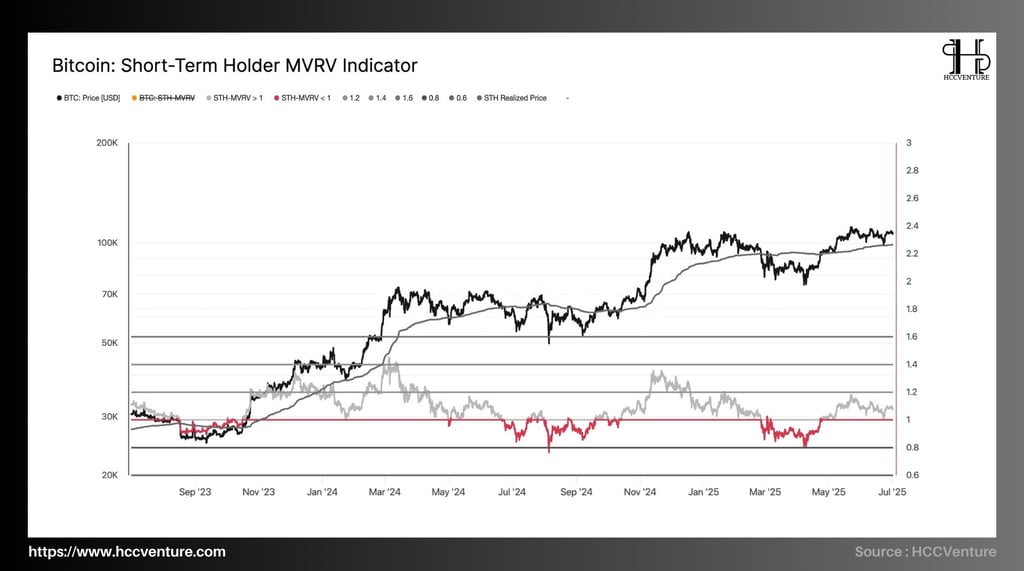
Bitcoin has established a solid support zone at the short-term investor price level, also known as the short-term investor price level. This is an important boundary between the short-term growth trend and correction and is considered a technical level used
There are no signs of major distribution, although prices have rebounded to near their previous highs and the unrealized profits of the entire market have reached $1.2 billion. Specifically:
Liveliness continues to decline → HODLing behavior clearly dominates.
Realized Profit volume decreased significantly → showing that investors did not take advantage of the uptrend to take profits .
Long-Term Holder Supply hit an all-time high , accounting for over 70% of total circulating supply , confirming that strong hands are unmoved by short-term price fluctuations.
The Stable Purchasing Power (SSR) Oscillator is currently hovering around the equilibrium level. This is in stark contrast to the peak of SSR and the decline in purchasing power at the end of 2024.
With the current stablecoin volume at a steady level on exchanges, the market has a large USD liquidity layer available, which could support prices in the event of further bullish signals.
Analysis of the capital flows of Bitcoin spot ETFs in the United States shows that, although not as explosive as in the first quarter, capital flows from May to now have been positive. Notably, there have been no large withdrawals from institutions, even during price corrections; this shows confidence and a clear capital allocation strategy in the long term.
Disclaimer: The information presented in this article is the author's personal opinion on the cryptocurrency field. It is not intended to be financial or investment advice. Any investment decision should be based on careful consideration of your personal portfolio and risk tolerance. The views expressed in the article do not represent the official position of the platform. We recommend that readers conduct their own research and consult with a professional before making any investment decisions.
API & Data : Glassnode
Compiled and analyzed by HCCVenture
Join HCCVenture here: https://linktr.ee/holdcoincventure
See other on-chain analysis articles :
Explore HCCVenture group
HCCVenture © 2023. All rights reserved.


Connect with us
Popular content
Contact to us
E-mail : sp_contact@hccventure.com
Register : https://linktr.ee/holdcoincventure
Disclaimer: The information on this website is for informational purposes only and should not be considered investment advice. We are not responsible for any risks or losses arising from investment decisions based on the content here.
TERMS AND CONDITIONS • CUSTOMER PROTECTION POLICY
ANALYTICAL AND NEWS CONTENT IS COMPILED AND PROVIDED BY EXPERTS IN THE FIELD OF DIGITAL FINANCE AND BLOCKCHAIN BELONGING TO HCCVENTURE ORGANIZATION, INCLUDING OWNERSHIP OF THE CONTENT.
RESPONSIBLE FOR MANAGING ALL CONTENT AND ANALYSIS: HCCVENTURE FOUNDER - TRUONG MINH HUY
Read warnings about scams and phishing emails — REPORT A PROBLEM WITH OUR SITE.