


On-chain analysis week 26/2025: Bitcoin keeps stable fluctuations
Bitcoin has been holding its price in the $100,000–$110,000 range in recent weeks. However, on-chain metrics are showing a clear decline in investor participation and price momentum.
6/30/20258 min read
Market Summary
Bitcoin price dropped to $99,000 amid rising geopolitical tensions, but quickly recovered to $106,000 on news of easing tensions. It has since remained in the $100,000–$110,000 range, a range where Bitcoin has been stable since early May.
According to the CBD Heatmap (Coinbase Blockchain Data), this area shows a significant level of accumulation in Q1 2025. This support zone has been formed by large investor and institutional purchases.
Realized returns from Bitcoin's third bull run are now trending downward, reflecting a decline in investor participation and activity, especially those who bought in during previous price waves.
On-chain transaction volume has dropped by 32%, which clearly shows a decline in investor participation and a lack of momentum from transactions.
Spot volume is currently low at just $7.7 billion, indicating a halted market and lack of strong investor participation.
Although futures volumes remain high, open interest has declined by 7%. Liquidations have increased on both the long and short sides, indicating a lack of stability and confidence in the market.
On-chain metrics analysis
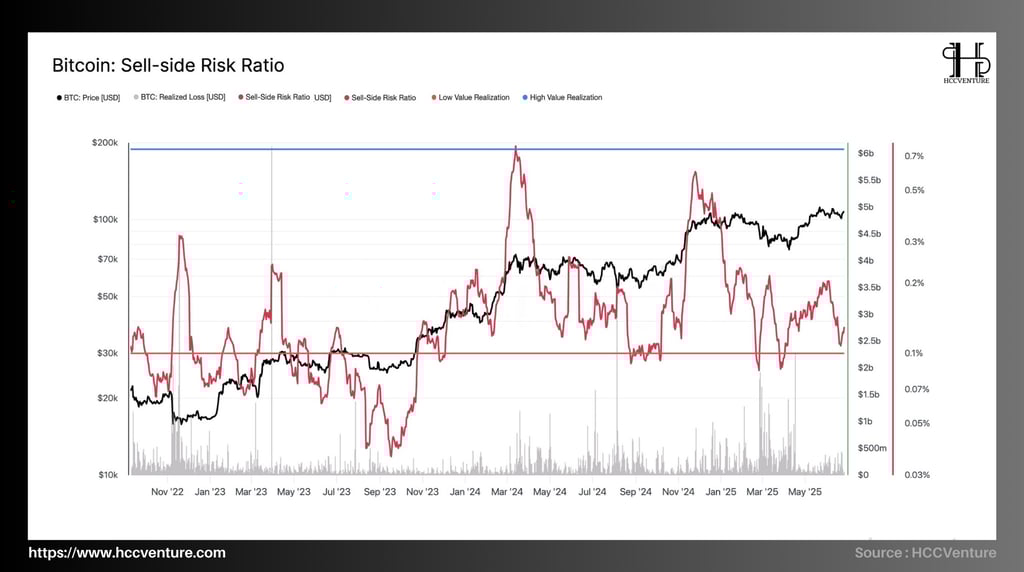
SSR is holding low, confirming low selling pressure and a wait-and-see, non-speculative market sentiment. The data shows no large cash outflows from the market, compared to previous cycles:
Accumulation phase 2023:
SSR fluctuates around the low threshold of ~0.1%, accompanied by BTC price fluctuating between $17,000–$25,000.
The Realized Loss index is large during this period, reflecting the 2022 post-bear market stop-loss behavior.
Strong growth period in late 2023-2024:
SSR increased sharply to the ~0.4–0.5% range at the peaks of ~$40,000–$45,000.
This shows a large amount of BTC being sold at a profit – confirming the early stages of a bull market.
Current adjustment phase:
SSR is down significantly, currently around 0.1–0.15%, while BTC price is stable around above $100,000.
Low realized profit/loss volume, reflecting holding and re-accumulation status.
Bitcoin is in a healthy post-peak consolidation phase, with the potential to initiate a new bull cycle as selling pressure eases significantly. A low SSR is a confirmation signal that the market is stabilizing and consolidating.

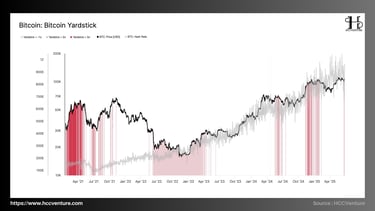
Bitcoin Yardstick is an on-chain index that evaluates the valuation of BTC based on the correlation between market price and network hashrate. In which:
Low yardstick → BTC is undervalued relative to network security strength (hashrate).
High yardstick → BTC is overvalued relative to network security.
The chart shows that the indicators are showing clear signals:
7DMA network hashrate reaches ~660 EH/s
Bitcoin Yardstick ~0.096 USD/EH/s
Yardstick valuation < 1σ (low valuation zone).
With Yardstick below -1σ, BTC is currently still undervalued relative to the network's security hashrate strength.
The current hashrate is steadily increasing and is near its all-time high (~700 EH/s), reflecting long-term confidence from the mining ecosystem.
Although Bitcoin has reached a new ATH at around $110,000 according to Coinmarketcap data, Yardstick has not increased accordingly , as the hashrate has increased faster than the price → the valuation gap creates a buying opportunity .
Based on Bitcoin Yardstick Index analysis , Bitcoin is currently objectively undervalued relative to its network strength.
→ Create an attractive value accumulation environment for long-term investors, with low risk and strong growth potential if price adjusts accordingly to hashrate.
Although Bitcoin has reclaimed the $100k–$110k price range , the following signs show that the market is entering an accumulation and correction phase when:
30DMA Realized profit around ~$820 million USD/day
Total realized profit ~650 billion USD
On-chain volume down ~25% vs Q1/2024
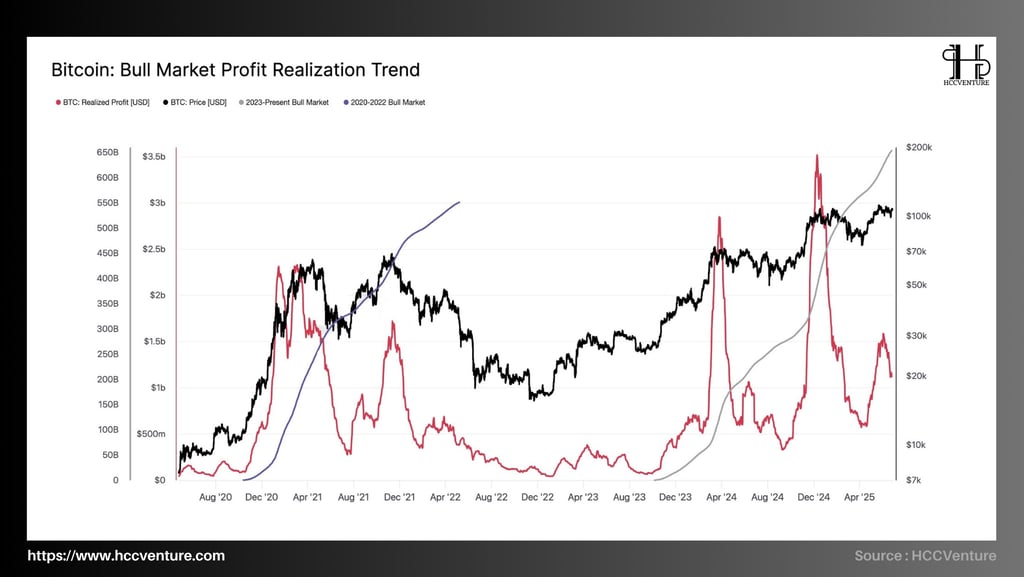
Observing the bull market cycle from 2022 to present, we see:
The 2020–2022 period has a total realized profit of ~550 billion USD . Including 2 main profit-taking waves in Q1/2022 and Q4/2022. The realized profit peaks exceed $2.5–3 billion/day , showing high selling pressure and strong profit-taking cycles.
Phase 2023–2025 (ongoing)
Total realized profits have reached ~$650 billion , higher than the previous cycle, although it is not yet over.
There have been three strong profit realizations :
Early 2023 (~$30k–$40k),
End of 2023 (~$52k–$58k),
And the nearest peak is in March 2024 when BTC price hits ~$73k .
Currently (June 2025), the Realized Profit index is falling below $1 billion/day → confirming a weakening profit momentum phase .
The decrease in profit volume shows that selling pressure is temporarily weakening . On-chain activity (volume, number of transactions >1 BTC) is decreasing → investors are less interested in redistributing capital at current prices .
There was no new strong profit-taking wave , confirming that the market was digesting the previous uptrend .
Bitcoin is currently in a cooling-off phase after its biggest profit peak in March 2024. Although the price has recovered to a record high, profitability and on-chain activity indicators show a lack of fresh momentum to establish a new high in the short term.
This is fully consistent with the behavioral rules of nonlinear asset growth cycles: after large profit waves, the market needs a period of capital repositioning and liquidity reaccumulation , before entering the next phase of sustainable growth.
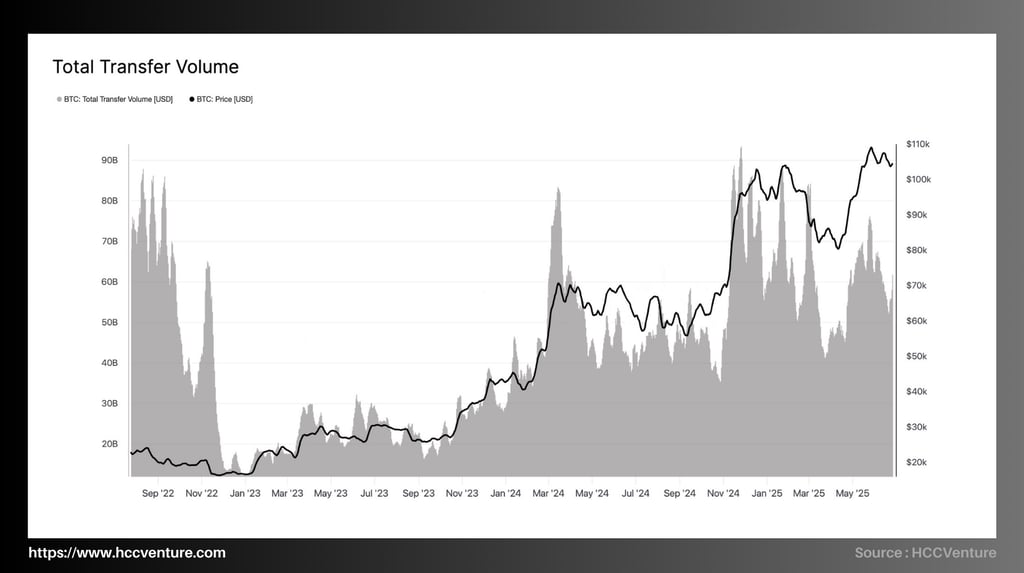

Total volume traded has fallen 32% from its recent peak of ~$76 billion/day in May 2024.
Currently, the Transfer Volume index is around 52 billion USD/day according to 7DMA, although BTC price is still maintaining a high area above $100k, on-chain activities are clearly cooling down .
→ A clear sign of a "cooling-off phase" after a strong profit cycle.
The decline in on-chain trading volume while prices remain stable suggests that the market is:
Fall into a state of static distribution : investors no longer have large capital movements.
Lack of further growth momentum : new cash flow has not appeared significantly.
Signs the market is "digesting" the previous increase , waiting for a new trigger on liquidity.
While BTC price is holding around $100k–$110k, the on-chain market is entering a clear moderation phase. The ~32% decline in Transfer Volume indicates cooling of money flow dynamics , and confirms investor hesitation after large profit realizations.
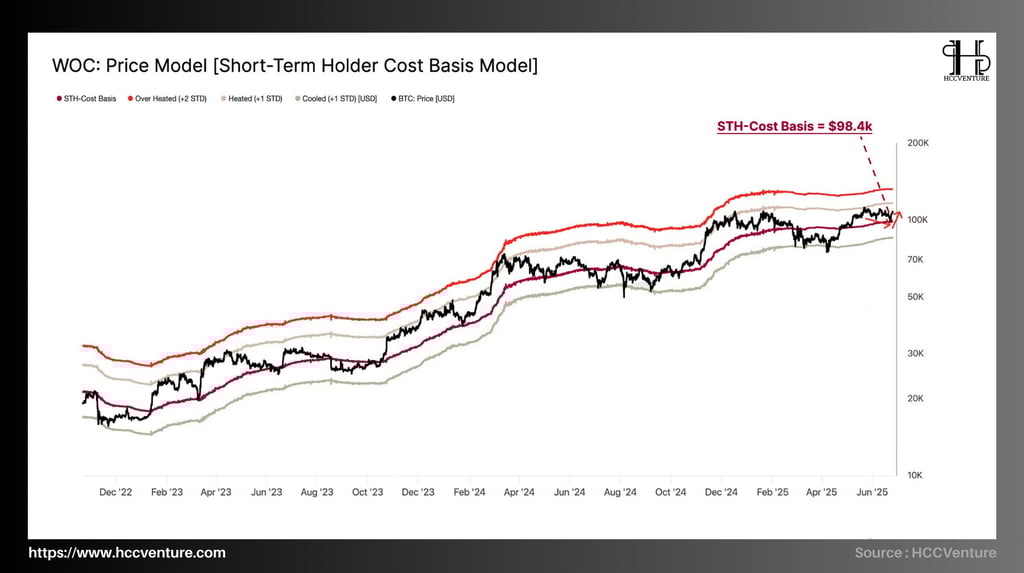
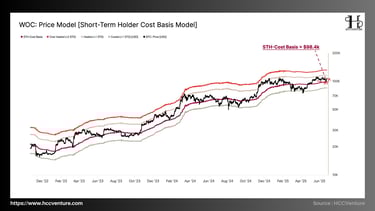
Bitcoin price is currently holding steady above the short-term holding cost threshold (STH-Cost Basis = $98.4k), confirming a healthy on-chain growth structure. The recent corrections have not broken this dynamic support level, indicating that investor sentiment remains strong, and the selling pressure from the STH group is currently low.
When the market price is higher than STH-CB → short-term investors are making a profit, positive sentiment.
When the price falls near or below STH-CB → this group can sell to cut losses, creating downward pressure on prices.
Over the weekend, BTC price dropped sharply to $99,000 , approaching STH-Cost Basis ($98.4k) due to geopolitical factors.
However, the correction was quickly rejected, and the price recovered strongly to the $106k area , demonstrating the existence of demand right at the average cost zone of STH. The chart shows that the STH-Cost Basis is currently acting as an important dynamic support for the market.
The fact that the price remains above the STH-CB threshold shows that short-term investors are still holding profitable positions and have no motivation to sell off.
The narrow fluctuation range around $100k–$110k from May 8 to now (over 50 days) reflects that the market is in a state of static accumulation and risk regulation after a strong increase in Q1/2024 .
Low volatility, while prices remain above short-term holding costs, is a signal of structural stability in the market.

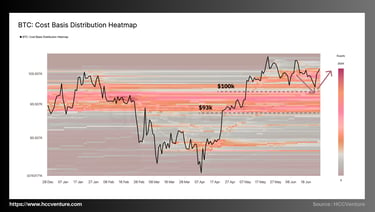
Bitcoin’s bullish market structure remains solid, with the $93,000–$100,000 supply zone acting as decisive structural support. The current price ($106k) is trading above the dominant cost basis zone , confirming that the holding sentiment continues to prevail.
The $93,000–$100,000 support zone has acted effectively, preventing the price from falling further according to the CBD Heatmap so far.
The $93k–$100k zone is currently the largest value allocation cluster in the entire 2023–2025 bull cycle structure , which is structurally decisive.
The strong rebound from the large supply zone shows that investors in the $93k–$100k price range are still maintaining a positive sentiment and are not selling massively when the price is close to the cost basis .
There are no signs of capitulation (panic selling) from holders in this cluster, proving that the market is still stabilizing its bullish structure.
In the context of price accumulation above a thick supply zone, this often leads to a "base-building" scenario before the next breakout.
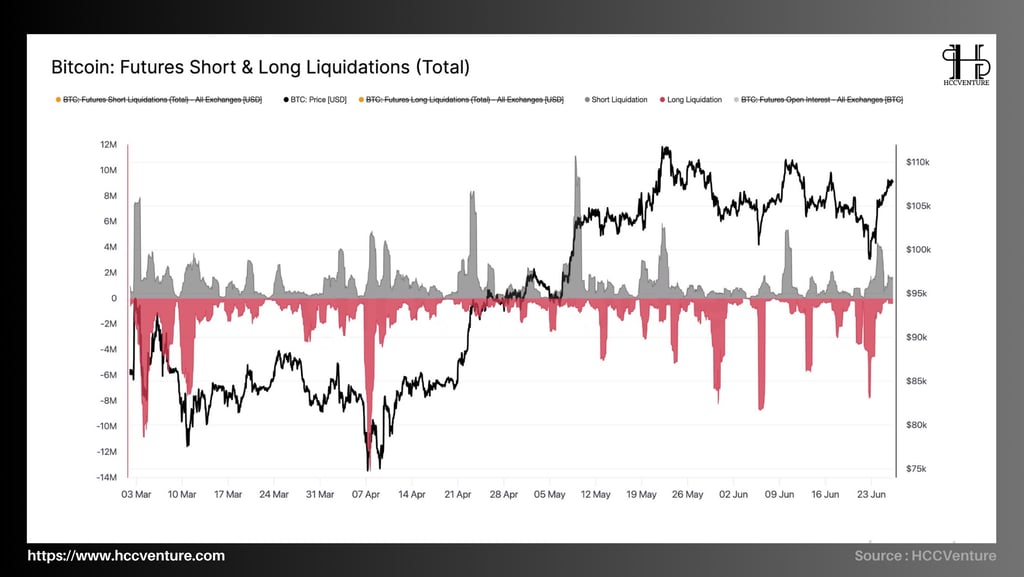
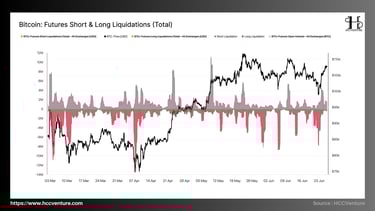
Last weekend's event was a 2-way "Leverage Flush", the market cleared both Long and Short positions.
BTC denominated OI drops to 334,000 BTC ( ↓ 7.2% in 24h)
OI before liquidation ~360,000 BTC
BTC price fluctuated from ~$106k to ~$99k then recovered , causing liquidation on both ends of the position .
OI in BTC decreased from 360,000 BTC → 334,000 BTC , equivalent to a drop of ~7.2% → confirming that liquidation was not only to cut losses, but also to close positions en masse to rebalance risks .
Large but balanced liquidation volume in both directions reflects an unstable speculative sentiment that is easily swept away by news.
The rapid drop in OI suggests that the market has just “reset” from an over-leveraged state .
Recent liquidation fluctuations have occurred with high frequency , but have not broken the main trend structure, showing a healthy regulation process.
This event marks the rebalancing of the futures market, reinforcing a more sustainable uptrend , as buying and selling power is re-established based on real capital flows instead of short-term leverage.
Evaluation and Conclusion
Bitcoin is currently trading range-bound in the $100,000 – $110,000 price range. Recent price movements have been driven largely by macro factors, geopolitical news, and short-term sentiment, rather than on-chain factors.
The cumulative supply heatmap (CBD) confirms the $93,000–$100,000 area as key structural support , with a large amount of BTC allocated in Q1/2025.
Signs of "fatigue" across the market when prices are anchored at high levels but on-chain activity is declining:
Realized Profit (30DMA) dropped sharply to below $1 billion/day, after a large profit-taking session in Q1/2024 – reflecting a slowing market sentiment after profit realization.
Transfer Volume (7DMA) has dropped ~32% from its late May peak, indicating weakening on-chain activity with no significant new inflows.
The STH-Cost Basis at ~$98,400 continues to act as psychological support, but the gap between the current price and this cost is no longer attractive enough to generate fresh speculative momentum.
Futures Open Interest (BTC-denominated) dropped from 360k BTC to 334k BTC (~7%) after double liquidation (long & short) – confirming the market is resetting the speculative leverage structure .
Although liquidity remains abundant on futures, funding rates are flat or slightly down , suggesting that derivatives investors are becoming cautious , avoiding over-exposure after the recent volatility.
Bitcoin remains in a bullish market structure as prices remain above the strategic support zone of $93k–$100k. However, on-chain indicators reflect an internal moderation: money flows are weakening, profits have largely been realized, and leverage is being deleveraged.
Disclaimer: The information presented in this article is the author's personal opinion on the cryptocurrency field. It is not intended to be financial or investment advice. Any investment decision should be based on careful consideration of your personal portfolio and risk tolerance. The views expressed in the article do not represent the official position of the platform. We recommend that readers conduct their own research and consult with a professional before making any investment decisions.
API & Data : Glassnode
Compiled and analyzed by HCCVenture
Join HCCVenture here: https://linktr.ee/holdcoincventure
See more analysis :
Explore HCCVenture group
HCCVenture © 2023. All rights reserved.


Connect with us
Popular content
Contact to us
E-mail : sp_contact@hccventure.com
Register : https://linktr.ee/holdcoincventure
Disclaimer: The information on this website is for informational purposes only and should not be considered investment advice. We are not responsible for any risks or losses arising from investment decisions based on the content here.

TERMS AND CONDITIONS • CUSTOMER PROTECTION POLICY
ANALYTICAL AND NEWS CONTENT IS COMPILED AND PROVIDED BY EXPERTS IN THE FIELD OF DIGITAL FINANCE AND BLOCKCHAIN BELONGING TO HCCVENTURE ORGANIZATION, INCLUDING OWNERSHIP OF THE CONTENT.
RESPONSIBLE FOR MANAGING ALL CONTENT AND ANALYSIS: HCCVENTURE FOUNDER - TRUONG MINH HUY
Read warnings about scams and phishing emails — REPORT A PROBLEM WITH OUR SITE.