


On-chain analysis week 25/2026: Long-standing supply is attempting to absorb more BTC
Bitcoin continues to move in a consolidation phase after the previous sharp correction, while demand remains present, with a group of large whales returning and accumulating at this price level.
PHÂN TÍCH
6/25/202611 min read
On-chain analysis week 25/2026: Long-standing supply is attempting to absorb more BTC
Bitcoin continues to move in a consolidation phase after the previous sharp correction, while demand remains present, with a group of large whales returning and accumulating at this price level.
Analysis • 25 June, 2026


Market Summary
Data from centralized exchanges shows that spot trading volume continues to decline and remains near its lowest levels in recent months. Taker buy volume weakened significantly after the recovery earlier in the month, reflecting a decrease in active buying demand from the market.
However, the current selling pressure mainly stems from portfolio rebalancing and short-term profit-taking rather than market panic. The Supply in Profit ratio remains around 70-75% , significantly higher than previous cyclical bottoms when this ratio typically fell below 55%.
Furthermore, the Realized Profit data continues to show realized profits at levels higher than the historical average. The fact that investors can take profits while prices remain stable suggests that the market is absorbing supply relatively efficiently rather than falling into a state of supply-demand imbalance.
Percent of Supply Last Active 1+ Years Ago continues to remain at historical highs , reflecting an increasing amount of Bitcoin being removed from short-term circulation and moved into long-term holdings. At the same time, Value Days Destroyed Multiple remains near low values, indicating that older coins have not yet been activated for distribution to the market.
US spot ETFs continued to record net outflows for several consecutive sessions, while ETF trading volume fell below the most recent quarterly average. Coinbase Premium also remained neutral to slightly negative, reflecting significantly weakening buying pressure from US institutional investors.
Furthermore, the rate of accumulation by businesses holding Bitcoin on their balance sheets has slowed significantly compared to the end of 2025, reducing one of the most important sources of demand that had supported Bitcoin's upward trend in the current cycle.
Analyzing on-chain metrics
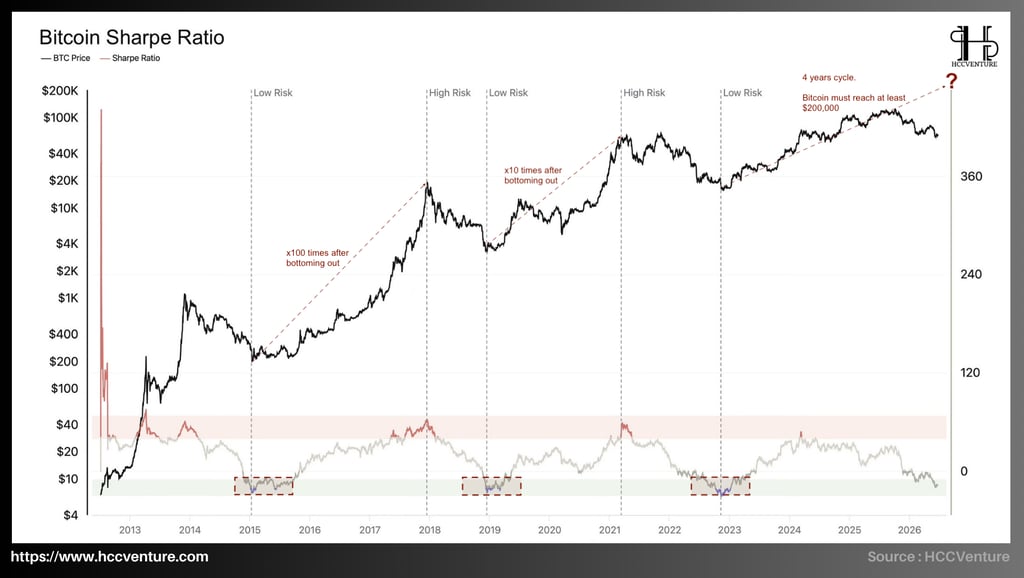
Bitcoin's Sharpe Ratio has sharply declined from high-risk zones in 2024–2025 to near the lowest point of the current cycle. It is returning to areas previously seen at the 2015, 2019, and 2022 cycle bottoms when Bitcoin experienced a 51% drop from its all-time high (ATH), reflecting a significant decline in speculative expectations and suggesting that Bitcoin's risk/reward ratio is becoming considerably more attractive than during the peak of the cycle.
Historical data from 2012 to the present shows that the Sharpe Ratio typically moves in distinct cycles. Peaks of the index often occur when Bitcoin prices grow too rapidly in a short period, pushing returns far outpacing the increase in risk . Currently, the Sharpe Ratio has once again returned to similar lows as in previous periods, with current valuations significantly lower than the average for the 2023-2025 period and fluctuating near areas that previously marked long-term accumulation points.
The " Low Risk " zones on the chart appear after periods of sharp price declines, when most short-term investors have been driven out of the market and speculative sentiment has significantly weakened. Current data suggests Bitcoin is returning to a similar state, with the Sharpe Ratio approaching its lowest point since the 2022 bottom, meaning the market is no longer euphoric or overvalued. Instead, Bitcoin is trading in a zone where history shows long-term rewards begin to outweigh short-term risks.
Simultaneously, the Long-Term Holder SOPR is approaching the break-even point while the Value Days Destroyed Multiple remains low, indicating a significant decline in distribution activity from long-term holders, consistent with past accumulation phases. This, coupled with the consensus between the Sharpe Ratio and other valuation indicators, reinforces the view that the market has undergone a strong rebalancing process in terms of valuation and sentiment.

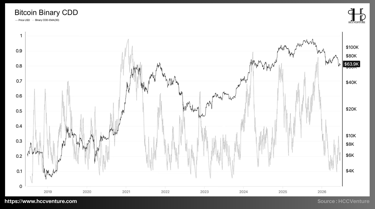
Historically, Bitcoin bull cycles often end when Binary CDD (Price-to-Deposit Ratio) remains high for an extended period, reflecting long-term investors beginning to realize large-scale profits. Conversely, Binary CDD downturns typically occur when distribution ends, supply returns to an accumulation phase, and structural selling pressure gradually decreases.
Observing the 2024–2025 cycle reveals that Binary CDDs consistently experience spikes when Bitcoin enters the price range of $80,000 to over $100,000 . This is the period when long-standing coins are reactivated after years of inactivity, reflecting profit-taking by investors holding large supply.
In recent months, Bitcoin's price has fallen more than 51% from its cycle peak, but Binary CDD has not seen a corresponding increase in selling activity from long-term holders . The majority of BTC held by long-term holders has already completed its distribution during the previous high price phase, rather than continuing to sell off during the current correction.
A notable characteristic of Binary CDD is that the index often drops sharply after the market completes a significant portion of the supply redistribution process. At that point, long-standing coins stop moving and return to a holding state. Currently, Binary CDD is fluctuating around the historical lows of the current cycle , significantly lower than the peaks recorded in 2024 and 2025, indicating a sharp decline in the proportion of long-standing supply entering the market.
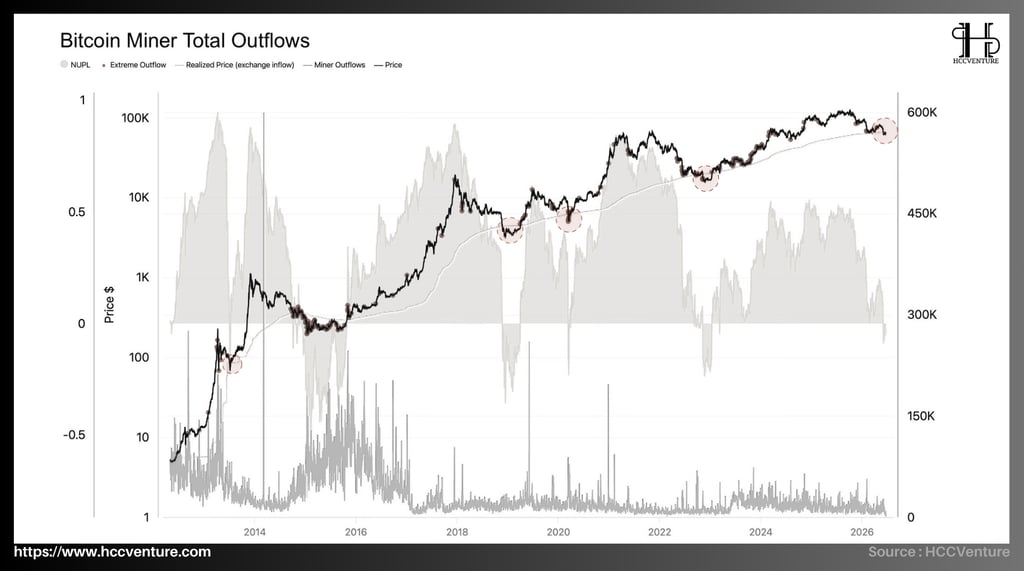
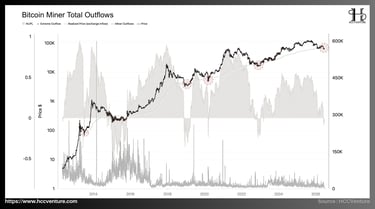
Miner Total Outflows indicates decreasing selling pressure from miners after a sharp correction. This indicator only appears when the market enters periods of significant volatility, especially during times of declining mining profitability or sharp correction cycles after peaking. During the sharp corrections of 2018 and 2022, financial pressure forced many miners to liquidate their BTC reserves to maintain operations, often accompanied by a noticeable increase in Miner Outflows before or during deep market downturns.
Conversely, current data suggests that miner behavior is significantly more stable. Following the 2024 halving, although revenue in BTC decreased by 50%, the sustained high price of Bitcoin helped revenue converted to USD continue to support mining operations . As a result, the forced selling pressure from miners did not increase significantly. The fact that miner outflows remained low while prices corrected sharply indicates that most large miners still possess sufficiently strong balance sheets to maintain operations without liquidating large amounts of BTC holdings.
Following the April 2024 halving, the daily BTC issuance decreased from approximately 900 BTC to around 450 BTC. At a price around $64,000, this new supply is equivalent to approximately $28-30 million per day, significantly lower than the billions of dollars traded in the spot and derivatives markets. This means the direct impact of miner supply on the overall market supply and demand structure continues to decline. Current Miner Outflows data confirms that the new supply is being absorbed relatively efficiently and has not yet created enough selling pressure to alter the long-term market trend.
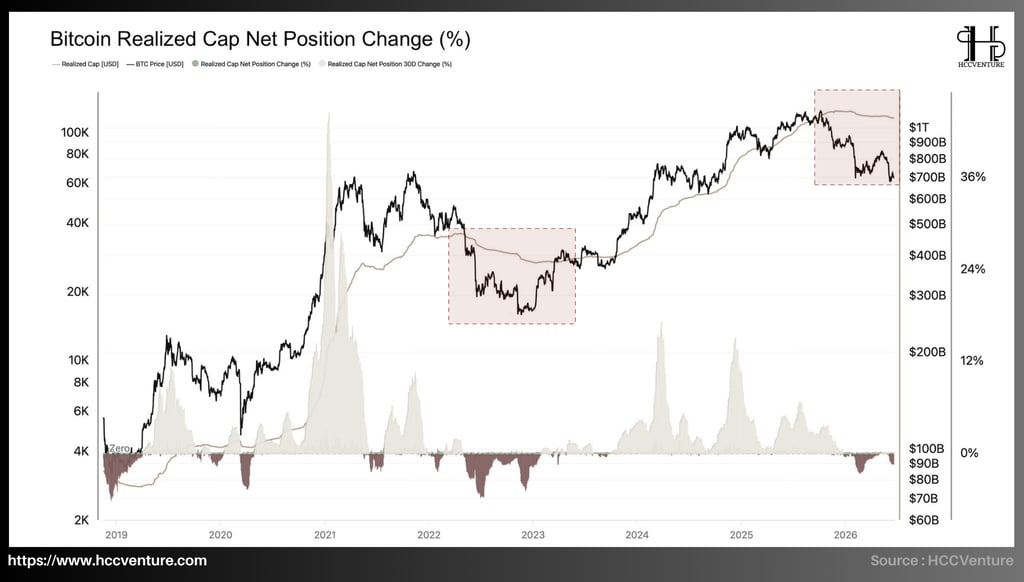
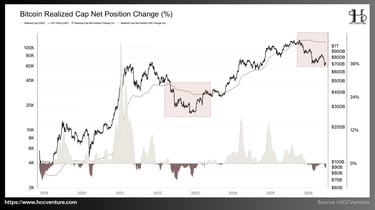
Observing the chart reveals that during the strong growth phase from late 2023 to the end of Q3/2025, Realized Cap increased from approximately $450 billion to over $950 billion. This represents the strongest capital absorption period since the 2020–2021 cycle, reflecting the influx of spot ETF capital, financial institutions, and large-scale individual investors.
However, since Bitcoin set a new all-time high, the rate of expansion of the Realized Cap has begun to slow down significantly. The Realized Cap line has been nearly flat around the $950-$980 billion range for several consecutive months, indicating that the accumulation of new capital is slowing down. Notably, this weakening is similar to the period between mid-2021 and early 2022 when the market entered a prolonged correction phase. At that time, the Realized Cap also stopped expanding before Bitcoin entered a deeper bear market.
Although net capital flows are currently negative, the scale of the decline is significantly smaller than previous cyclical lows. During the 2022 bear market, this indicator consistently remained in deep negative territory for several consecutive quarters as Bitcoin fell from $69,000 to below $16,000. Currently, the decline is more of a corrective cash flow correction than a full-blown capital flight.
Another important indicator is that the Realized Cap has barely declined despite Bitcoin's price correcting by over 40% from its cycle peak. Historically, true bear market phases are usually accompanied by a significant drop in Realized Cap as investors sell off and accept losses on a large scale.
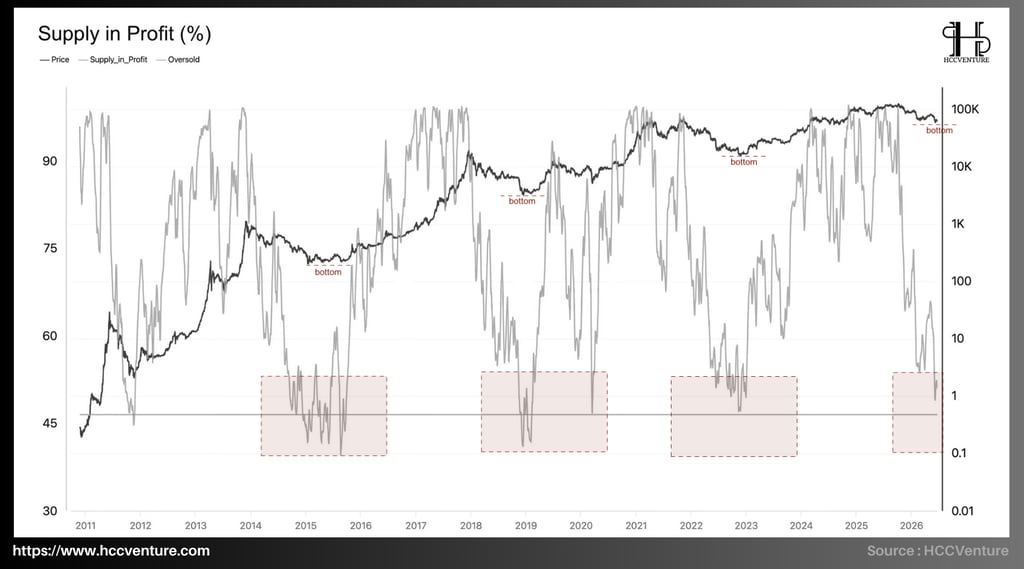
Supply in Profit has now fallen to around 45-50% , equivalent to the bottom of major correction cycles in Bitcoin's history. Compared to over 95% at the peak of the cycle, the current decline reflects a strong revaluation process and a localized capitulation by a large segment of investors who participated at high prices.
Historically, whenever Supply in Profit entered the 45-50% range, the market typically entered the final stage of a correction. The lows of 2015, 2018, and 2022 all occurred when the profitable supply ratio fell below 50% before gradually recovering. Currently, the index is returning to the exact valuation range that marked key supply absorption points in the past. Much of the BTC purchased at high prices has been absorbed by the market through the prolonged correction, helping to re-establish a more sustainable profit base for the next cycle.
Although psychological pressure persists with nearly half of the circulating supply no longer maintaining profitability, historical data suggests this is often the area where long-term downside risk begins to significantly weaken. More importantly, the current correction is bringing the market's yield structure back to areas where medium-term bottoms were formed in the past. From an on-chain valuation perspective, the Supply in Profit falling to the 45-50% range means that nearly half of the circulating supply is no longer maintaining profitability. Historically, this is often the area where assets are transferred from weaker investors to entities with more long-term confidence.
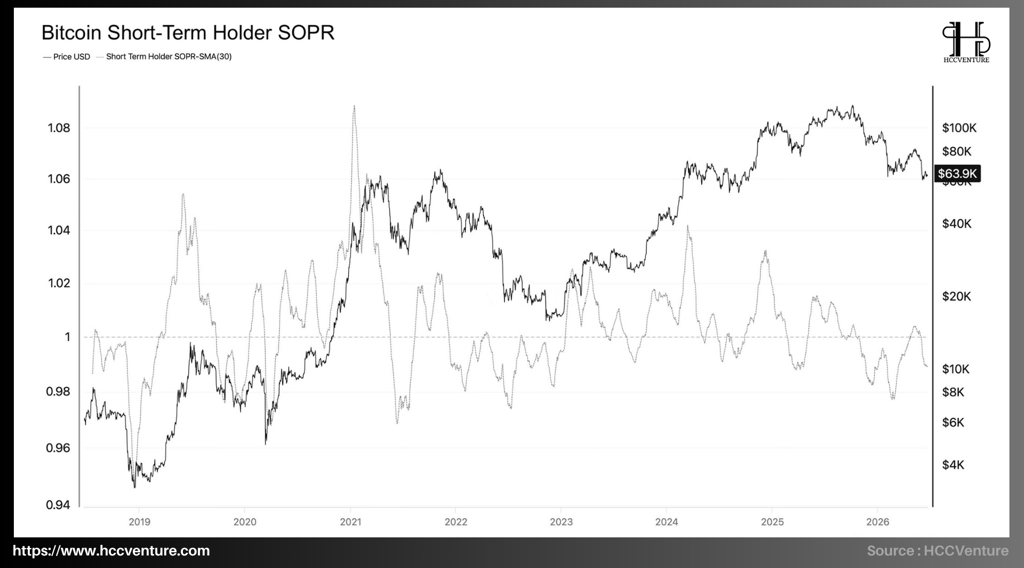
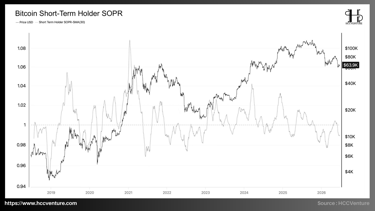
Short-Term Holder SOPR data shows that short-term investors are still under significant financial pressure as the majority of on-chain trading continues to occur below cost. The fact that the index remains around 0.99 and has not yet stabilized above 1 reflects that the process of realizing losses is not yet fully complete.
One of the key features of STH-SOPR is its ability to identify when speculative selling pressure is fully absorbed. In previous cycles, a sustained recovery typically only began when the index broke back above 1 and remained stable for an extended period.
Currently, although Bitcoin has recovered from its lows near $60,000, STH-SOPR has yet to establish a sustainable uptrend above the break-even point; recent recoveries are mostly technical rather than reflecting a strong return of new capital.
The continuous rejection of the index around the 1 level indicates that supply from late-cycle buyers is still putting pressure on the market. Each rebound becomes an opportunity for some investors to exit their positions , weakening the growth momentum. Compared to historical capitulation phases, the intensity of stop-loss selling has decreased significantly, suggesting that much of the weak supply has been cleared from the market. However, the absence of a sustained recovery above the break-even point confirms that demand is still not strong enough to create a new profit-taking cycle.
Research and Analysis
Market Summary
Analyzing on-chain metrics
Bitcoin ETFs Drawdown From ATH
Bitcoin Long-Term Holder SOPR
Bitcoin MVRV Ratio
Bitcoin Net Unrealized Loss
STH Realized Price
Multiple Girl
Bitcoin Spot Volume Bubble Map
Bitcoin Supply in Profit %
STH Whale Unrealized Profit/Loss
Value Days Destroyed Multiple
Assessment and Conclusion
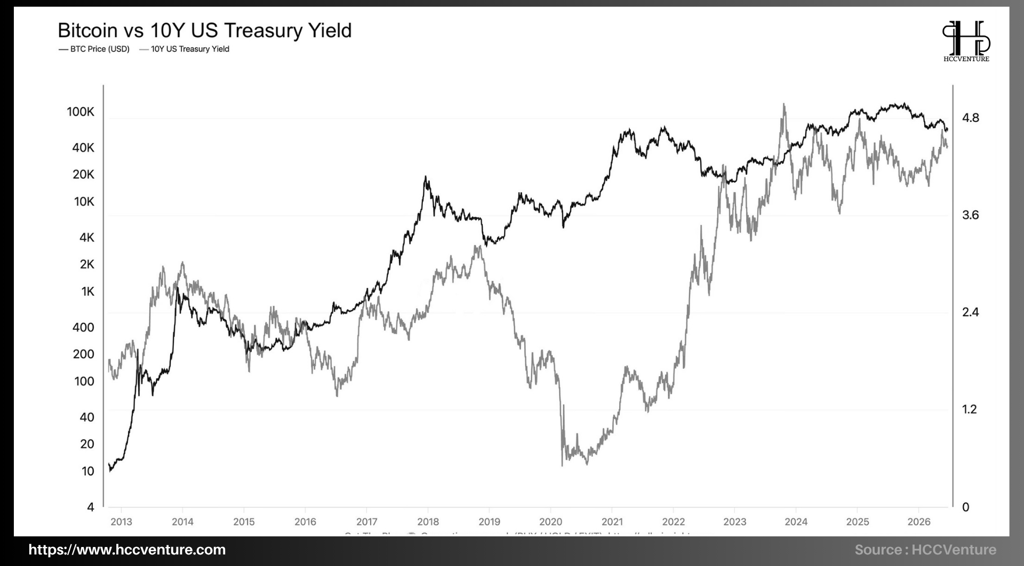
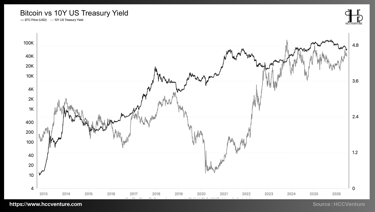
The yield on 10-year US Treasury bonds (US 10Y Treasury Yield) is one of the most important macroeconomic variables for global risk assets. Since 2022, the US Federal Reserve (Fed) has implemented its strongest monetary tightening cycle in over four decades to control inflation. As a result, the 10-year yield has risen from below 1.5% to around 4.8%, equivalent to an increase of over 220% , setting a new high since 2007.
Typically, such a high-yield environment would put significant pressure on risky assets. However, Bitcoin is currently maintaining a price more than six times higher than its 2022 cycle low and significantly higher than the average price range of the entire previous cycle.
History shows that Bitcoin's strongest growth periods typically occur when real yields fall or the Fed enters an easing cycle. Currently, nominal yields remain near their cyclical highs, meaning global capital costs haven't truly fallen. The market is trying to understand why Bitcoin, despite experiencing several strong recovery phases, has yet to stabilize above its historical peak. Speculative capital flows and new liquidity are still being affected by persistently high interest rates, causing market capitalization expansion to be slower than in previous cycles.
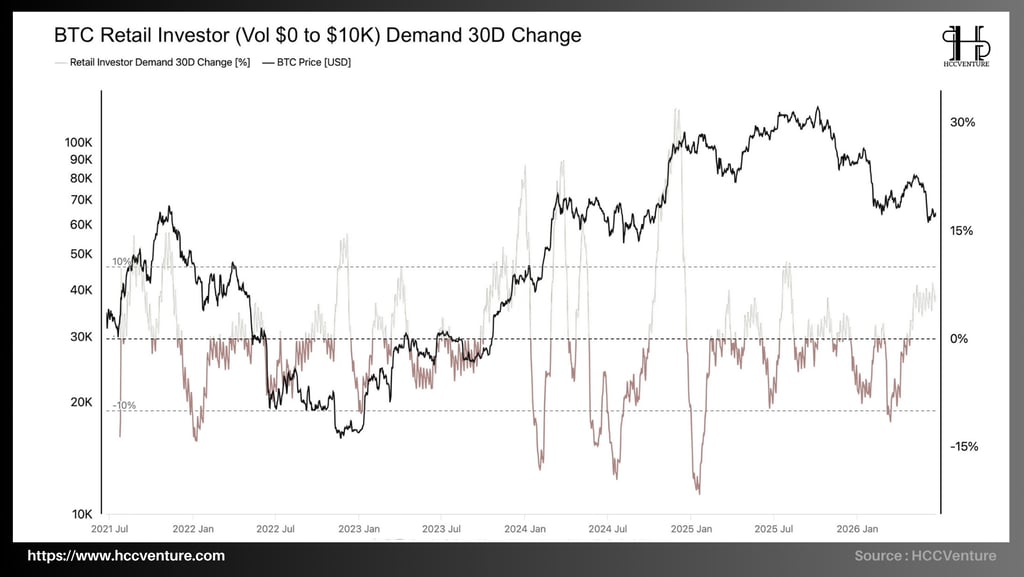
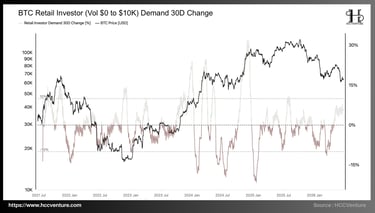
The BTC Retail Investor Demand 30D Change indicator shows that demand from retail investors has begun to recover after a prolonged period of decline, with growth shifting from deep negative territory to positive territory of approximately 4–6%. This reflects decreasing selling pressure from individual investors and the emergence of new accumulation activity around the $60,000-$65,000 price range.
A notable aspect of the current cycle is the clear divergence between the behavior of institutional and individual investors. While previous cycles often saw a surge in retail selling as prices approached their peaks, the current cycle is primarily driven by spot ETFs, investment funds, and financial institutions.
The fact that retail demand has remained largely neutral for most of the period from late 2025 to the present suggests that the market has not yet experienced widespread FOMO (fear of missing out). This is also why recent rallies have lacked the surge in spot liquidity and trading volume seen in previous strong growth phases. In fact, compared to previous cyclical lows, retail investors are not yet participating strongly enough to create a new wave of demand capable of fully absorbing the supply from large investors and long-term holders. This makes Bitcoin's recovery more technical than a comprehensive demand expansion cycle.
On the positive side, the market is no longer experiencing a decline in demand at the same rate as previous periods of strong capitulation. However, the current recovery remains localized and not strong enough to confirm the return of large-scale speculative capital flows. Historically, however, the current recovery is still significantly lower than the boom periods that propelled Bitcoin to previous cyclical peaks. Retail demand has not yet returned strongly enough to act as a major driver for a new growth trend.
Our assessment and conclusions
Valuation data shows that most profitability indicators and market sentiment have returned to significant discount zones compared to the peak of the cycle. The MVRV Ratio is currently fluctuating around 1.2 times, much lower than the historically overheated zones of 3.5-4.0 times that typically appeared before long-term market peaks. Simultaneously, the NUPL has sharply declined to the 0.1 region, reflecting that a significant portion of the market's unrealized gains have been erased during the correction. This valuation zone typically appears during re-accumulation phases or at the end of major corrections, rather than at cyclical peaks.
From an investor behavior perspective, SOPR data shows that both Short-Term Holders and Long-Term Holders are operating near the break-even point. The Short-Term SOPR has consistently fluctuated around 1.0, while the Long-Term SOPR has fallen below 1 at several recent times, reflecting a significant decline in profit realization. This suggests that profit-taking pressure from long-term holders is gradually decreasing after the distribution period that lasted from late 2025 to early 2026. When realized profits decline but the price remains above the Realized Price of the entire network, the market typically shifts to an absorption phase rather than continuing large-scale distribution.
One of the most important signals comes from Binary CDD and VDDM. Both indicators show that the movement of long-term supply is significantly lower than the historical peaks of 2017, 2021, and the euphoric period in early 2025. This confirms that long-term investors have not yet carried out the extreme distribution process typically seen at the peaks of the last cycles. In other words, strategic supply is still being held back rather than being released onto the market in large quantities.
Although short-term demand momentum remains relatively weak, particularly from retail investors and speculative capital flows, fundamental data suggests that the long-term accumulation structure is being maintained. Selling pressure from long-term holders continues to diminish, supply tends to be locked in long-term wallets, and the actual amount of capital residing in the network remains near historical highs.
Disclaimer: The information presented in this article is the author's personal opinion in the field of cryptocurrencies. This is not financial or investment advice at all. Every investment decision should be based on careful consideration of your personal portfolio and risk tolerance. The opinion in the article does not represent the official position of the platform. We recommend that readers do their own research and consult experts before making any investment decisions.
API & Data: Glassnode
Synthesized and analyzed by HCCVenture
Join the HCCVenture organization here: https://link3.to/holdcoincventure
Explore HCCVenture group
HCCVenture © 2023. All rights reserved.


Connect with us
Popular content
Contact to us
E-mail : sp_contact@hccventure.com
Register : https://linktr.ee/holdcoincventure
Disclaimer: The information on this website is for informational purposes only and should not be considered investment advice. We are not responsible for any risks or losses arising from investment decisions based on the content here.

TERMS AND CONDITIONS • CUSTOMER PROTECTION POLICY
ANALYTICAL AND NEWS CONTENT IS COMPILED AND PROVIDED BY EXPERTS IN THE FIELD OF DIGITAL FINANCE AND BLOCKCHAIN BELONGING TO HCCVENTURE ORGANIZATION, INCLUDING OWNERSHIP OF THE CONTENT.
RESPONSIBLE FOR MANAGING ALL CONTENT AND ANALYSIS: HCCVENTURE FOUNDER - TRUONG MINH HUY
Read warnings about scams and phishing emails — REPORT A PROBLEM WITH OUR SITE.