


On-chain analysis week 25 / 2025: Distribution signs, Bitcoin correction?
The sharp decline in Bitcoin network activity metrics, coupled with the concentration of value in the hands of large entities, is clear evidence of a period of quiet but intentional distribution.
6/23/202510 min read
Market Summary
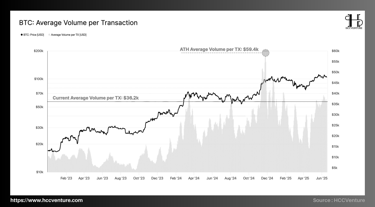
Retail and mainstream trading activity has all but disappeared from the network as the 7-day average transaction volume has dropped to ~ 235,000 TX/day , 32% below the March 2024 cycle peak (~346,000 TX/day). This is a low comparable to the recession period after the 2021–2022 bull run.
The current average value per transaction is just around $36,200/TX, 2.1 times higher than the historical average for the period 2020–2022. The remaining transactions are mainly from large-value entities – institutional groups, funds, whales, or long-term asset management addresses.
Compared to previous strong growth periods like Q1/2021 or Q1/2024, the fee spiked to $30–60/tx due to high blockspace demand → currently there is absolutely no congestion. There is no pressure to use the network. The current high price does not come from actual on-chain demand , but mainly from price increases on CEX/Futures exchanges .
Financialized speculation has completely replaced the blockchain's native value transfer function. This is a common premise in market top distribution cycles.
Bitcoin price is being kept high by derivatives leverage and activity from large entities , while real money, network and public participation are in sharp decline . Is this whale distribution? Let's take a look at on-chain indicators in the Bitcoin network.
On-chain metrics analysis
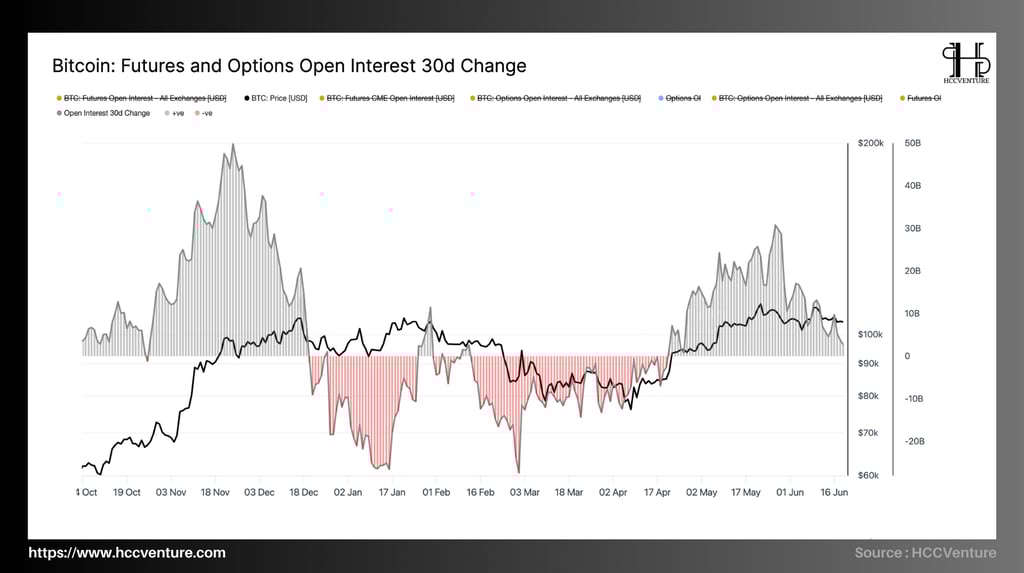

Although BTC price still maintains the $99,000–103,000 range, the slowdown in the Open Interest index's upward momentum shows that new money is no longer strongly participating in the derivatives market.
In the last 30 days, the total Open Interest (OI) value on Bitcoin futures and options contracts has recorded a sharp decline again , after peaking in late May.
According to the chart, the 30d Change in OI is clearly back in negative territory (above -10 billion USD), reflecting a large-scale pullback from leveraged positions in the derivatives market.
Since the beginning of April 2024, OI has continuously increased dramatically due to the influence of capital inflows through spot ETFs in the US.
However, the most recent correction in June shows an organized distribution phase , as institutional investors and whales gradually reduced their exposure to futures/options positions. This is confirmed by:
Total Futures OI dropped from ~$37 billion to below $30 billion as of mid-June.
BTC price still holds the $64,000–$66,000 range but no longer has an increasing correlation with OI, reflecting the loss of growth momentum from the derivatives market .
Funding rates are gradually returning to neutral territory after a long period of high positive levels, confirming a clear decline in speculative sentiment (average funding rate is 0.004%, down 60% from the May peak).
Bitcoin is entering a short- to medium-term distribution phase , with a deliberate pullback from institutional investors and risk rebalancing after the ETF-fueled rally.
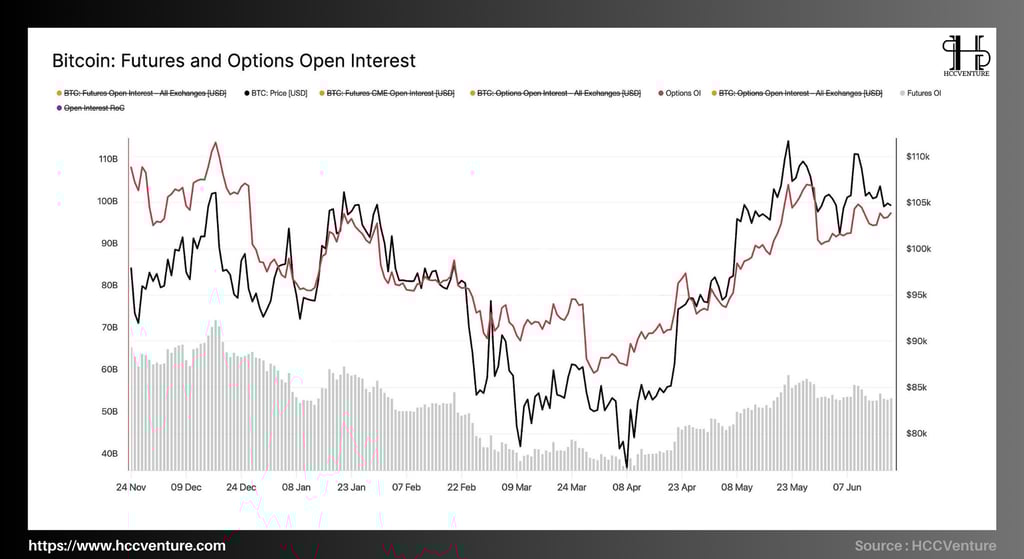
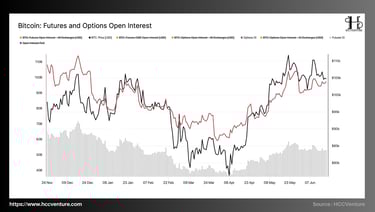
The total Open Interest (OI) value of the Bitcoin derivatives market is maintaining at a historical high , clearly reflecting the systematic accumulation of leverage in the market structure. Specifically:
Futures OI : Increased from ~$7.7 billion (2020) to a peak of ~$52.8 billion in early June 2025. Currently still hovering around $46–48 billion.
Options OI : Recorded outstanding growth from ~$3.2 billion to $43.4 billion , a historical record high.
In total, total OI from the derivatives market remains above $96 billion , higher than the 2021 peak amid a weakening spot market in terms of trading volume.
Data on the chart from HCCVenture demonstrates that BTC Price has been trending lower highs since June, while Options OI (red line) remains in the high zone.
This divergence shows that leverage is being kept high but prices are no longer responding positively , reflecting a disbelieving rally or price being manipulated by derivative structures rather than real demand in the spot market.
In particular, the Open Interest Rate of Change (RoC) index – which indicates the speed of leverage accumulation – has been decreasing since the beginning of June, indicating that new money is no longer pouring in , while the current OI is largely from previously open positions.
Bitcoin may be entering a large-scale institutional distribution phase as confirming signs include:
Leverage accumulation peaked , as total derivatives OI exceeded $96B.
Negative divergence between BTC price and OI , reflecting price manipulation and exhaustion of real demand.
OI RoC is weakening , warning of liquidity risk.
Spot volume decreased >35% compared to May , showing a decrease in speculative cash flow.
Leverage expansion without new money flows or sustained price growth is a classic signal preceding sharp corrections or top distributions .
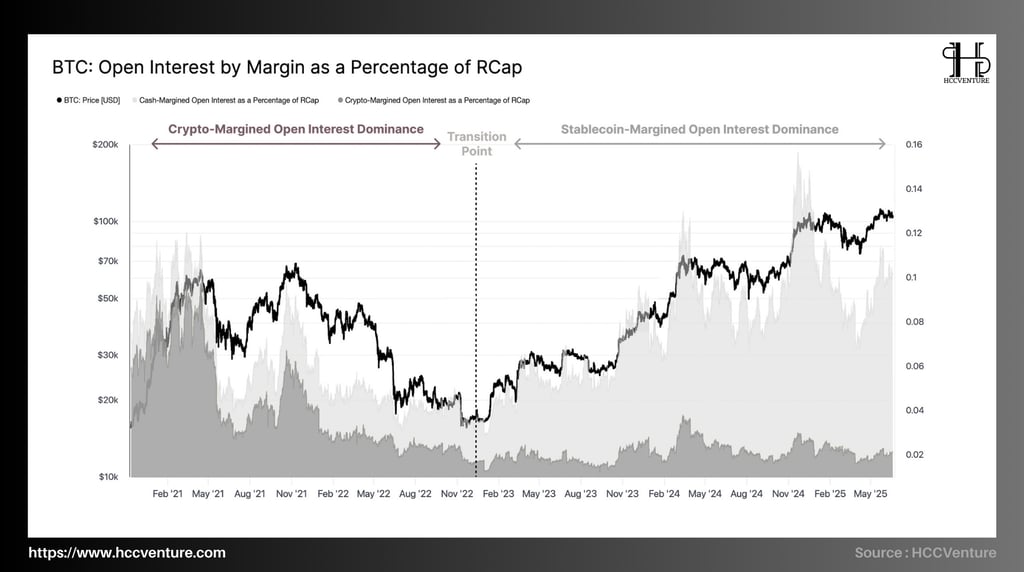
Chart from HCCVenture showing Open Interest (OI) by margin type compared to Realized Cap (RCap) – Bitcoin's real market capitalization.
Since late 2022, the market has witnessed a clear shift from Crypto-Margined Open Interest (using BTC as a collateral asset - which is prone to chain liquidation due to compound interest effects) to Stablecoin-Margined Open Interest.
Leverage Ratio (OI/RCap) is currently at 10.2% , above its long-term average (6.3%), and only 10.8% of trading days in history have recorded a higher level.
→ An extremely high level of leverage accumulation , reflecting the dominance of speculative positions rather than real cash flows from the spot market.
Since “Transition Point” in late 2022, the majority of OI today (~72%) is from Stablecoin-Margined contracts .
While this helps control risk more than crypto-margined, it also shows that the market is being driven entirely by short-term, liquid leveraged trading , not tied to long-term expectations.
Although OI increased sharply, BTC price only fluctuated within a narrow range , with many times creating lower peaks , showing that leverage was "stuck" in the high area without new cash flow large enough to push the price up .
Beware of “false breakouts”. High leverage increases volatility but does not necessarily mean a clear trend. Risk management is a top priority.
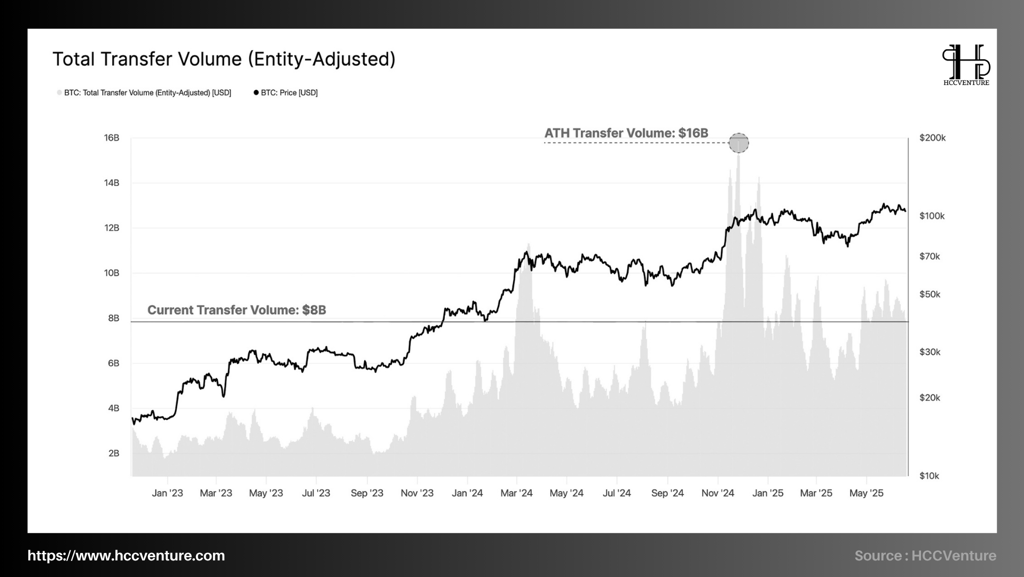
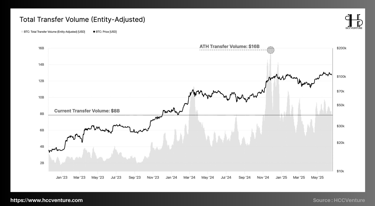
Total Transfer Volume (Entity-Adjusted) is a measure of the total USD value transferred across the Bitcoin network, adjusted to exclude internal transactions between wallets of the same entity (Entity-level adjustment). Specifically:
Current Transfer Volume ~ $8B/day.
Average last 12 months ~$7.5B/day.
Historical Peak (ATH Transfer Volume) ~ $16B/day
While BTC price remains above the ~$100,000 region, internal network transaction volume has dropped 50% from its peak , demonstrating a severe divergence between price and network activity .
Considering the factor of price divergence compared to volume:
Prices remain high , hovering between $98k–$104k for the past 2 months.
Volume decreased significantly , from $14B to $8B, a decrease of nearly 43%.
If the price drops slightly, it will easily trigger an auto-deleveraging wave due to the overlapping leverage structure (analyzed in the previous article).
The fact that the price is high but the network volume is low also reflects that the market is in a "suspended" state, easily collapsing when losing technical support.
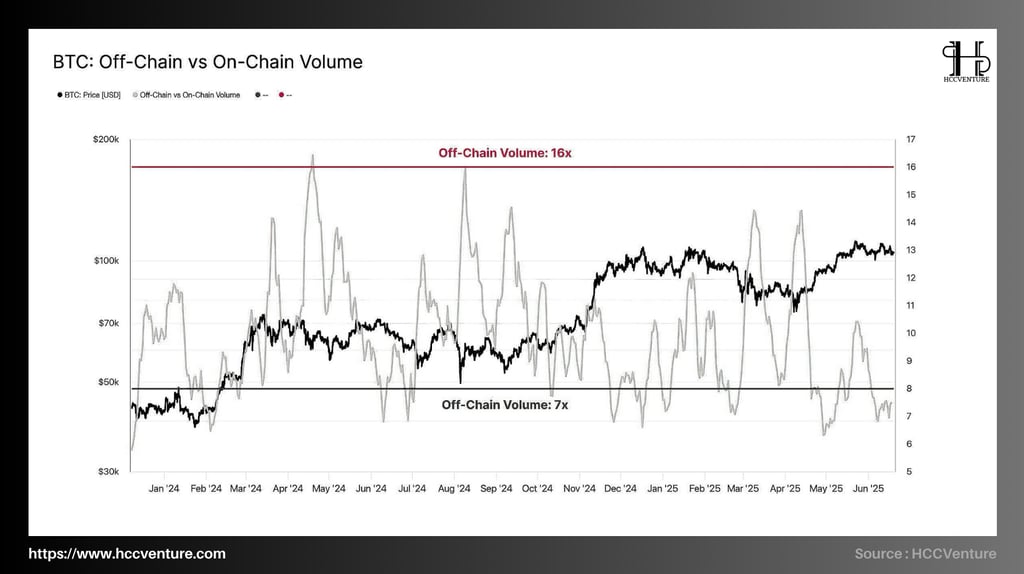
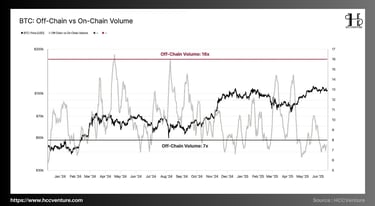
The current Off-Chain Volume / On-Chain Volume ratio is 8.5x , meaning that off-chain transaction volume is 8.5 times greater than the actual value transfer activity on the Bitcoin network.
During the 2023–2025 cycle, this ratio fluctuates within a range of 7x – 16x .
During healthy growth phases, the ratio stays around 5–8x.
However, ratios above 10x often appear at cycle peak distributions (Q4/2021, Q4/2024).
At the current 8.5x and recent uptrend, the market is returning to a highly speculative state of operation , with much of the money flow no longer tied to real value transfers.
Speculative money flow (FOMO) is increasing strongly , users prefer to use futures/options leverage to seek quick profits, instead of making transactions with real economic meaning (on-chain).
Pumping and shoving occurs , especially when centralized exchanges control the majority of liquidity, making it easy to manipulate price sentiment.
When off-chain volume exceeds 10x, on-chain activity becomes less representative of the entire market , leading to the risk of bias in macro assessments when using only traditional on-chain data.
However , on-chain is still the foundation layer that determines the capital flow structure since deposit/withdrawal transactions from exchanges, OTC desks, or spot ETFs must all be done through the root network .
So, if on-chain volume is flat or decreasing , while off-chain volume is increasing, we are witnessing a phase shift from accumulation to distribution.

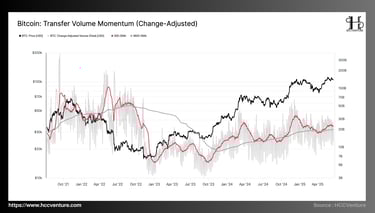
While BTC price has surpassed the psychological mark of $100k, even approaching the old peak, the momentum of the transfer money flow is clearly weakening , shown by the 30-day average line starting to curve down. Specifically:
Transfer Volume (30D-SMA) ~22.3 billion USD/day
Transfer Volume (365D-SMA) ~20.7 billion USD/day
Latest 30D-SMA Transfer Volume Peak ~31.2 billion USD/day (March 2025)
Distance from ATH Volume (2021) is decreasing by ~55%
From March 2025 to present, BTC price continues to create new peaks , however, the Transfer Volume indicator (30D SMA) does not increase in consensus , on the contrary, it is on a downward trend.
→ One of the bearish divergence signals between price and real money flow , often appears in market top distribution phases.
Although spot/futures volume is increasing, most of the cash flow is not reflected on-chain , meaning the market operates mainly based on internal exchange capital flows, without large deposits and withdrawals.
This makes the Transfer Volume index unable to increase accordingly – reflecting the level of "price increase without support from cash flow" .
The cash flow structure is completely dominated by large transactions (> $1M), while small cash flows (under $100k) – representing mainstream demand – are severely weakened.
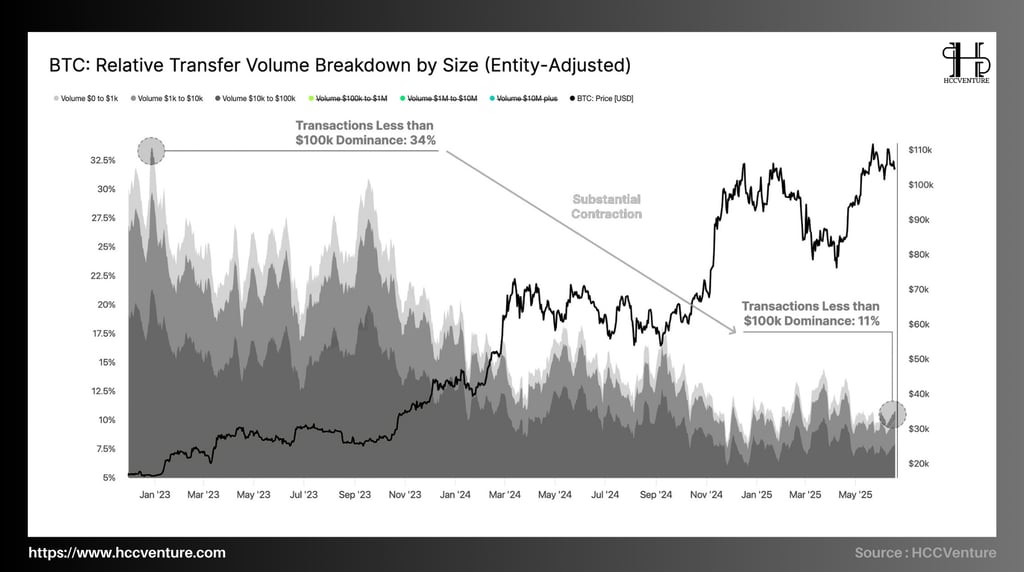
The across-the-board decline across the small- to mid-cap group represents a structural contraction in retail and mid-cap investor behavior – components that typically represent “fresh,” speculative money and reflect mass market strength.
The trading volume of the $0-$1k group ranges from 3.9% to 0.9%
The trading volume of the $1k-$10k group ranges from 8.4% to 2.1%
The trading share of the $10k-$100k group ranges from 21.4% to 7.9%
The steady and systematic decline in <$100k transactions , spanning from early 2023 to mid-2025, is a signal that:
Retail investors have withdrawn from the market .
The presence of speculative money has almost disappeared from the network.
The retail transaction rate is the lowest in 3 years , now accounting for only 11% of total cash flow , compared to 34% at the previous peak (12/2022) - a reduction of 67.6% in proportion.
In contrast, the proportion of transactions above $1M (ETF, whale, OTC desk) increased sharply above the 65% mark , showing that the network is almost completely dominated by large organizations.
This is a form of "liquidity vacuum" : big fish manipulate volume in the absence of countervailing liquidity from small groups , paving the way for discreet distribution behavior .
In late 2021, the market also recorded a similar pattern when retail money withdrew , leaving most of the market for institutional groups and whales, leading to a collapse that lasted 1 year later.
Investment strategies at this stage require extreme caution. The high price does not reflect intrinsic strength, but comes from distorted liquidity and institutional cash flow control.

Bitcoin is losing its “permissionless retail asset” status and transitioning into a payment/pricing tool for large transactions only .
AVPT increases but number of transactions decreases – Warning of risk of cash flow concentration
Although the number of network-wide transactions has been steadily decreasing since Q1/2025 (≈ -14.7% YoY), the average value per transaction has reached an unusually high level: $36.2k , far exceeding the first phase of 2023 (≈ $17k).
Small investors (retail) have almost withdrawn from the market.
The network is currently used mainly by large entities (whales, institutions, ETFs).
In previous cycles (comparing 2021), periods of strong average transaction value growth while total transaction volume declines have typically coincided with periods of wealth distribution:
New money flow weakens → no real demand to support.
Institutions sell large amounts in low liquidity conditions → keeping prices high to maximize profits .
Evaluation and Conclusion
In contrast to the price growth trend, on-chain metrics show a completely opposite picture – the network is falling into a state of “absence of real liquidity” , also known as an “on-chain Ghost Town” .
On-chain transaction count – down more than 30% from the peak of the Q1/2024 growth period (~348,000 TX/day). The main reason comes from the decrease in non-monetary TXs – including inscription, token-anchoring, Ordinals activities…
Despite the decrease in transaction volume, the remaining transactions were large in size , establishing clear institutional and whale dominance on the network as Daily Net Settlement Volume was ~16% higher than the previous cycle average.
The decrease in quantity but sharp increase in transaction value confirms the dominant role of large liquidity entities (institutions, investment funds, long-term whales) in dominating on-chain activities.
Real money flows are not accompanied by current prices . The lack of network usage pressure despite high prices reflects the unreality of the price momentum , with the potential for correction or distribution.
All quantitative data shows a clear distribution trend from large entities , taking place in the context of: Bitcoin is overvalued but network activity is weak ; real liquidity is decreasing ; leverage is increasing sharply while long-term addresses are selling ; money flows are moving to CEX exchanges to "package" short positions.
This is a hallmark of a peak distribution phase in the risk asset market , disguised by false stability from the derivatives market.
Disclaimer: The information presented in this article is the author's personal opinion on the cryptocurrency field. It is not intended to be financial or investment advice. Any investment decision should be based on careful consideration of your personal portfolio and risk tolerance. The views expressed in the article do not represent the official position of the platform. We recommend that readers conduct their own research and consult with a professional before making any investment decisions.
API & Data : Glassnode
Compiled and analyzed by HCCVenture
Join HCCVenture here: https://linktr.ee/holdcoincventure
Explore HCCVenture group
HCCVenture © 2023. All rights reserved.


Connect with us
Popular content
Contact to us
E-mail : sp_contact@hccventure.com
Register : https://linktr.ee/holdcoincventure
Disclaimer: The information on this website is for informational purposes only and should not be considered investment advice. We are not responsible for any risks or losses arising from investment decisions based on the content here.
TERMS AND CONDITIONS • CUSTOMER PROTECTION POLICY
ANALYTICAL AND NEWS CONTENT IS COMPILED AND PROVIDED BY EXPERTS IN THE FIELD OF DIGITAL FINANCE AND BLOCKCHAIN BELONGING TO HCCVENTURE ORGANIZATION, INCLUDING OWNERSHIP OF THE CONTENT.
RESPONSIBLE FOR MANAGING ALL CONTENT AND ANALYSIS: HCCVENTURE FOUNDER - TRUONG MINH HUY
Read warnings about scams and phishing emails — REPORT A PROBLEM WITH OUR SITE.