On-chain analysis week 24/2026: Expectations amidst panic from STH
Bitcoin experienced one of the sharpest corrections of the current cycle, with the price falling from above $74,000 to near $60,000 before short-term buying absorbed the dip.
PHÂN TÍCH
6/16/202611 min read
On-chain analysis week 24/2026: Expectations amidst panic from STH
Bitcoin experienced one of the sharpest corrections of the current cycle, with the price falling from above $74,000 to near $60,000 before short-term buying absorbed the dip.
Analysis • 16 June, 2026


Market Summary
The AVIV Z-Score indicator dropped to a low of -1.09 before recovering slightly to -1.06, signaling one of the lowest levels since the market entered its current bull cycle and placing it deep within the undervalued zone relative to its cyclical fair value. At the AVIV point, the strong money indicator entered deep discount territory, Bitcoin's price failed to generate a significant rebound from the $60,000 area, a selling pressure that eased but new demand was not strong enough to trigger a positive revaluation.
Data on Short-Term Holders (STH) shows that market vulnerability has increased significantly, with the percentage of profitable STH supply recovering only slightly to around 3.3%, much lower than the 4-year average of around 55%. With the majority of new investors currently experiencing losses, any negative shock to liquidity or the macroeconomic environment could trigger further selling pressure from this group.
Simultaneously, Realized Loss indicators recorded a sharp increase in the volume of realized losses, with many trading sessions recording actual losses reaching billions of USD, reflecting a widespread position liquidation process, a signal that often appears in the final stages of a major correction as weaker investors are gradually eliminated from the market.
One of the most concerning points right now is the marked decline in institutional demand in the United States. The Coinbase Premium continues to remain in negative territory as Bitcoin falls to $60,000, indicating that institutional investors using Coinbase are not buying aggressively as they did during previous correction phases.
Although leverage structures have been re-established and many pricing indicators have become significantly more attractive than during the peak of the cycle, the market has yet to show strong enough demand signals to absorb supply and initiate a new uptrend. Therefore, the current context is more consistent with a prolonged bottoming phase following capitulation rather than a confirmed bullish reversal.
Analyzing on-chain metrics
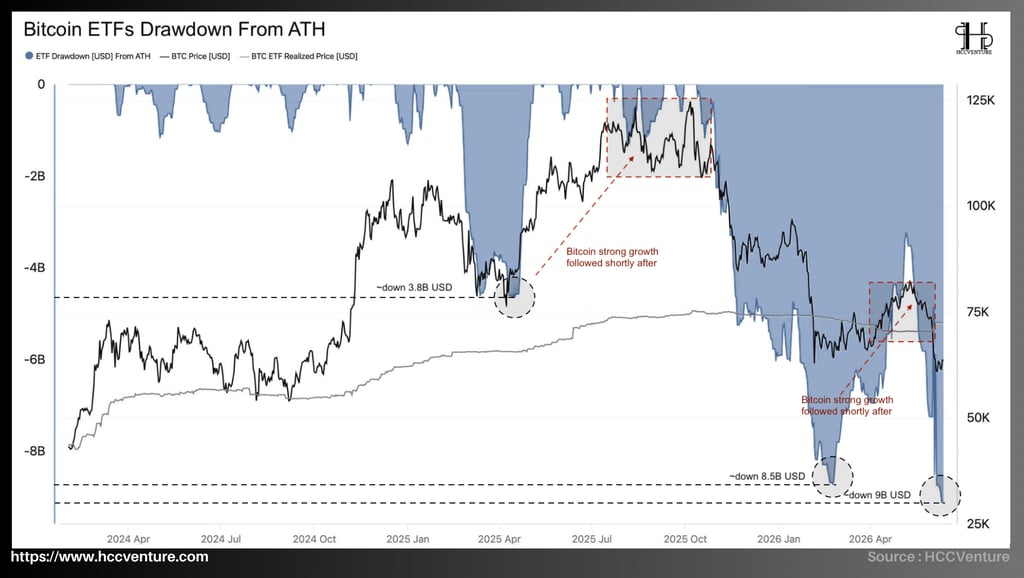
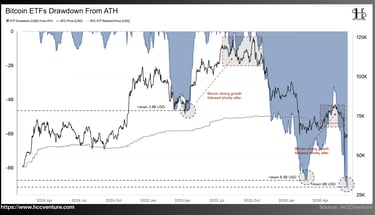
Bitcoin ETFs Drawdown From ATH reflects the decline in unrealized gains across the entire US Bitcoin Spot ETF ecosystem from its all-time high (ATH), according to current data, while the total decline in unrealized gains across ETFs has widened to approximately -$9 billion , the lowest level since the Bitcoin Spot ETF product officially launched.
The current decline not only reflects simple price volatility but also indicates a significant weakening of the institutional capital flow dynamics that appeared to have driven the entire 2024–2025 growth cycle. Each time an ETF drawdown peaked during this cycle, Bitcoin bottomed out and then entered a strong upward trend. Data has been recorded as follows:
• Drawdown of approximately $4 billion USD -> Bitcoin surged immediately afterward.
• Drawdown of approximately $8.5 billion -> Bitcoin continues its strong recovery.
• The current drawdown is nearly $9 billion -> a new extreme point in the cycle.
Historically, in the Bitcoin market, periods of price trading below the cost basis of large investor groups have often been accompanied by high levels of pessimism and significantly improved long-term expected returns. Currently, with Bitcoin prices approximately $12,000 to $14,000 below ETF cost basis, a large portion of the supply held by institutions is in a state of unrealized losses.
The continuous widening of the drawdown, instead of narrowing, indicates that selling pressure remains significantly greater than the ability of new capital to absorb it, a characteristic often seen in deep revaluation phases of a cycle rather than typical technical corrections.
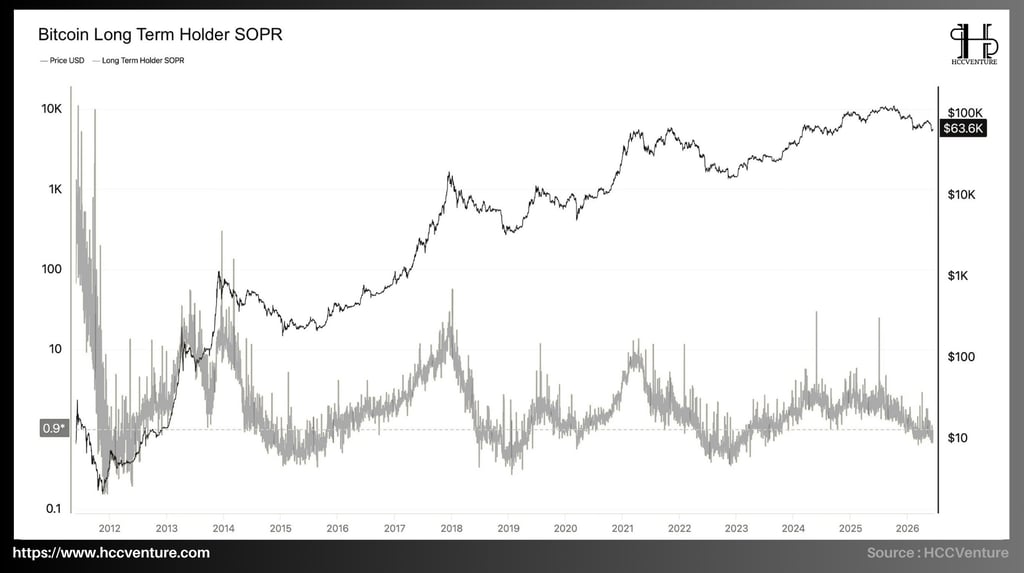
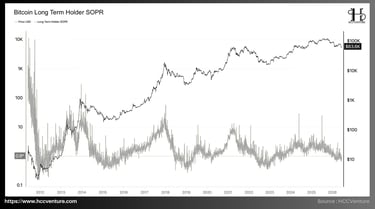
Bitcoin Long-Term Holder SOPR is currently signaling a clear weakening of the long-term profit structure. At 0.9 , the index has fallen below the equilibrium threshold of 1, confirming that investors holding for over 155 days are realizing losses instead of continuing to take profits as was the case for most of the previous bull cycle. This again shows that the long-term holding group has begun realizing losses, but without the large-scale sell-off seen in previous deep downturn cycles.
In previous cycles, a breakout of the LTH SOPR (Long-Term Price Percentage) of 1 typically signaled an increase in supply from long-term investors. As long-term holders began realizing losses, the market usually needed more time to absorb the new supply before a sustainable price base could be established.
In previous cycles, each time the index approached its historical low, it coincided with the market completing a significant portion of the leverage clearing process and redistributing supply from weak investors to those with a longer-term perspective. Now, with the LTH SOPR having fallen below the break-even point, the market is entering a zone where accumulated profits from the previous growth phase are gradually being erased, creating a necessary condition for establishing a new long-term accumulation cycle.
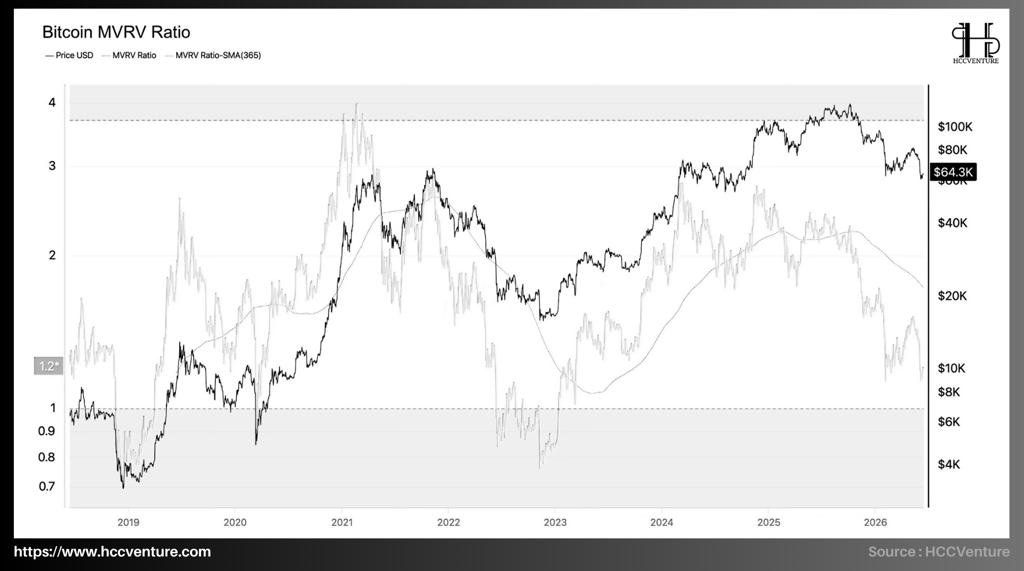
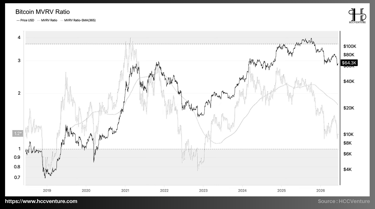
The Bitcoin MVRV Ratio is currently at around 1.2 , marking the lowest valuation level of the growth cycle that began in late 2022. Compared to the peak of nearly 4.0 in the 2021 cycle and around 2.7 during the euphoric phase of 2024-2025, the current level reflects a sharp contraction of unrealized gains across the network.
Following a prolonged correction, the MVRV has now fallen to around 1.2 , significantly lower than the annual average (365D SMA) which is currently fluctuating around 1.7–1.8 . The large gap between the current MVRV and the long-term average reflects a sharp contraction of unrealized earnings across the network and confirms the market is trading at a significant discount to the valuation levels of much of the recent growth cycle.
A decrease in MVRV means that a significant portion of investors' unrealized profits has been reduced considerably.
History shows that whenever the MVRV (Moving Average Value) falls from above 2.5 to near 1.0, the market typically enters a prolonged period of re-accumulation before forming the next major trend. This is the phase where speculative profits are eliminated, while supply gradually shifts to investors with a longer-term perspective.
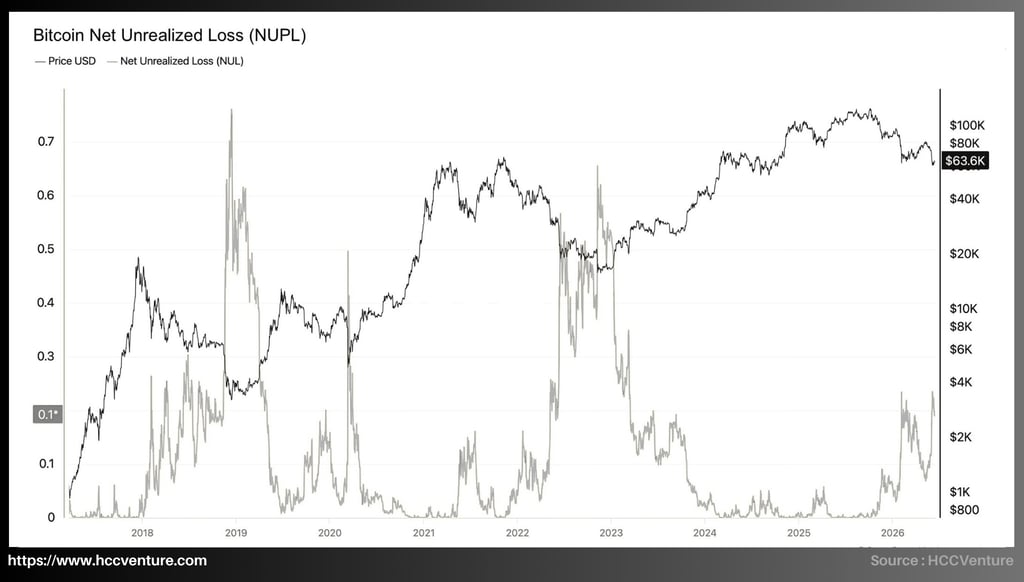
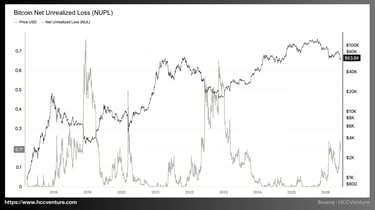
The Bitcoin Net Unrealized Loss (NUL) is currently fluctuating around 0.10 , its highest level since the beginning of the bull cycle following the 2022 bottom. This sharp increase in NUL reflects the growing number of investors moving into unrealized losses as Bitcoin's price corrected from above $100,000 to around $63,600.
Observing data from 2017 to the present shows that NUL typically fluctuates very low during periods of strong growth. For most of 2024 and the first half of 2025, this index remained almost constant around 0, reflecting the prevailing profit state across the market as Bitcoin traded above the cost basis for most investors.
Similarly, during the 2022 crisis, NUL peaked at around 0.65 , reflecting the severe capitulation following the collapse of the Terra, Three Arrows Capital, and FTX ecosystems.
When NUL surged from near 0 to 0.10 in a short period, it indicated that the market had absorbed a significant amount of unrealized losses. However, history also shows that sustainable bottoms typically only form when NUL reaches much more extreme levels and remains high for a sufficient duration to force weaker positions out of the market. The consensus among these indicators reinforces the view that Bitcoin is undergoing a deep correction in its bull cycle, where speculative gains have largely been erased and the market is moving closer to historically attractive valuation levels.
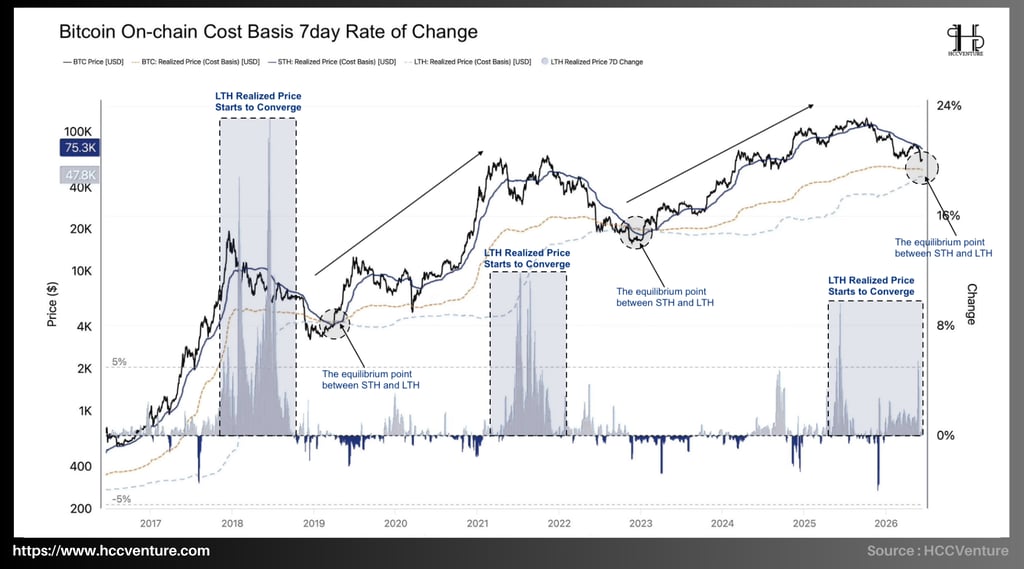

One of the most notable signals on the chart is the gap between the current Bitcoin price and the cost basis of short-term holders. With the STH Realized Price at $75,300 , while the trading price hovers around $63,000-$65,000, the majority of investors who entered the market in recent months are now experiencing unrealized losses.
This difference of over $10,000 is equivalent to an average loss of about 15-17% for short-term investors.
Historically, periods of market prices trading below the STH Cost Basis often occur during medium-term corrections or deep revaluation phases of bull cycles, reflecting continued psychological pressure and the potential for further stop-loss selling from new market entrants.
In contrast to the STH group, the cost basis for the LTH group is currently at $47,800 , approximately 25-30% lower than the current market price. This indicates that the majority of long-term supply is still maintaining relatively large profits despite the recent sharp correction.
In previous cycles, the difference between the market price and the cost price of LTH was a crucial factor determining the market's ability to absorb selling pressure. When the LTH group still had significant profits, the probability of systemic selling pressure occurring was generally lower than during periods of full-blown bear markets.
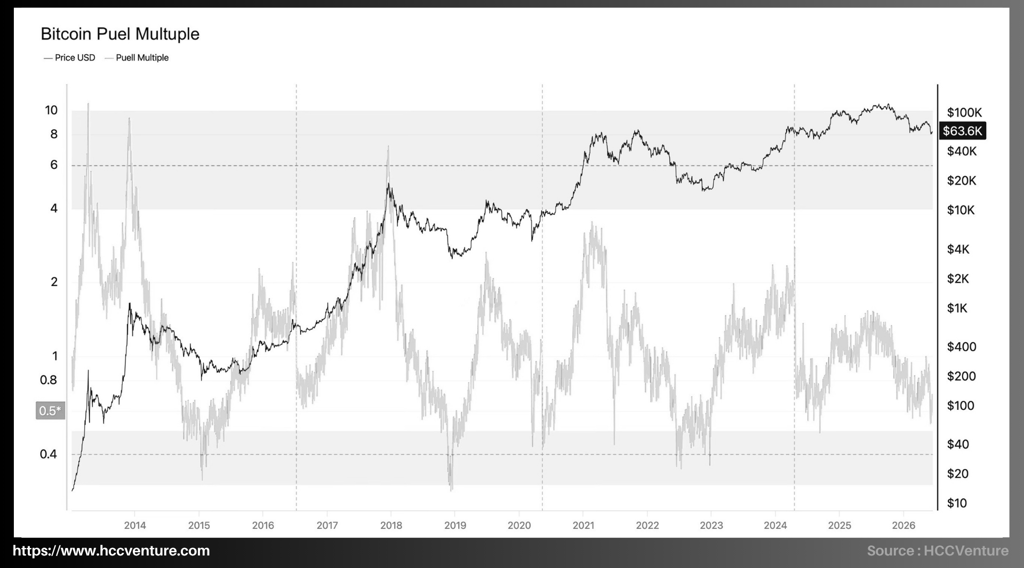
Observing the entire historical data from 2013 to the present shows that the key bottom areas of the Puell Multiple typically appear in the range of 0.3 to 0.5 . The cyclical bottoms of 2015, late 2018, and late 2022 all formed when this index fell below 0.5.
Currently, the Puell Multiple is at 0.5 , approximately 75% lower than its most recent peak of over 2.0 in 2024 and significantly lower than the long-term average around 1.0, while daily miner revenue is currently only about half of the most recent 365-day average.
Historically, periods where the Puell Multiple remained below 0.6 often reflected financial strain on the mining industry. When mining profitability plummeted, units with high operating costs were often forced to liquidate their BTC reserves to stay afloat.
However, after this purging process occurs, supply pressure from the mining pool usually decreases significantly because the remaining units have a more cost-effective structure. This is why low Puell Multiple areas often appear near the end of a correction rather than at the beginning of a bear market.
Compared to the peak lows of around 0.3 in 2018 and 2022 , the current value of 0.5 indicates that the market has not yet reached a state of complete exhaustion but is very close to historical revenue depletion, reflecting that much of the forced selling pressure from the mining industry has been absorbed over time.
Research and Analysis
Market Summary
Analyzing on-chain metrics
Bitcoin ETFs Drawdown From ATH
Bitcoin Long-Term Holder SOPR
Bitcoin MVRV Ratio
Bitcoin Net Unrealized Loss
STH Realized Price
Multiple Girl
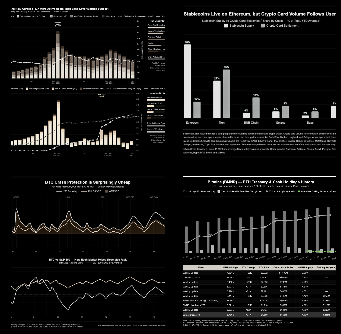
Bitcoin Spot Volume Bubble Map
Bitcoin Supply in Profit %
STH Whale Unrealized Profit/Loss
Value Days Destroyed Multiple
Assessment and Conclusion
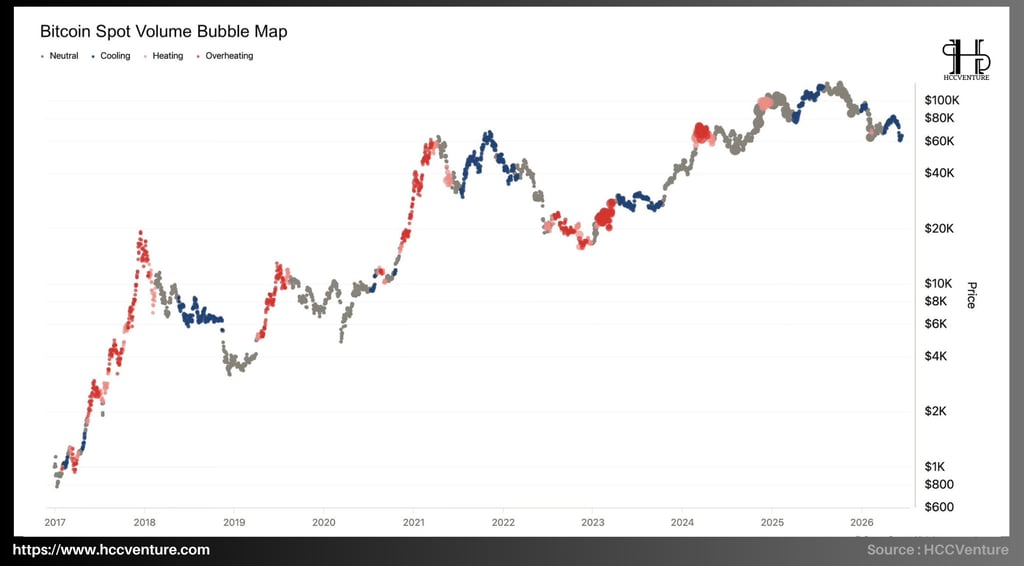
The Bitcoin Spot Volume Bubble Map indicator shows that the market is maintaining a cooling state , reflecting a significant decline in spot liquidity after the correction phase from the cycle peak above $100,000. Compared to the boom periods of 2017, 2021, and early 2025, trading volume is currently significantly lower and shows no signs of expanding again.
A notable feature of the current cycle is that the price surge to the $100,000–$110,000 range did not generate the same level of liquidity explosion as previous cycles. While overheating clusters will still appear in 2024 and early 2025, their size and duration will be significantly lower than in 2017 and 2021.
Currently, the prolonged cooling phase, extending into early 2026, indicates that the market is still absorbing the supply generated from the previous correction phase. Low trading volume reflects significantly reduced selling pressure, but also suggests that new demand is not yet strong enough to trigger a new growth cycle.
This data suggests that short-term speculative pressure has largely been removed from the market, while new capital inflows have not yet returned strongly enough to create a sustainable upward trend. Weakened liquidity, subdued trading activity, and the absence of overheated volume clusters are typical characteristics of the post-correction accumulation phase.
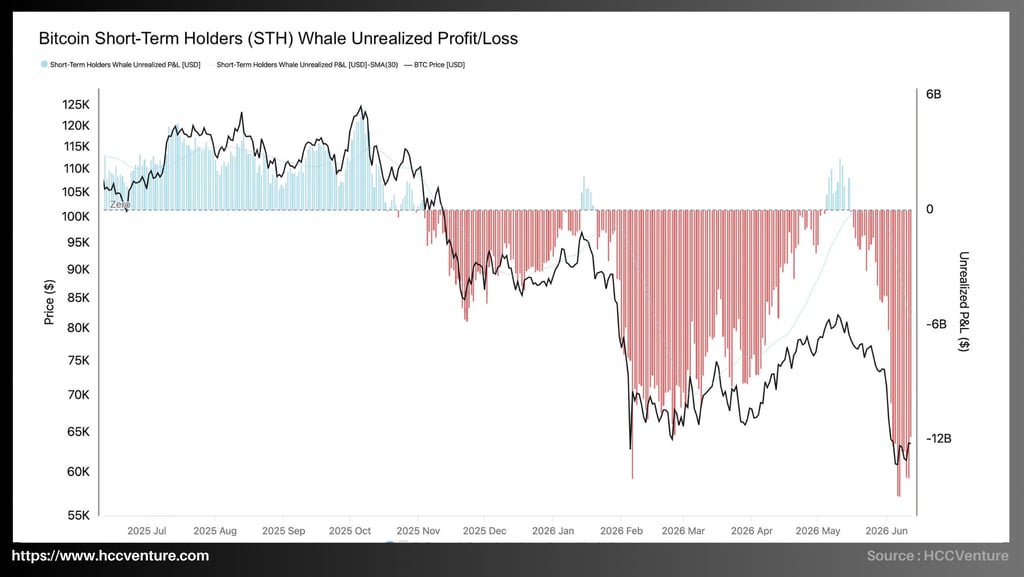
The STH Whale Unrealized Profit/Loss is currently showing the strongest pessimistic signal since the beginning of the cycle, with the short-term unrealized losses of the whale group widening to approximately -$12 billion to -$13 billion , the lowest level recorded on the chart. Compared to the nearly +$6 billion profit at the cycle peak in 2025, the market has witnessed a reversal in profits of nearly $19 billion .
Notably, the current losses not only wiped out all accumulated gains from the previous growth phase but also extended to the deepest negative level since the beginning of the cycle. From a peak profit of nearly +$6 billion to the current low of approximately -$13 billion , the total decline amounts to nearly $19 billion , reflecting one of the sharpest profit contractions ever recorded for large-scale short-term investors.
Bitcoin's history shows that periods of short-term whale profits falling to extremely low levels are often accompanied by a sharp decline in financial leverage, trading volume, and short-term speculative activity. As investors with high capital costs are forced to exit the market, the supply of speculative assets gradually decreases, and market control shifts to a group of long-term investors with higher confidence.
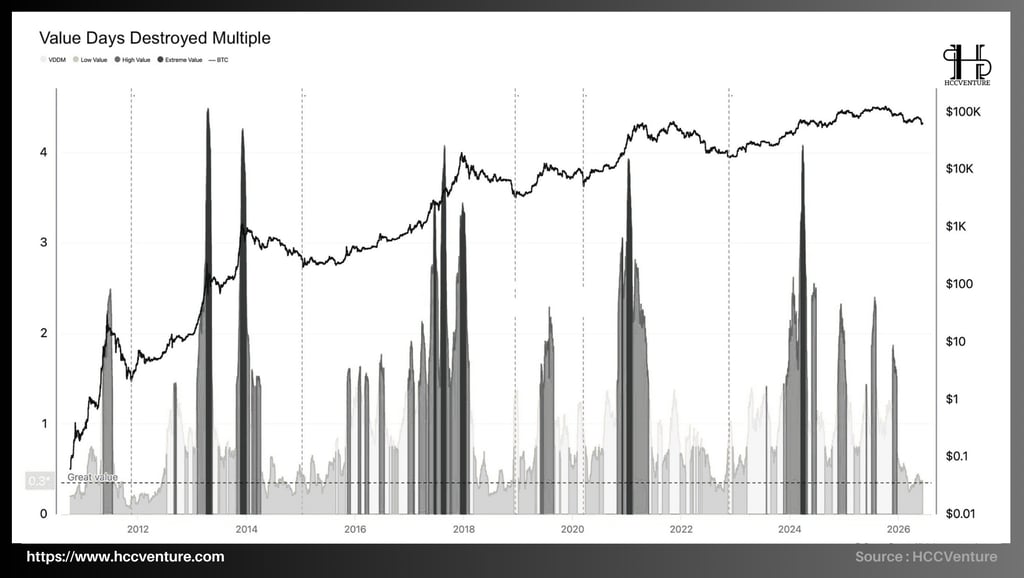
With Bitcoin trading significantly below its cycle peak but the VDD Multiple remaining at historically low levels, data suggests that current downward pressure is not coming from long-term holders. Instead, the supply pressure on the market is more likely coming from short-term investors, leveraged positions, and latecomers to the bull cycle.
The Value Days Destroyed Multiple is currently sending positive signals regarding the structure of Bitcoin's supply. After recording several extreme distributions with peaks above 4.0 during the 2024–2025 period, the index has sharply declined to around 0.3 , equivalent to the lowest point of the current cycle and close to historical lows that have appeared after major corrections.
The more than 90% drop from the distribution peaks indicates that profit-taking activity by long-term holders has significantly weakened. This confirms that the majority of long-term supply has completed profit realization during the previous bull market phase, while the remaining coins are trending towards continued holding rather than selling.
Assessment and Conclusion
After a sharp decline to the $60,000 region, the market underwent a significant revaluation as network-wide profitability declined rapidly, the proportion of profitable supply fell to multi-year lows, and a large portion of short-term investors entered a state of unrealized losses. The MVRV Ratio fell to around 1.2, significantly lower than the euphoric region above 3.0 seen at the cycle peaks, while the Net Unrealized Profit/Loss (NUPL) narrowed to approximately 0.1, indicating that much of the market's unrealized profit had been wiped out. Simultaneously, the Supply in Profit ratio fell to nearly 53%, much lower than the over 95% recorded at historical peaks, reflecting a strong rebalancing between market price and investor cost of capital.
Current financial pressure is concentrated primarily on short-term investors. The STH SOPR data has remained below 1 for an extended period, while over 95% of short-term holders have experienced losses. Indicators of unrealized profits for short-term whales also show negative figures in the billions of USD, similar to periods of heavy selling seen in previous cycles.
Conversely, indicators reflecting the behavior of Long-Term Holders suggest that long-term supply remains relatively stable. The Long-Term Holder SOPR has fallen close to 1 and repeatedly below the break-even point, reflecting that profit-taking activity has almost dried up. The Value Days Destroyed Multiple has also declined to low values around 0.3, significantly lower than the peaks above 4.0 seen during the strong distribution phase of 2024–2025.
Although much of the speculative leverage has been cleared, valuation indicators have become significantly more attractive than at the peak, and selling pressure from long-term holders is waning, the missing element is the return of sufficiently strong spot buying to establish a sustainable bottom. Although much of the speculative leverage has been cleared, valuation indicators have become significantly more attractive than at the peak, and selling pressure from long-term holders is waning, the missing element is the return of sufficiently strong spot buying to establish a sustainable bottom.
Disclaimer: The information presented in this article is the author's personal opinion in the field of cryptocurrencies. This is not financial or investment advice at all. Every investment decision should be based on careful consideration of your personal portfolio and risk tolerance. The opinion in the article does not represent the official position of the platform. We recommend that readers do their own research and consult experts before making any investment decisions.
API & Data: Glassnode
Synthesized and analyzed by HCCVenture
Join the HCCVenture organization here: https://link3.to/holdcoincventure
Explore HCCVenture group
HCCVenture © 2023. All rights reserved.


Connect with us
Popular content
Contact to us
E-mail : sp_contact@hccventure.com
Register : https://linktr.ee/holdcoincventure
Disclaimer: The information on this website is for informational purposes only and should not be considered investment advice. We are not responsible for any risks or losses arising from investment decisions based on the content here.
TERMS AND CONDITIONS • CUSTOMER PROTECTION POLICY
ANALYTICAL AND NEWS CONTENT IS COMPILED AND PROVIDED BY EXPERTS IN THE FIELD OF DIGITAL FINANCE AND BLOCKCHAIN BELONGING TO HCCVENTURE ORGANIZATION, INCLUDING OWNERSHIP OF THE CONTENT.
RESPONSIBLE FOR MANAGING ALL CONTENT AND ANALYSIS: HCCVENTURE FOUNDER - TRUONG MINH HUY
Read warnings about scams and phishing emails — REPORT A PROBLEM WITH OUR SITE.